
Implementation of A Low Cost Prototype for Electrical Impedance
Tomography based on the Integrated Circuit for Body Composition
Measurement AFE4300
V
´
ıctor Hugo Mosquera
1
, Adrian Arregui
2
, Ramon Brag
´
os
2
and Carlos Felipe Rengifo
1
1
Department of Electronic, University of Cauca, Street 5 # 4-70, Popay
´
an, Colombia
2
Department of Electronic Engineering, Technical University of Catalonia, Barcelona, Spain
Keywords:
Electrical Impedance Tomography, Image Reconstruction, Conductivity Distribution.
Abstract:
Electrical impedance tomography (EIT) is a technique of image reconstruction of the electrical conductivity
distribution in a tissue or region under observation. An electrical system for EIT comprises complex hardware
and software modules, which are designed for a specific application which requires that the system to be able
to detect conductivity variations within the study object. The Front-End for body composition measurement,
AFE4300 from Texas Instruments allows a minimal implementation of an electrical impedance tomography
system. It is the main device in the development of the EIT system presented in this paper, this device injects
the current signal and measures the tensions generated on the study region boundary by 8 electrodes, the
image reconstruction software was developed on the National Instruments platform Labview. The system
includes a microcontroller PIC16F886 to configure the 8 channels for the definition of the patterns of injection
and measurement of signals, also defines the current signal frequency and the bluetooth communication with
the computer for the image reconstruction. The developed system was validated by a planar resistive phantom
(CardiffEIT phantom), obtaining a stable voltage measurement every 50 ms per pair of electrodes, and a signal
to noise ratio (SNR) maximum of 71.8 dB, for a current signal of 50 kHz. Additionally, tests were carried out
in a saline tank with a concentration of 4 g/L, the developed system can simultaneously estimate the presence
of conductive and non-conductive disturbances into the tank.
1 INTRODUCTION
Patients suffering from urological disease or spinal
cord injury usually have difficulties perceiving blad-
der fullness and voiding due to neurological damage
or muscular atrophy. If these patients do not empty
their bladders on time, voiding dysfunction can result
in urinary tract infections and urinary reflux, which
may even lead to renal failure. The clinic process
for bladder emptying is done by inserting a catheter
into the bladder to drain urine, this method is invasive
and may cause urinary tract infection, besides that not
respect the micturition desire of patients. There are
techniques that apply the ultrasound and pressure sen-
sors for the bladder volume measurement for to as-
sist the bladder emptying, with the disadvantages of
the high noise and low precision of measurements (Li
et al., 2016).
The impedance distribution measurement is an-
other technique to measure the bladder volume with
the aim of assisting the process of emptying blad-
der. Electrical impedance tomography (EIT) is a non-
invasive technique that allows to get intra-thoracic im-
ages. The EIT systems are based on the injection of
currents and on the measurement of the resulting po-
tentials at the boundary, by means of electrodes. In
EIT applications on biological tissues, the currents
used are of sinusoidal nature, with amplitudes of a
few mA and frequencies ranging from 1 and 100 kHz.
Known the potentials and the currents at the object
boundary to be analyzed, a method of image recon-
struction is used to estimate the electrical conductiv-
ity distribution inside of the region (Harikumar et al.,
2013).
The EIT has numerous applications in the med-
ical field, successfully entering in the monitoring of
intracranial hemorrhages or hematomas (Ayati et al.,
2015), cancer detection (Gao et al., 2014), study of
pelvic fluid accumulation (Li et al., 2016), pulmonary
ventilation analysis (Bordes et al., 2016), blood pres-
sure measurement (Proenc¸a et al., 2016), among oth-
ers. The non-invasive and radiation-free character
Mosquera, V., Arregui, A., Bragós, R. and Rengifo, C.
Implementation of a Low Cost Prototype for Electrical Impedance Tomography based on the Integrated Circuit for Body Composition Measurement AFE4300.
DOI: 10.5220/0006554901210127
In Proceedings of the 11th International Joint Conference on Biomedical Engineering Systems and Technologies (BIOSTEC 2018) - Volume 1: BIODEVICES, pages 121-127
ISBN: 978-989-758-277-6
Copyright © 2018 by SCITEPRESS – Science and Technology Publications, Lda. All rights reserved
121
of the EIT makes this technique a good alternative
for supporting the diagnosis and monitoring of med-
ical pathologies (Harikumar et al., 2013), (Islam and
Kiber, 2014).
Many studies have been advanced in the imple-
mentation of EIT systems, oriented to the detection
and monitoring of medical pathologies, these works
focus on the development of efficient and portable
equipment, using electronic programmable devices.
Within the studies developed we highlight the use of
FPGA
0
s (Field programmable Gate array) or DSP
0
s
(Digital Signal Processors), devices that allow to de-
velop tomographic system capable of generating up
to 50 images per second, which has promoted the
use of EIT in problems with a high variation of the
conductivity per unit of time, for example the mon-
itoring of the blood pressure (Proenc¸a et al., 2016),
(Balleza-Ordaz et al., 2015), (Bordes et al., 2016).
For EIT systems oriented to medical applications with
a low temporal variability of its conductivity, the use
of microcontrollers presents good results as evidenced
in (Chitturi et al., 2014), (Fouchard et al., 2014) and
(Huang et al., 2016), with a lower cost compared to
systems developed with DSP
0
s and FPGA
0
s. Appli-
cations such as the bladder emptying and studies of
the cranial cavity and the bone system are fields in
which low-frequency EIT systems can be used in pro-
cesses of monitoring and pathologies detection (Li
et al., 2016), (Atefi et al., 2016), (Ron et al., 2016).
The aim of this paper is to propose a new, low
cost, 8 channels EIT system for rapid prototyping, in-
tended for monitoring bladder emptying, process that
need a low quantity of images per second, based on
the body composition measurement device of Texas
Instruments AFE4300. The hardware structure of the
system is presented in section 2. The algorithm for
the reconstruction of conductivity distribution images
is described in section 3 and the experimental results
in a saline tank are presented in section 4.
2 HARDWARE STRUCTURE
EIT systems require the injection of a sinusoidal
current of both constant amplitude and frequency
and also the measurement of the potential difference
across the electrodes around the boundary of the ob-
ject under study. The values of the injected current
and the potentials measured on the electrodes are used
as the inputs to the reconstruction algorithm, produc-
ing images of the electrical conductivity distribution.
The system presented in this work generates a current
signal of 833 µA at 50 kHz, which is injected by ad-
jacent pairs of electrodes (Texas-Instruments, 2012).
The measure of the potentials is carried out by using
the adjacent electrode pairs method. These injection
and measurement patterns can be modified by config-
uring the registers of the AFE4300.
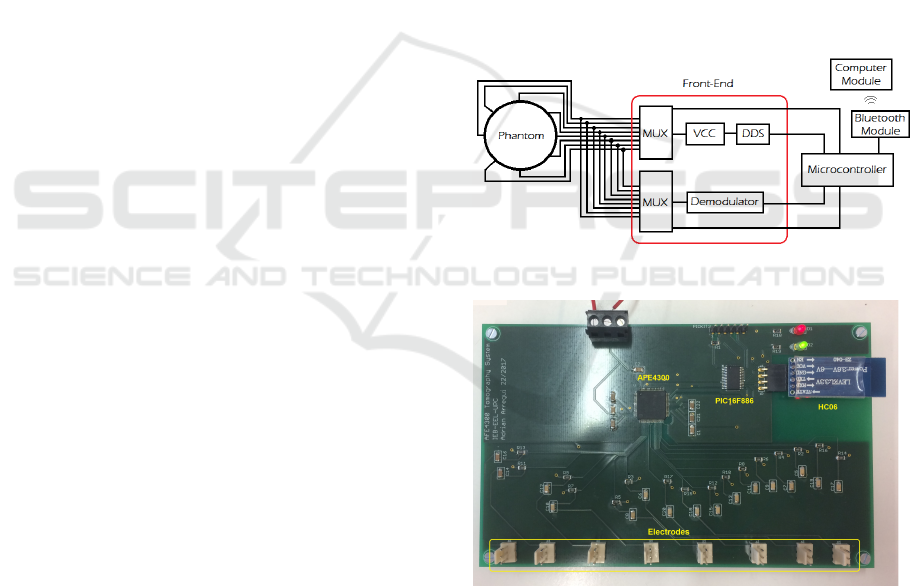
The EIT system consists of a mixed front-end
(AFE4300), which has 8 ports for current injection
and 8 ports for potentials measurement, also inte-
grates the direct digital synthesizer (DDS), voltage-
controlled current source (VCCS), voltage sensing,
quadrature demodulator or full-wave rectifier and the
multiplexing stages for injection and measurement.
The LabVIEW platform of National Instruments is
used for the communication with the hardware and
for the implementation of the image reconstruction
algorithm. A microcontroller PIC16F886 connected
to Bluetooth module HC06 is used as the interface
between the PC running Labview and the AFE4300
based system. The block diagrams of the overall sys-
tem is depicted in figure 1. A photograph of the card
with the electronic components is presented in 2.
Figure 1: EIT system diagram.
Figure 2: EIT system implemented.
2.1 Front-End AFE4300
To measure the body impedance, the AFE4300 gener-
ates a sinusoidal signal by means of a DDS. The fre-
quency of this signal can be programmed from a 10-
bit record. The DDS output signal feeds a 6-bit DAC
whose refresh rate is 1 msps. The high-frequency
components of the DAC output signal are eliminated
BIODEVICES 2018 - 11th International Conference on Biomedical Electronics and Devices
122

by means of a low pass band second-order filter with
a cut-off frequency of 150 kHz. The DC component
of the signal delivered by the filter is removed by
means of a in series external capacitor. One of the
capacitor terminals is the input signal to a voltage-
current converter that is connected to a multiplexer
and then to the current injection ports (IOUTX). The
injection pattern is programmed through the configu-
ration register ISW MUX. Figure 3 shows the scheme
of body composition meter module of the AFE4300
described.
The voltage to current conversion is made through
the following equation:
i(t) =
V
AC
R
1
(1)
Being R
1
= 1.5 kΩ ± 20% an internal element of
the AFE4300. Considering the minimal value of R
1
,
the maximal current generated is equal to the RMS
value of the voltage (1V
pp
/(2
√
2) divided by 1.2 kΩ,
equivalent to 294.5 µA, which is below the maxi-
mum allowable current for a human being that is 500
µA (Master and Mark, 2012).
Figure 3: Front-End AFE4300 (Texas-Instruments, 2012).
The object to which the current signal is injected
generates a voltage difference between the measuring
electrodes, due to the internal conductivity distribu-
tion of the object. This voltage difference is sensed
by the AFE4300 through the voltage ports (VSEN-
SEx). Voltage measurements are performed using the
adjacent electrode method, which is defined by the
programming register VSENSE MUX of AFE4300.
Voltage measurements are entered into a differential
amplifier, which determines voltage variation due to
conductivity changes within the study object. This
variation can be obtained by full wave rectification
or by quadrature (I/Q). The first option provides
the magnitude of the impedance, while the second
one generates the real and the imaginary parts of the
impedance (Texas-Instruments, 2012). For this devel-
opment the first measurement option is used, which
after performing the full wave rectification, a low pass
filter is used to generate a DC signal proportional to
the impedance module |Z| (Equation (2)).
V
DC
=
2
T
Z
T /2
A
|
Z
|
sin(ω
0
t + θ)dt =
2A
|
Z
|
π
= K
|
Z
|
(2)
K is the proportionality constant due to calibra-
tion. For this study, the calibration ports of the device
are not used, in order to have the availability of the
8 channels for the injection and measurement signals.
The voltage values in the electrodes are sent to the
PIC16F886, to be later transmitted via Bluetooth to
the computer where the image reconstruction of the
conductivity distribution is carried out.
As can be demonstrated, the system is of easy im-
plementation and consists of a few number of elec-
tronic components, making this a compact and a
portable system. Other EIT systems implemented
with FPGA
0
s, DSP
0
s or microcontrollers, despite
their promising results, are systems that involve sev-
eral modules such as VCCS, Multiplexing, AD and
DA converters and their respective interfaces, which
makes these proposals, complex systems, such as
those presented in (Bera and Nagaraju, 2009), (Kha-
lighi et al., 2012) and (Wi et al., 2014).
The system designed is also low cost with a cost
of 65.60e. The prices of the devices AFE4300,
PIC16F886 and HC06 respectively are 4.58e, 2.09e
and 11.61e; passive elements such as resistors and
capacitors, in addition to electrode connectors, 2000
mA LiPo 3.7 V battery and Power Cell LiPo Charger,
have a price of 47.32e. Other systems based on
FPGA Virtex or Ciclon (Santos et al., 2016), (Khan
et al., 2015), (Shi et al., 2016) are more expensive as
these devices exceed 280e, for which our proposal a
more economical prototype.
3 IMAGES RECONSTRUCTION
The process of obtaining a conductivity distribution
within the object from the current and voltage mea-
surements on boundary is called the reconstruction
algorithm. The reconstruction algorithms solve a
mathematical problem that is nonlinear and ill-posed.
There are several reconstruction methods, such as
the absolute, dynamic and multifrequency (Santos
and Simini, 2013). This work uses the dynamic
method, which performs the reconstruction process
Implementation of a Low Cost Prototype for Electrical Impedance Tomography based on the Integrated Circuit for Body Composition
Measurement AFE4300
123

from changes in conductivity, due to changes in
the voltages in the electrodes, this technique is also
known as differential image.
Considering that the injection and measurement
are carried out in pairs of adjacent electrodes, it is pos-
sible to detect a voltage drop in any pair of electrodes.
The gray region of the figure 4 shows the area whose
changes in conductivity (δσ) generate changes over
adjacent electrodes. These changes are a function of
the measured voltages in different time or frequency
and are estimated by the equation (3).
Figure 4: Conductivity changes Detection.
δσ(x,y) = −
1
N
∑
i=1
Φ(u
k
(t
0
),u
k
(t
0
+ ∆t), ω
i
) (3)
The change of conductivity δσ by a pixel in a
given position (x,y) is estimated by the sum of the
voltage changes (Φ) produced in all the equipotential
regions, defined by the measuring electrodes, where
that pixel belongs. For each injection combination
(ω
i
), one pixel will then belong only to one equipo-
tential region u
k
; For the implementation of the re-
construction algorithm is defined a weighting func-
tion W (x, y,ω
i
), which is related to the conductivity
sensitivity changes within the study object, then the
mathematical model that describes the conductivity
distribution is:
δσ = −
1
N
∑
i=1
Φ (u
k
(t
0
),u
k
(t
0
+ ∆t) , ω
i
)W (x, y,ω
i
)
(4)
The function Φ being calculated as:
Φ(u
i
(t
0
),u
i
(t
0
+ ∆t), ω
i
) = ln(
u
i
(t
0
+ ∆t)
u
i
(t
0
)
)
≈
u
i
(t
0
+ ∆t) −u
i
(t
0
)
u
i
(t
0
)
(5)
The reconstruction method represented by the
equations (4) and (5) is implemented in C++ and
compiled in a DLL (Dynamic Link Library), to later
be used in a LabVIEW application.
4 EXPERIMENTAL TESTS
To verify the performance of the proposed EIT sys-
tem the signal to noise ratio (SNR) is evaluated, this
parameter estimates the precision of measurement,
which quantified the repeatability of measurement un-
der unchanged conditions. For the analysis of the
SNR, a current signal of 50 kHz is injected into a 2D
resistive phantom (Cardiff EIT Phantom). The SNR
is calculated as the quotient between the mean and the
standard deviation of each of the 30 measured frames.
Different values of the delay between measures were
tested 10, 25, 50 and 100 ms, with objective of to
found the best characteristics the SNR. The results are
presented in the table 1, which indicates that delay of
50 ms per measurement presents the best characteris-
tics of SNR. This because of when switching a new
channel, there is a transient that adds dispersion to
the measurement if the delay between switching and
acquiring is shorter than 25 ms. The dispersion im-
proves if we wait for 50 ms, but it does not improve
and even grows if the delay is 100 ms or more because
there is a slow drift in the measured voltages that can
be observed at the signal inputs, that is the reason of
the dispersion increase for longer delays.
Table 1: SNR for different measurement times.
SNR (dB)
Maximum Average Minimum
10 ms 40.7 17.82 4.55
25 ms 74.73 28.57 9.74
50 ms 71.81 47.77 24.04
100 ms 56.04 45.7 33.95
Once the measurement time has been defined (50
ms), tests are carried out in a tank with a saline
solution with conductive and non-conductive distur-
bances. The test for the image
0
s reconstruction be-
gins by determining the conductivity distribution of
the tank with the saline solution, with a concentration
of salt of 4g/L, in order to define the frame of ref-
erence for the dynamic reconstruction of subsequent
images with the presence of disturbances. Once the
reference frame is determined, conductive and non-
conductive materials are inserted into the tank to eval-
uate the potential change over the surface electrodes.
In Figure 5 it is possible to observe the conductiv-
ity distribution within the tank without disturbances,
BIODEVICES 2018 - 11th International Conference on Biomedical Electronics and Devices
124
in which small variations in the conductivity distribu-
tion can be observed.
Figure 5: Reconstruction the conductivity distribution of the
tank with saline solution.
Figure 6 shows the image reconstruction of the
tank with a non-conductive disturbance (peek bar).
From this Figure it can be observed that the object
causes a disturbance that is represented by blue color
due to a negative conductivity change of −0.9. The
same procedure is carried out for a conductive distur-
bance object which generates a change of conductiv-
ity of +0.9 in the reconstructed image (Figure 7).
Figure 6: Reconstruction of conductivity distribution with
non-conductive artefact.
Figure 7: Reconstruction of conductivity distribution with
conductive artefact.
Finally, the test is carried out with both a conduc-
tive and a non-conductive simultaneously, to evaluate
the capacity of the proposed system to detect various
types of disturbances. The figure 8 shows test result,
in which the image clearly evidence the two objects
of disturbance, discriminating between disturbances
generated by the conductive and non-conductive ma-
terials.
Figure 8: Reconstruction of conductivity distribution with
non-conductive and conductive artefacts.
The results do not show good accuracy between
the disturbance and the reconstructed image, which
can be improved with a method to minimizing elec-
trode interface impedance and a more elaborated im-
age reconstruction algorithm. On the other hand,
the system allows to detect changes in conductivity
within a saline environment which makes this sys-
tem a viable alternative to performing the study of
slow physiological processes such as bladder emp-
tying (Li et al., 2016), hematomas and hemorrhages
studies (Aristovich et al., 2016).
The proposed system presents advantages over
other developed devices because the AFE4300 con-
centrates the functions of: (i) electrical current gen-
eration, (ii) voltage measurement, (iii) multiplexing,
and (iv) demodulation, reducing the modules of the
system and its respective interfaces, facilitating its
implementation at a low cost. Designs like the one
presented in (Bera and Nagaraju, 2009), which em-
ploys a MAX038 for the generation of the current
signal and a QuadTech7600 for the potential sensing,
or in (Khalighi et al., 2012) that uses a XR2206 for
waveform generation and a CD4067B for multiplex-
ation, besides other modules, which makes the sys-
tem a complex alternative to implement. On the other
hand in (Wi et al., 2014) is presented a system called
Khu Mark 2.5, is a fairly complex modular equipment
that achieves 100 frames per second, but with a high
economic cost.
5 CONCLUSION
The designed system has a maximum SNR of 71.81
dB, which allows detecting conductivity variations in
a saline tank. The time delay of 50 ms between mea-
surements makes this prototype a good alternative for
Implementation of a Low Cost Prototype for Electrical Impedance Tomography based on the Integrated Circuit for Body Composition
Measurement AFE4300
125

the study of pathologies that do not require a high
frames frequency.
The proposed system requires a few electronic
components, which makes it easy to implement. On
the other hand its characteristics can be improved by
using more advanced methods of images reconstruc-
tion, which contribute to the decrease of the effects
of the noise and to have a better SNR (Hadinia and
Jafari, 2015), (Islam and Kiber, 2014).
REFERENCES
Aristovich, K. Y., Packham, B. C., Koo, H., dos Santos,
G. S., McEvoy, A., and Holder, D. S. (2016). Imag-
ing fast electrical activity in the brain with electrical
impedance tomography. NeuroImage, 124, Part A:204
– 213.
Atefi, S. R., Seoane, F., Kamalian, S., Rosenthal, E.,
Lev, M., and Bonmassar, G. (2016). Intracranial
haemorrhage alters scalp potential distributions in
bioimpedance cerebral monitoring applications : pre-
liminary results from FEM simulation on a realistic
head model and human subjects. Medical Physics,
43(2):675–686. QC 20170111.
Ayati, S. B., Bouazza-Marouf, K., and Kerr, D. (2015).
In vitro localisation of intracranial haematoma using
electrical impedance tomography semi-array. Medi-
cal engineering & physics, 37(1):34–41.
Balleza-Ordaz, M., Perez-Alday, E., Vargas-Luna, M., and
Riu, J. (2015). Tidal volume monitoring by electrical
impedance tomography (EIT) using different regions
of interest (ROI): Calibration equations. Biomedical
Signal Processing and Control, 18:102 – 109.
Bera, T. K. and Nagaraju, J. (2009). A Simple instrumen-
tation calibration technique for Electrical Impedance
Tomography (EIT) using a 16-electrode phantom. In
2009 IEEE International Conference on Automation
Science and Engineering, pages 347–352.
Bordes, J., Goutorbe, P., Cungi, P. J., Boghossian, M. C.,
and Kaiser, E. (2016). Noninvasive ventilation during
spontaneous breathing anesthesia: an observational
study using electrical impedance tomography. Jour-
nal of Clinical Anesthesia, 34:420 – 426.
Chitturi, V., Farrukh, N., Thiruchelvam, V., and Fei, T. K.
(2014). A Low Cost Electrical Impedance Tomogra-
phy (EIT) for Pulmonary Disease Modelling and Di-
agnosis. In The Second International Conference on
Technological Advances in Electrical, Electronics and
Computer Engineering (TAEECE2014), pages 83–89.
The Society of Digital Information and Wireless Com-
munication.
Fouchard, A., Noca, A., Bonnet, S., Pham, P., Sinniger, V.,
Clarenon, D., and David, O. (2014). Modular archi-
tecture of a multi-frequency electrical impedance to-
mography system: Design and implementation. In
2014 36th Annual International Conference of the
IEEE Engineering in Medicine and Biology Society,
pages 6076–6079.
Gao, J., Yue, S., Chen, J., and Wang, H. (2014). Classifica-
tion of normal and cancerous lung tissues by electrical
impendence tomography. Bio-medical materials and
engineering, 24(6):2229–2241.
Hadinia, M. and Jafari, R. (2015). An element-free galerkin
forward solver for the complete-electrode model in
electrical impedance tomography. Flow Measurement
and Instrumentation, 45:68–74.
Harikumar, R., Prabu, R., and Raghavan, S. (2013). Electri-
cal impedance tomography (EIT) and its medical ap-
plications: a review. Int J Soft Comp Eng, 3(4):193–8.
Huang, J.-J., Hung, Y.-H., Wang, J.-J., and Lin, B.-S.
(2016). Design of wearable and wireless electrical
impedance tomography system. Measurement, 78:9–
17.
Islam, M. R. and Kiber, M. A. (2014). Electrical impedance
tomography imaging using gauss-newton algorithm.
In Informatics, Electronics & Vision (ICIEV), 2014 In-
ternational Conference on, pages 1–4. IEEE.
Khalighi, M., Vahdat, B. V., Mortazavi, M., Hy, W., and
Soleimani, M. (2012). Practical design of low-cost in-
strumentation for industrial Electrical Impedance To-
mography (EIT). In Instrumentation and Measure-
ment Technology Conference (I2MTC), 2012 IEEE In-
ternational, pages 1259–1263. IEEE.
Khan, S., Manwaring, P., Borsic, A., and Halter, R. (2015).
FPGA-based voltage and current dual drive system
for high frame rate electrical impedance tomography.
IEEE Transactions on Medical Imaging, 34(4):888–
901.
Li, R., Gao, J., Li, Y., Wu, J., Zhao, Z., and Liu, Y. (2016).
Preliminary study of assessing bladder urinary volume
using electrical impedance tomography. Journal of
Medical and Biological Engineering, 36(1):71–79.
Master, T. and Mark, T. (2012). Medical electrical equip-
ment part 1: General requirements for basic safety and
essential performance.
Proenc¸a, M., Braun, F., Muntan
´
e, E., Sol
`
a, J., Adler, A.,
Lemay, M., Thiran, J.-P., and Rimoldi, S. F. (2016).
Non-invasive monitoring of pulmonary artery pres-
sure at the bedside. In Engineering in Medicine and
Biology Society (EMBC), 2016 IEEE 38th Annual
International Conference of the, pages 4236–4239.
IEEE.
Proenc¸a, M., Braun, F., Sol
`
a, J., Thiran, J.-P., and Lemay,
M. (2016). Noninvasive pulmonary artery pressure
monitoring by EIT: a model-based feasibility study.
Medical & Biological Engineering & Computing,
pages 1–15.
Ron, A., Abboud, S., and Arad, M. (2016). Home mon-
itoring of bone density in the wrista parametric EIT
computer modeling study. Biomedical Physics & En-
gineering Express, 2(3):035002.
Santos, E. and Simini, F. (2013). Comparison of electri-
cal impedance tomography reconstruction techniques
applied to IMPETOM system. In Bioinformatics and
Bioengineering (BIBE), 2013 IEEE 13th International
Conference on, pages 1–4. IEEE.
Santos, S. A., Robens, A., Boehm, A., Leonhardt, S., and
Teichmann, D. (2016). System Description and First
BIODEVICES 2018 - 11th International Conference on Biomedical Electronics and Devices
126

Application of an FPGA-Based Simultaneous Multi-
Frequency Electrical Impedance Tomography. Sen-
sors (14248220), 16(8):1 – 21.
Shi, X., You, F., Xu, C., Ji, Z., Liu, R., Dong, X., Fu,
F., and Huo, X. (2016). Design and implementa-
tion of a high-precision electrical impedance tomog-
raphy data acquisition system for brain imaging. In
2016 IEEE Biomedical Circuits and Systems Confer-
ence (BioCAS), pages 9–15.
Texas-Instruments (2012). Datasheet-AFE4300-Low-Cost,
Integrated Analog Front-End for Weight-Scale and
Body Composition Measurement. Dallas, Texas,
USA.
Wi, H., Sohal, H., McEwan, A. L., Woo, E. J., and Oh,
T. I. (2014). Multi-frequency electrical impedance to-
mography system with automatic self-calibration for
long-term monitoring. IEEE transactions on biomed-
ical circuits and systems, 8(1):119–128.
Implementation of a Low Cost Prototype for Electrical Impedance Tomography based on the Integrated Circuit for Body Composition
Measurement AFE4300
127
