
Cross-cohort Evaluation of Machine Learning Approaches to Fall
Detection from Accelerometer Data
Aneta Lisowska
1,2
, Alison O’Neil
1
and Ian Poole
1
1
Toshiba Medical Visualization Systems Europe Ltd., 2 Anderson Place, Edinburgh, U.K.
2
School of Engineering and Physical Sciences, Heriot-Watt University, Edinburgh, U.K.
Keywords:
Fall Detection, Accelerometer Data, Machine Learning, Wearable Devices.
Abstract:
Falls in seniors can lead to serious physical and psychological consequences. A fall detector can allow a fallen
person to receive medical intervention promptly after the incident. The accelerometer data from smartphones
or wearable devices can be used to detect falls without serious privacy intrusion. Common machine learning
approaches to fall detection include supervised and novelty based methods. Previous studies have found
that supervised methods have superior performance when tested on participants from the population cohort
resembling the one they were trained on. In this study, we investigate if the performance remains superior
when they are tested on a distinctly different population cohort. We train the supervised algorithms on data
gathered using a wearable Silmee device (Cohort 1) and test on smartphone data from a publicly available
data set (Cohort 2). We show that the performance of the supervised methods decreases when they are tested
on distinctly different data, but that the decrease is not substantial. Novelty based fall detectors have better
performance, suggesting that novelty based detectors might be better suited for real life applications.
1 INTRODUCTION
Falls continue to be an important public health prob-
lem for the elderly population. A reliable automatic
fall detector could reassure a faller of the prompt ar-
rival of medical help and reduce the risk of further
health-related complications. Due to privacy con-
cerns connected with vision-based fall detection sys-
tems, body-worn acceleration based devices are pop-
ularly used instead, especially when real world de-
ployment is the goal (Igual et al., 2013). The ac-
celerometer data can be gathered using smartphones
(Albert et al., 2012; Lee and Carlisle, 2011; Medrano
et al., 2014b) or wearable sensors attached to the
waist (Chen et al., 2006), wrist (such as smartwatches
(Lutze and Waldh
¨
or, 2016)), chest (Lisowska et al.,
2015) or head (Kangas et al., 2008).
Simple accelerometer based fall detection systems
use thresholding (Bourke et al., 2007). More pre-
cise fall detection methods rely on supervised ma-
chine learning. In supervised learning approaches, a
classifier is trained on data labelled as Activities of
Daily Living (ADL) or falls. Fall detectors trained
in this manner offer high classification accuracy (e.g.
(Albert et al., 2012)) when the test data are similar
to the data it was trained on. The challenge arises
when fall detectors are trained on simulated falls from
a younger population, but deployed to classify the real
falls of elderly people. It is unclear how generalisable
these detectors are to data from different populations
or from different devices.
To avoid the need to simulate falls for training
an algorithm, fall detection can be formulated as an
outlier — or novelty — detection problem (Zhang
et al., 2006). In this setting the detector is trained
only on ADL data. New events are classified as falls
if they are very different from the ADL training data.
The novelty detection approach, even though it does
not match the supervised approach performance when
tested on the same population cohort (Medrano et al.,
2014a), shows promise for real-life deployment. Fur-
ther, examples of ADL may be gathered from the user
passively by their smartphone or by a wearable device
allowing for continuous training and personalisation
of the detector. The limitation of novelty detection
approaches is that any unusual activity may be classi-
fied as a fall.
In (Lisowska et al., 2015), we suggested that this
problem could be addressed by identifying the dimen-
sion in which the detector should look for novelty.
This dimension could be found by fitting principal
component analysis (PCA) to a mixture of ADLs and
falls from a training dataset or by extracting features
from a Convolutional Neural Network (CNN) trained
in a supervised manner. In this approach the nov-
elty detector is trained on the ADLs projected onto
Lisowska, A., O’Neil, A. and Poole, I.
Cross-cohort Evaluation of Machine Learning Approaches to Fall Detection from Accelerometer Data.
DOI: 10.5220/0006554400770082
In Proceedings of the 11th International Joint Conference on Biomedical Engineering Systems and Technologies (BIOSTEC 2018) - Volume 5: HEALTHINF, pages 77-82
ISBN: 978-989-758-281-3
Copyright © 2018 by SCITEPRESS – Science and Technology Publications, Lda. All r ights reserved
77
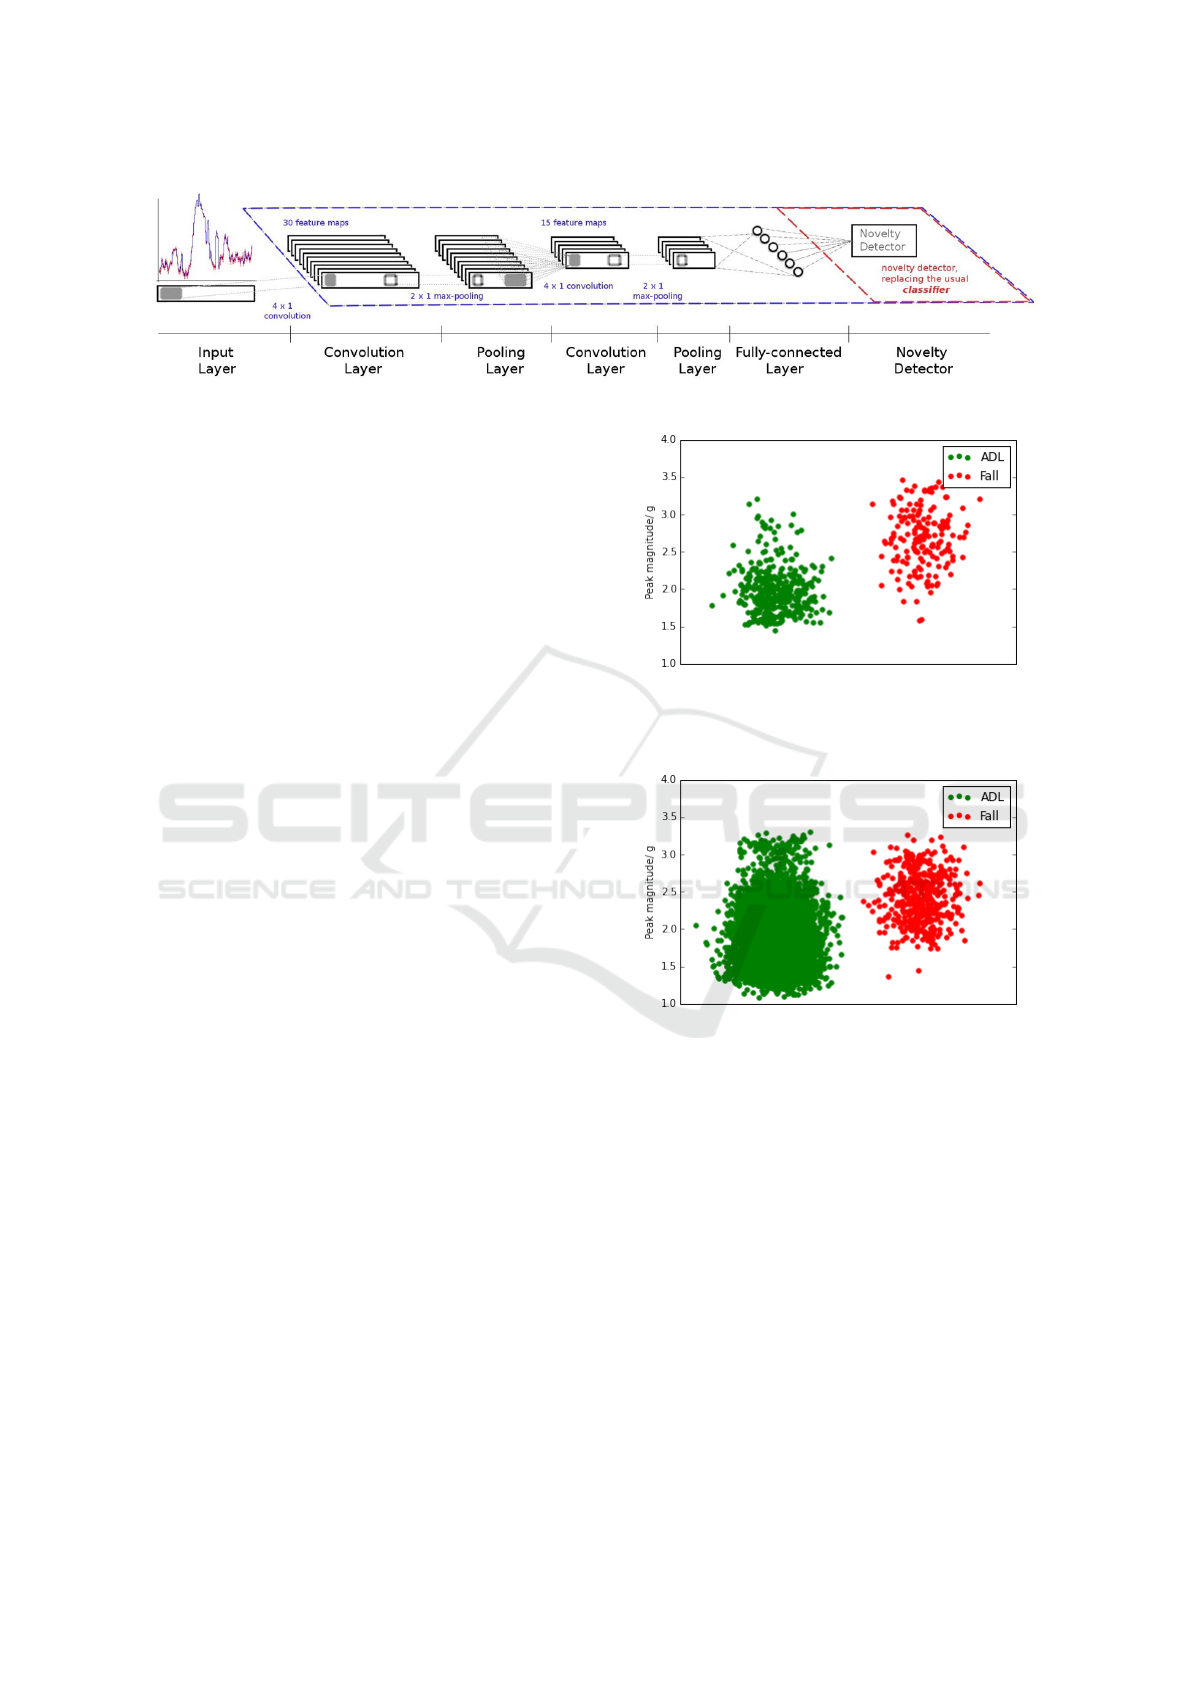
Figure 1: Novelty Hybrid CNN.
the space of the maximal variation or on the features
extracted by the CNN (see Figure 1).
We also performed evaluation of supervised and
novelty based approaches and found that supervised
fall detection methods offer superior performance
when the algorithms are trained and tested on the
same population cohort. However, in a real life sce-
nario the end user of the fall detection device would
be an elderly person, who cannot be asked to simu-
late falls, which are needed to train supervised clas-
sifiers. Therefore, it is important to evaluate the fall
detector on a population which differs from the one on
which the algorithms were trained. The AUC scores
obtained from such evaluation might be closer to the
fall detector performance obtained in real life.
In this study we use data from two distinct pop-
ulation cohorts and conduct four comparative experi-
ments to address the following three hypotheses:
1. The performance of the supervised fall detection
algorithms will decrease when tested on a differ-
ent population cohort.
2. Personalised novelty detectors trained on ADLs
from the test individual will show superior per-
formance to supervised methods trained on a dif-
ferent cohort.
3. Novelty hybrid methods will show advantage over
novelty methods as they are looking for novelties
in the appropriate feature space.
2 DATASETS
Cohort 1. The data was collected from 20 volun-
teers (22–49 years old) in four data gathering ses-
sions. Each participant was asked to perform ADLs
and 12 different types of falls as proposed by Noury
(Noury et al., 2008). During all activities volunteers
wore a Silmee device (Suzuki et al., 2013) placed just
below their clavicle. All falls were completed on a
crash mat in a controlled environment. We gathered
641 ADLs and 168 falls. We are interested in discrim-
inating between falls and ADLs above 1.6g accelera-
tion. This threshold of 1.6g was chosen to eliminate
Figure 2: Jitter plot of the peak magnitude of the extracted
ADLs and Falls from Cohort 1 (jittering on the x-axis). A
fixed peak magnitude threshold cannot separate ADL from
Falls perfectly.
Figure 3: Jitter plot of the peak magnitude of the extracted
ADL and Falls from Cohort 2 (jittering on the x-axis).
sedentary ADL (Ojetola, 2013) which are very easily
distinguishable from falls (all falls were above 1.6g
in our cohort). Interesting ADLs are those which are
harder to differentiate from accelerometer data as nor-
mal events e.g. sitting down heavily. We have consid-
ered 375 ADLs, that are above the 1.6g threshold, for
training and testing the algorithms (see Figure 2).
Cohort 2. To test the above stated hypothe-
ses we used a fall detection dataset (taken from:
http://eduqtech.unizar.es/en/fall-adl-data/), which
was made publicly available by (Medrano et al.,
2014a). The authors used smartphone devices to
collect accelerometer data from 10 volunteers. Each
volunteer performed 24 falls on a soft mattress. The
ADLs were collected over a period of one week while
the volunteers were carrying the smartphones in their
HEALTHINF 2018 - 11th International Conference on Health Informatics
78

pocket. Only the ADL events with magnitudes above
1.5g were recorded. See Figure 3 for the distribution
of peak magnitudes in the ADL and fall samples.
For a full description of the dataset please refer to
(Medrano et al., 2014a).
Data Preparation. For each activity, an acceler-
ation magnitude vector was computed from the ac-
celeration in the x, y and z directions. The resulting
magnitude vector was interpolated and re-sampled at
a 50ms rate to ensure that any inconsistency in the
sampling rate between sessions was removed. In each
event the peak magnitude was located 500ms before
and after this peak was extracted, resulting in a 1-
second long acceleration magnitude feature vector of
21 samples.
3 METHODS
To allow a comparison between within-cohort and
between-cohort fall detection performance we follow
(Lisowska et al., 2015) in the choice of the machine
learning approaches. We evaluate:
• Four supervised fall detection methods: Support
Vector Machine (SVM), K-Nearest Neighbours
(K-NN), Random Forest (RF) and Convolutional
Neural Network (CNN).
• Three novelty based fall detection techniques:
Replicatory Neural Network (ReN), 1-class SVM
(1SVM) and 1-class Nearest Neighbours (1NN).
• Six novelty hybrid techniques: PCA + ReN, PCA
+ 1SVM, PCA + 1NN, CNN + ReN, CNN +
1SVM, CNN + 1SVM.
All methods were implemented in Python. With
the exception of the CNN and ReN methods, we used
the scikit-learn package (Pedregosa et al., 2011) im-
plementations. The CNN and ReN methods were im-
plemented using the Theano library (Bergstra et al.,
2010).
The CNN was built from two pairs of convolu-
tional and pooling layers. The first convolutional
layer has 30 nodes and the second has 15 nodes. The
filter size is 4 for both and the pooling size is 2. The
fully connected layer has 6 nodes and it is followed
by a softmax classification layer, or a novelty detec-
tor in the CNN based novelty hybrid implementation
(see Figure 1). The CNN uses L2 regularisation with
a penalty of 0.002.
The replicatory neural network has 3 hidden lay-
ers with 70, 40 and 70 nodes respectively. The num-
ber of input features is equivalent to the number of
output nodes. Each second of extracted data has 21
features. The feature vectors after the PCA transfor-
mation are shorter and are equal to the number of prin-
cipal components with an additional feature, which
is the peak magnitude of the extracted activity. All
neural network based approaches use ReLU activa-
tion functions.
The number of ADLs and fall examples is not bal-
anced, therefore we evaluated all algorithms in terms
of the area under the receiver operating characteristic
(ROC) curve (AUC), rather than reporting the accu-
racy, which is affected by the imbalance.
Table 1: A table highlighting the differences between the
datasets used for training and/or testing of the algorithms.
Cohort 1 dataset Cohort 2 dataset
Device Silmee Samsung Galaxy
Mini
Device
location
Top part of the
chest, just below
the clavicle
In a pocket
Falls 12 types of fall,
each repeated
once by each
volunteer
8 types of fall,
repeated three
times by each
volunteer
ADLs Events above
1.6g recorded
in experimental
conditions during
a 45 minute
session
Events above
1.5g recorded
in real life con-
ditions over a
period of at least
one week
4 EXPERIMENTS
Experiment A. To address Hypothesis 1 we trained
the algorithms on the Cohort 1 dataset, but tested on
the Cohort 2 dataset. The datasets are sufficiently dif-
ferent to represent two uncorrelated cohorts (see Ta-
ble 1). The results of the experiment are presented
in column A of table 2. The highest AUC scores
are achieved by the CNN and the SVM, but these are
lower than the AUC scores obtained when these meth-
ods are trained and tested on the same cohort (see col-
umn B of table 2). For all supervised algorithms the
Cross-cohort Evaluation of Machine Learning Approaches to Fall Detection from Accelerometer Data
79
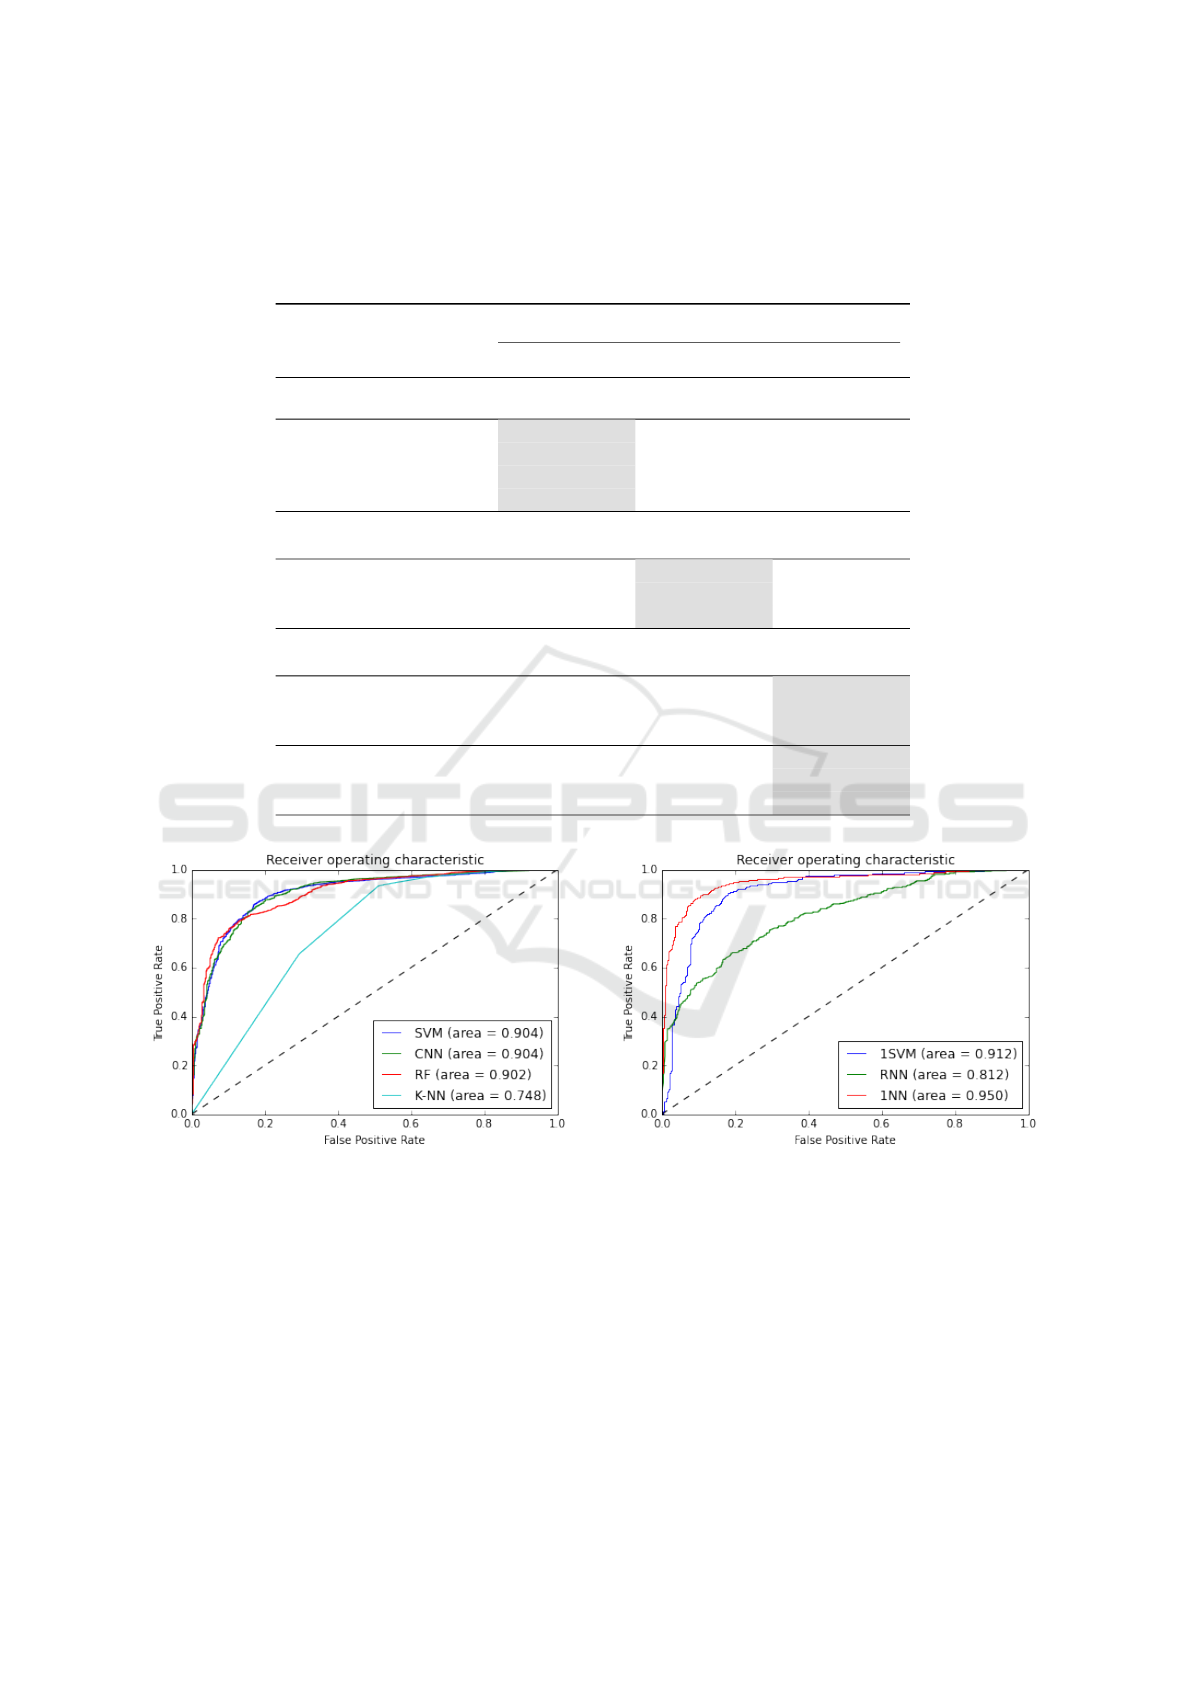
Table 2: Results from three experiments: A - Fully trained on Cohort 1, tested on Cohort 2 data, B - Fully trained and tested
on Cohort 2 data, C - Features discovered on Cohort 1, trained and tested on Cohort 2 data. The best AUC score for each
experiment is highlighted in bold. The PCA based hybrid methods used 13 principal components. To judge suitability for
real world deployment, the results obtained for the supervised methods in experiment A should be compared with the results
obtained by the novelty detector in experiment B and with the novelty hybrid methods in experiment C (highlighted in grey).
Method AUC
A B C
Supervised Methods
CNN 0.904 0.964 —
SVM 0.904 0.968 —
RF 0.902 0.960 —
K-NN 0.748 0.790 —
Novelty detectors
ReN 0.758 0.812 —
1SVM 0.592 0.912 —
1NN 0.756 0.950 —
Novelty Hybrid
PCA + ReN 0.686 0.655 0.713
PCA + 1SVM 0.439 0.841 0.842
PCA + 1NN 0.745 0.950 0.961
CNN + ReN 0.845 0.915 0.871
CNN + 1SVM 0.632 0.918 0.883
CNN + 1NN 0.582 0.801 0.835
Figure 4: ROC for supervised methods tested on a different
cohort (Experiment A).
cross-cohort evaluation yields worse results than the
within-cohort evaluation (Lisowska et al., 2015).
For completeness, results obtained by novelty
based fall detection methods are also presented in
Table 2. However, novelty detectors may be trained
on ADLs from the fall detection device user (person-
alisation), which would eliminate the requirement
for training of the detector on a different population
cohort before deployment.
Figure 5: ROC curves for the novelty detectors (Experiment
B).
Experiment B. The results from experiment A
show support to Hypothesis 1. To produce a baseline,
we trained and tested the algorithms on the Cohort 2
dataset. We used 70% of data for training and 30%
for testing. The results are presented in Table 2 col-
umn B. The best performing supervised fall detectors
(SVM, CNN) have AUC above 0.96 when trained and
tested on the Cohort 2 dataset, and AUC just above
0.90 when trained on a population cohort from the
Cohort 1 dataset. The clear decrease in AUC scores
HEALTHINF 2018 - 11th International Conference on Health Informatics
80
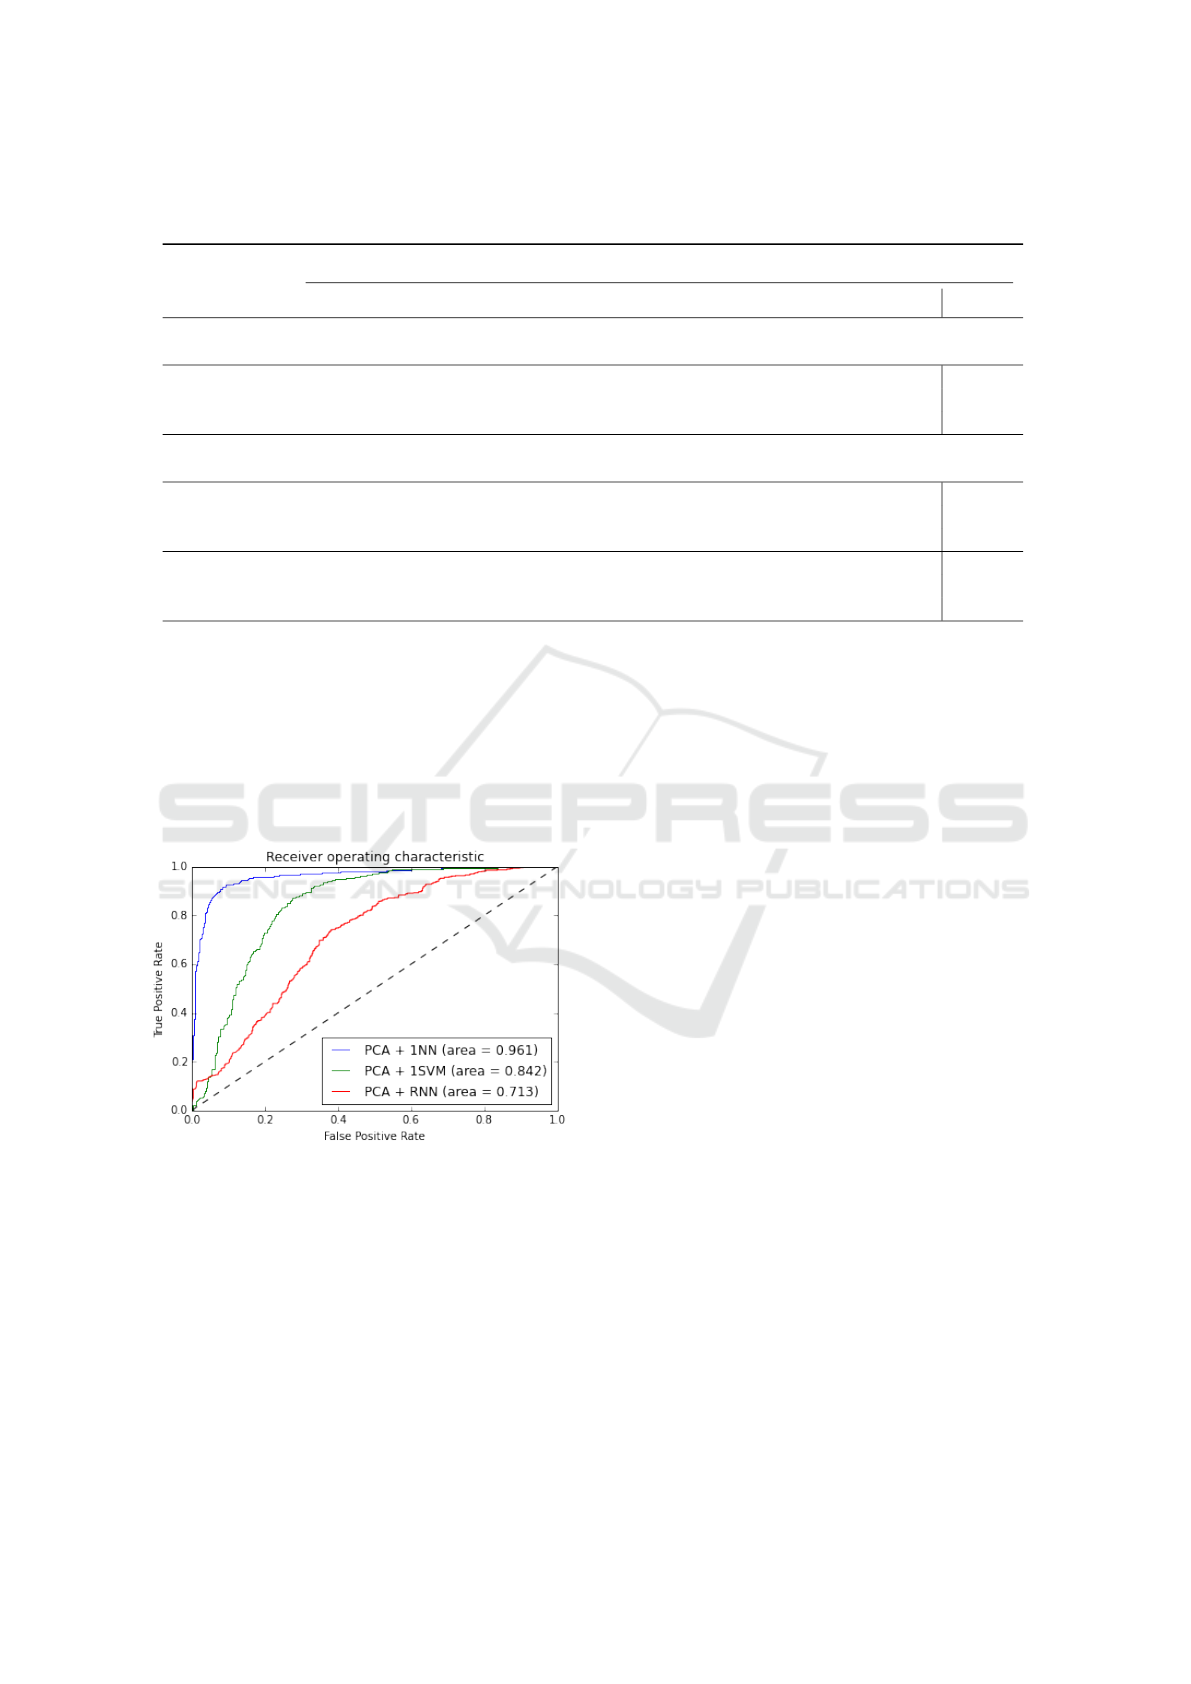
Table 3: Results from experiment D - Personalised training. Here novelty hybrids are using feature discovered on tmvs data
(as in experiment C). PCA based hybrid use 13 principal components.
Method AUC
P 1 P 2 P 3 P 4 P 5 P 6 P 7 P 8 P 9 P 10 MEAN
Novelty Detector
ReN 0.930 0.986 0.938 0.937 0.915 0.924 0.979 0.958 0.972 0.938 0.948
1SVM 0.904 0.687 0.796 0.857 0.780 0.329 0.665 0.856 0.880 0.689 0.744
1NN 0.918 0.986 0.921 0.924 0.933 0.940 0.984 0.967 0.942 0.948 0.946
Novelty Hybrid
PCA + ReN 0.918 0.965 0.917 0.948 0.935 0.918 0.973 0.965 0.971 0.925 0.945
PCA + 1SVM 0.870 0.419 0.647 0.799 0.630 0.267 0.528 0.790 0.639 0.543 0.613
PCA + 1NN 0.910 0.967 0.887 0.938 0.947 0.940 0.984 0.968 0.934 0.957 0.943
CNN + ReN 0.700 0.773 0.720 0.836 0.719 0.793 0.909 0.726 0.746 0.638 0.756
CNN + 1SVM 0.921 0.744 0.526 0.855 0.758 0.671 0.861 0.763 0.639 0.697 0.744
CNN + 1NN 0.845 0.726 0.551 0.845 0.793 0.770 0.819 0.711 0.637 0.588 0.729
when tested on a distinctly different population aids
Hypothesis 1.
The best performing novelty based fall detection
method applied to the Cohort 2 dataset is 1NN. It
achieves an AUC of 0.95, which is higher than the
best AUC score of the supervised methods evaluated
on a cross-cohort basis. This result gives some
support to Hypothesis 2.
Figure 6: ROC curves for the PCA based hybrids (Experi-
ment C).
Experiment C. In this test we explore whether
a novelty hybrid approach may offer better perfor-
mance than novelty detectors. The hybrids used the
Cohort 1 dataset for feature selection and then they
were applied to the Cohort 2 dataset, as in experiment
A. The PCA based hybrid approach yields promising
results with PCA + 1NN achieving an AUC of 0.961,
which is higher than any of the AUC scores obtained
by novelty detectors. Nevertheless, CNN based
hybrids do not show the expected improvements
in performance. A possible explanation is that the
CNN has discovered features which are specific to
the Cohort 1 dataset population and which might not
be appropriate when applied to different population
cohorts.
Experiment D. To address Hypothesis 3 we used
the Cohort 2 dataset to train personalised novelty de-
tectors. The fall detectors were trained and tested
only on the activities from one person at a time. The
results obtained for each person are reported in Ta-
ble 3. Interestingly, the best performing personalised
novelty detector is the ReN, which yielded the least
promising results when evaluated on the whole pop-
ulation cohort. 1SVM performs the worst; its perfor-
mance decreases when it is fed with PCA-extracted
features and does not improve when fed with features
discovered by the CNN. The low performance might
be caused by an insufficient number of training ex-
amples for this method. CNN based hybrids perform
worse than novelty detectors. Even though PCA +
ReN and PCA + 1NN yield better results on some
cases than simple ReN or 1NN, on average they do
not outperform novelty detectors. Thus Hypothesis 3
cannot be supported.
5 CONCLUSION
We have reported four experiments evaluating the per-
formance of the supervised, novelty based and hybrid
methods on separate population cohorts. We found
that the performance of the supervised methods de-
creased when they were tested on data from a popula-
Cross-cohort Evaluation of Machine Learning Approaches to Fall Detection from Accelerometer Data
81

tion distinctly different from the one they were trained
on. The decrease in the performance was not substan-
tial, which may suggest that supervised fall detection
methods such as a CNN or SVM generalise well, or
that the population cohorts are not particularly differ-
ent.
ReN and 1NN personalised novelty detectors per-
form better than supervised methods applied across
population cohorts, but nevertheless more data per in-
dividual is needed to be able to evaluate whether this
could be true for 1SVM. It is known that some clas-
sifiers need a very large amount of training data to
achieve good performance (for example a CNN). The
performance ranking of the algorithms may change
when the algorithms are trained on a much bigger co-
hort.
We have not found sufficient evidence to prove
that novelty hybrid methods outperform novelty de-
tectors. Further experiments with varied amounts
of features extracted in the pre-training phase and a
larger amount of data are required.
Another interesting future avenue to explore
would be using domain adaptation as proposed in
(Ganin et al., 2016). The labelled fall and ADL data
from young participants could be used for training
alongside unlabelled data from target population, so
that the neural network could learn features that are
indiscriminative with respect to the shift between the
two population cohorts but discriminative between
falls and ADLs.
REFERENCES
Albert, M. V., Kording, K., Herrmann, M., and Jayaraman,
A. (2012). Fall classification by machine learning us-
ing mobile phones. PloS one, 7(5):e36556.
Bergstra, J., Breuleux, O., Bastien, F., Lamblin, P., Pascanu,
R., Desjardins, G., Turian, J., Warde-Farley, D., and
Bengio, Y. (2010). Theano: A cpu and gpu math com-
piler in python. In Proc. 9th Python in Science Conf,
pages 1–7.
Bourke, A., Obrien, J., and Lyons, G. (2007). Evaluation of
a threshold-based tri-axial accelerometer fall detection
algorithm. Gait & posture, 26(2):194–199.
Chen, J., Kwong, K., Chang, D., Luk, J., and Bajcsy, R.
(2006). Wearable sensors for reliable fall detection. In
Engineering in Medicine and Biology Society, 2005.
IEEE-EMBS 2005. 27th Annual International Confer-
ence of the, pages 3551–3554. IEEE.
Ganin, Y., Ustinova, E., Ajakan, H., Germain, P.,
Larochelle, H., Laviolette, F., Marchand, M., and
Lempitsky, V. (2016). Domain-adversarial training of
neural networks. Journal of Machine Learning Re-
search, 17(59):1–35.
Igual, R., Medrano, C., and Plaza, I. (2013). Challenges,
issues and trends in fall detection systems. Biomed.
Eng. Online, 12(66):1–66.
Kangas, M., Konttila, A., Lindgren, P., Winblad, I., and
J
¨
ams
¨
a, T. (2008). Comparison of low-complexity fall
detection algorithms for body attached accelerome-
ters. Gait & posture, 28(2):285–291.
Lee, R. Y. and Carlisle, A. J. (2011). Detection of falls us-
ing accelerometers and mobile phone technology. Age
and ageing, page afr050.
Lisowska, A., Wheeler, G., Ceballos Inza, V., and Poole,
I. (2015). An evaluation of supervised, novelty-based
and hybrid approaches to fall detection using silmee
accelerometer data. In Proceedings of the IEEE Inter-
national Conference on Computer Vision Workshops,
pages 10–16.
Lutze, R. and Waldh
¨
or, K. (2016). Smartwatch based
tumble recognitiona data mining model comparision
study. In e-Health Networking, Applications and
Services (Healthcom), 2016 IEEE 18th International
Conference on, pages 1–6. IEEE.
Medrano, C., Igual, R., Plaza, I., and Castro, M. (2014a).
Detecting falls as novelties in acceleration patterns ac-
quired with smartphones. PloS one, 9.
Medrano, C., Igual, R., Plaza, I., Castro, M., and Fardoun,
H. M. (2014b). Personalizable smartphone application
for detecting falls. In Biomedical and Health Infor-
matics (BHI), 2014 IEEE-EMBS International Con-
ference on, pages 169–172. IEEE.
Noury, N., Rumeau, P., Bourke, A.,
´
OLaighin, G., and
Lundy, J. (2008). A proposal for the classification and
evaluation of fall detectors. Irbm, 29(6):340–349.
Ojetola, O. (2013). Detection of Human Fal ls using Wear-
able Sensors. PhD thesis, Coventry University.
Pedregosa, F., Varoquaux, G., Gramfort, A., Michel, V.,
Thirion, B., Grisel, O., Blondel, M., Prettenhofer, P.,
Weiss, R., Dubourg, V., et al. (2011). Scikit-learn:
Machine learning in python. The Journal of Machine
Learning Research, 12:2825–2830.
Suzuki, T., Tanaka, H., Minami, S., Yamada, H., and Miy-
ata, T. (2013). Wearable wireless vital monitoring
technology for smart health care. In Medical Informa-
tion and Communication Technology (ISMICT), 2013
7th International Symposium on, pages 1–4. IEEE.
Zhang, T., Wang, J., Xu, L., and Liu, P. (2006). Fall de-
tection by wearable sensor and one-class svm algo-
rithm. In Intelligent Computing in Signal Processing
and Pattern Recognition, pages 858–863. Springer.
HEALTHINF 2018 - 11th International Conference on Health Informatics
82
