Photonic Sensing and Characterisation of Multiphase Water Flows
Computational Sensing and Imaging
Sergio L. Carrasco-Ortiz, Eduardo Valero, Maria Morant and Roberto Llorente
Nanophotonics Technology Center, Universitat Politècnica de València, Camino de Vera s/n, Valencia, Spain
Keywords: Computational Sensing, Photonic Sensor, Imaging, CMOS, Multiphase Water Flow, Cavitation, Air Fraction,
Bubble Speed.
Abstract: This paper presents and demonstrates experimentally a photonic sensor based on laser excitation and CMOS
array detection of light interactions in a bubbling water column. Bubbling water columns are multiphase water
flows, which can be produced by cavitation effect in screws and pump-jets, or by water-air mixing in the dam
intakes and spillways in hydroelectric energy generation plants. The proposed optical sensor comprises a
CMOS array with a polymeric tuneable optical lens sampling the area illuminated by a diode laser operating
at 532 nm. By computational imaging, the sensor is able to measure the size, shape and speed of the bubbles
inside the water column and the corresponding bubble concentration. The developed laser-assisted sensor is
demonstrated experimentally in the laboratory with a water column at 0.05 MPa with good results employing
Optical Flow, SIFT and SURF computational methods.
1 INTRODUCTION
Bubble detection and multiphase flow monitoring are
important in terms of efficiency and safety in many
industrial and medical fields. A multiphase flow is
defined as a simultaneous flux of two phases or
components with an explicit interface between them
(Iyer, et al., 2013). A basic example of a two-phase
flow usually comprises a gas and a liquid, being the
most common bubble flows (Bian, et al., 2011).
Bubble flows play an important role in the study of
mechanism in gas/liquid two-phase flows where the
bubbles behaviour are a key element when
monitoring water columns in industrial applications
(Bian, et al., 2011). Some application examples of
two-phase flows are air bubbles found in
extracorporeal blood circuits of haemodialysis (Li, et
al., 2015) or in industrial bubble column reactors
(Iyer, et al., 2013). In the first example, in medical
applications, if a certain amount of air is pumped into
the patient, it may cause life-threatening coagulation
and haematomas (Li, et al., 2015). In the second
example, it is extremely important to know the
properties of the bubbles including its size, shape and
velocity for the design and function monitoring of
industrial reactors (Iyer, et al., 2013). In both cases,
image processing of bubbles has been proposed to
calculate the number of bubbles and cumulative
volume (Jonsson, 2014) (Muddle, et al., 1994).
A large number of bubbles in a flow can indicate
the presence of cavitation in hydraulic applications.
Cavitation is due to the pressure decrease generated
by an excessive blade angular velocity, which in turn
generates bubbles that explode in the blade surface
(Brennen, 2005). Cavitation spaces are usually
involved in highly turbulent flows as it happens in
vortex emissions produced in the torch effect
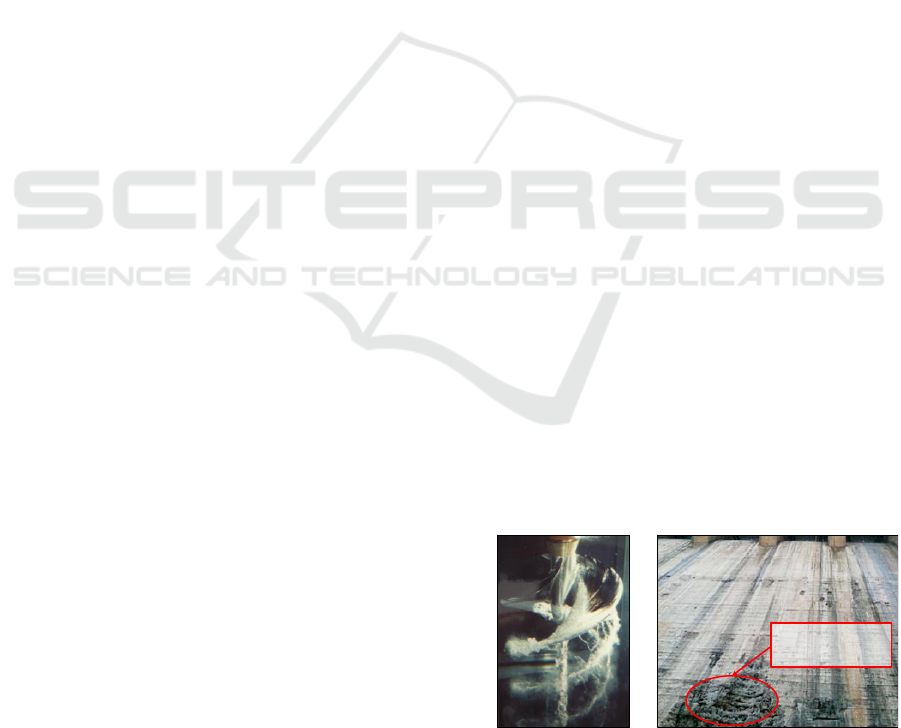
represented in Figure 1(a). Bubble explosion causes
erosion on the surface of dam spillways, reducing its
useful life (ETH Zurich, Laboratory of Hydraulics,
Hydrology and Glaciology, s.f.) as it is depicted in
Figure 1(b).
Figure 1: (a) Torch effect in a screw (b) Cavitation damage
on spillway profile of Nagarjunasagar Dam.
(a) (b)
Cavitation
damages
Carrasco-Ortiz, S., Valero, E., Morant, M. and Llorente, R.
Photonic Sensing and Characterisation of Multiphase Water Flows - Computational Sensing and Imaging.
DOI: 10.5220/0006553100550062
In Proceedings of the 6th International Conference on Photonics, Optics and Laser Technology (PHOTOPTICS 2018), pages 55-62
ISBN: 978-989-758-286-8
Copyright © 2018 by SCITEPRESS – Science and Technology Publications, Lda. All rights reserved
55
Furthermore, in devices such as pumps, hydraulic
turbines, pump-jets and screws in the naval area
(installed on ships and submarines), cavitation could
cause noise, vibration, permanent screw damage and
propulsion efficiency losses (Buckland, et al., 2013)
(Shan-Yong, et al., 2013). In this paper, we focus on
the detection (sensing) and characterization of
bubbles in a multiphase flow water column. A
potentially high bubble-density is considered in order
to address scenarios including cavitation in marine
screws, and water-air mix in hydroelectric energy
generation structures.
Due to the compressibility of bubble flows, air is
capable of absorbing, until a certain point, the impact
of bubble shocks in cavitation processes (Peterka,
1983). However, if the bubble flow is not monitored
properly it can lead to the above mentioned damages
in the structure as represented in the example depicted
in Figure 1(b). The aeration of the flow changes its
dissipative behaviour –as provides less friction with
the contours and increased vorticity– (Chanson,
1994), which converts the concentration of air in a
variable of crucial interest. The level of bubble
concentration modifies the macroscopic properties of
the flow, increasing its draft and decreasing its
velocity and gives rise to different momentum
distributions relative to those of the exclusively liquid
flow. In addition, significant differences have been
found in the behaviour of the turbulence due to the
effect of the dispersed phase (air in this case) on the
carrier phase (water).
The most common solution to cavitation in
hydraulic structures is the design of hydro-dynamic
profiles that avoid big pressure gradients (Edel, 1977)
(Volkart & Rutschmann, 1984). However, as it is not
always possible and cavitation may occur at relatively
slow speeds, other sort of solutions are necessary. The
employment of coating materials have been also
proposed in the past to improve the resistant
properties (Cheng, et al., 1990). Accoustic detection
of the cavitation bubbles implosion has been also
evaluated in the literature (Duraiswami, et al., 1998),
where incipient cavitation is heard as intermittent
crackling while severe cavitation becomes a steady
hiss increasing in volume (Chudina, 2003) (Karassik
& McGuire, 1997). However, due to the chaotic rise
of the bubbles along the flow in both number and size,
it is not possible to predict the emitted noise to get a
full characterization (Chudina, 2003). Other
techniques for characterizing bubbles are based on
energy measurement –employing charge-coupled
devices (CCD) or hydrophones (Brujan, et al., 2002)–
or electric impedance measurement (O'hern, et al.,
1995), or using probes to measure if there is air or
water in contact with the probe (Chanson, 1997). All
these methods are invasive and they will modify the
hydrodynamic multiphase flow properties, such as
bubble shape and flow. To avoid this, we propose a
photonic sensor based on a camera and a diode laser
detection that does not interfere with the flow. The
diode laser is employed to excite the bubbling water
column in order to increase the contrast of a high-
density number of bubbles in the flow. This non-
invasive method enables monitoring the flow
behaviour taking high-speed images of the flow. With
the proposed post-processing algorithms, from these
images we can calculate the bubble speed and extract
the size (bubble concentration) and shape of the
bubbles in terms of equivalent area and diameter,
major half-axis, minor half-axis and perimeter.
2 LASER-CMOS SENSOR
ARCHITECTURE
2.1 Photonic Subsystems
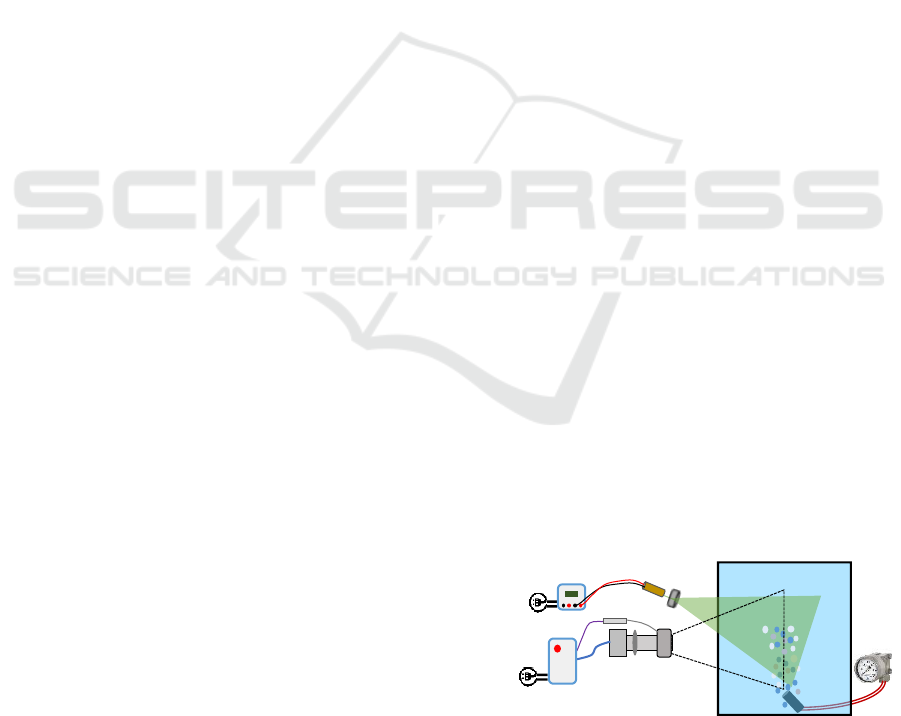
Figure 2 represents the conceptual scheme of the
laboratory setup including the block diagram of the
main components comprising the proposed photonic
sensor for the detection and characterization of
bubbles in a multiphase flow. At the laboratory the
sensor is applied to a bubbly water column generated
-inside a transparent tank- with a cylindrical diffusor
with main characteristics of diameter
diff
= 12.10
mm and length L
diff
= 26.50 mm. This cylindrical
diffusor is connected with a flexible plastic tube (
in
= 5.10 mm,
out
= 8.10 mm) to a void pump
configured with 0.05 MPa.
The laser-assisted sensor is based on a camera that
comprises a complementary metal-oxide-
semiconductor (CMOS) sensor, a fixed lens and a
tunable lens controlled remotely with a driver. The
illumination of the bubbles is achieved with a laser
diode beam dispersed by a negative lens.
Figure 2: Conceptual scheme of the laser-assisted CMOS
sensor developed at the laboratory.
Wiring: Power-supply
USB 2.0 Ethernet (PoE)
Processing
algorithms
Negative
lens
Laser
Sensing area
CMOS
Computer
Power source
Driver
Void
pump
Diffusor
Water
tank
Fixed lens +
tunable lens
PHOTOPTICS 2018 - 6th International Conference on Photonics, Optics and Laser Technology
56
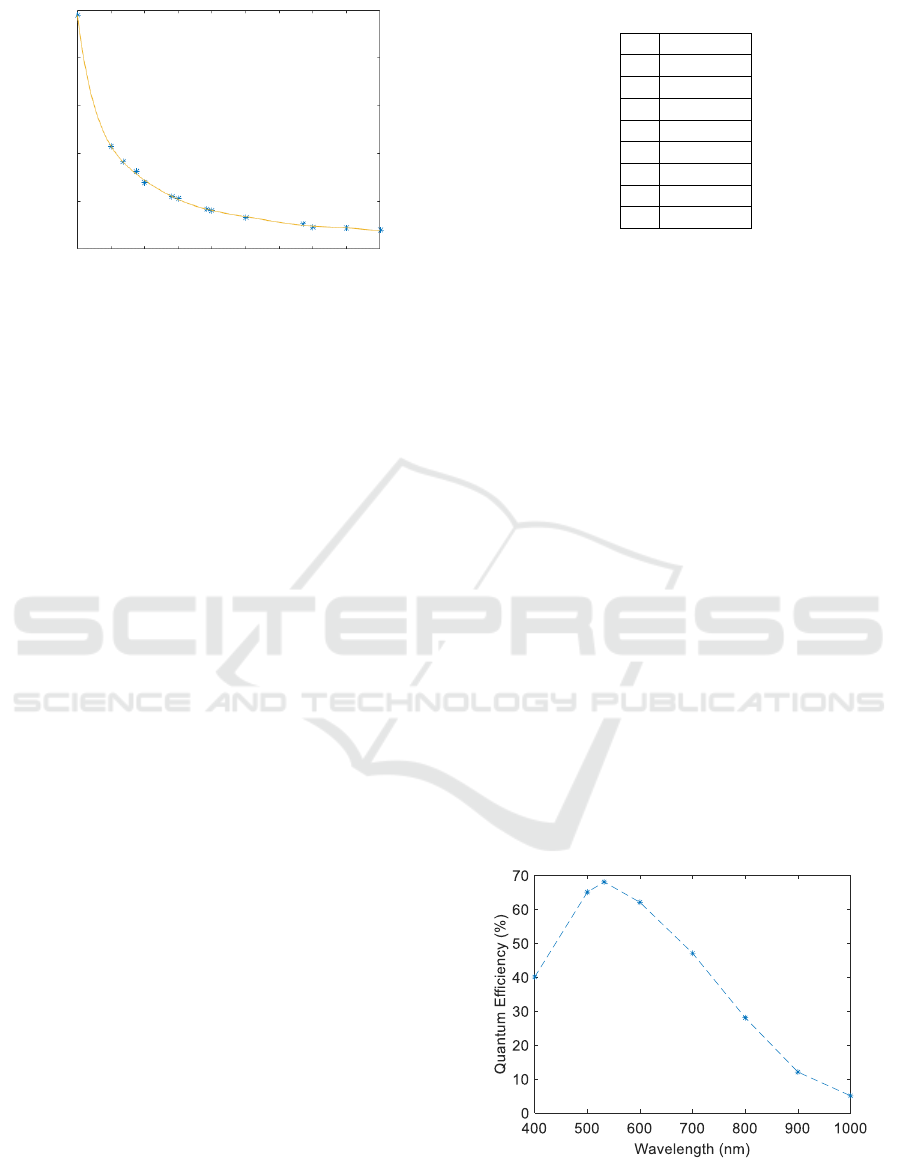
Figure 3: Tunable lens and fixed lens system’s calibration
curve for the equivalence of mm/px vs. dioptres.
The main functions of each opto-electronic
component depicted in Figure 2 are:
▪ Monochrome CMOS sensor, responsible for
the acquisition of data: A camera with CMOS
sensor was selected because it is the fastest and
safest way to capture optical information in
form of images. The sensor is configured
remotely in terms of resolution, exposure time,
gain, frames per second (fps) and recording
time. In these experiments, we used a sensor
with a maximum resolution of 1280×1024
pixels (px).
▪ Fixed lens with a focal length of f = 25 mm,
responsible for focusing the image together
with a tunable lens.
▪ Tunable lens, responsible for adjusting the lens
system: At the fixed lens outer face a tunable
lens is used. This lens is capable of varying its
dioptre number between −4 and 5 dpt to focus
in different depth planes.
▪ The lens system is controlled by algorithms that
set the tunable lens’ dpt. This is necessary for
the calculation of real lengths. The algorithms
calculate the equivalence between the image
size in terms of px and the real length in mm.
Figure 3 shows the calibration curve of the lens
system in terms of mm/px vs. dioptres. In this
work the refractive surface between the two
media (air and water) is plane, and by the
Snell’s law, it is obtained an increase factor m
= 1; meaning that there is no sizing increase due
to the refraction. Applying in Figure 3 a
polynomial adjustment of 8
th
degree, the
equivalence is given by the equation (1) being
their coefficients those written in Table 1:
(1)
Table 1: Equation (1) coefficients.
C
0
0.0405
C
1
-8.007e-3
C
2
2.618e-3
C
3
-1.098e-3
C
4
-7.327e-5
C
5
1.218e-4
C
6
2.537e-6
C
7
-8.161e-6
C
8
9.07e-7
The equivalence defined in equation (1) is
included in the processing algorithms to
calculate the equivalence between px and
millimetres for each measurement. Without
this calibration, we would be unable to
transform the pixels obtained in the post-
processing step into millimetres.
▪ The laser diode, responsible for illuminating
the bubbles and increase the contrast and
shadowing of the borders. A tunable output
power laser with up to 80 mW working at a
wavelength of λ = 532 nm is used. The
concrete wavelength was selected to match the
quantum efficiency of the CMOS sensor.
Figure 4 shows the efficiency of the CMOS
sensor used for different wavelengths. The
quantic efficiency of the CMOS sensor is over
68% for a λ = 532 nm. The geometrical laser
ray has a roundness Ο > 90 %, divergence
θ > 1.2 mrad and initial diameter
0
= 1.5 mm.
The output power of the laser can be configured
depending on the voltage/intensity provided
ranging from 2.3 to 2.9 V and up to 350 mA. In
these experiments, we waited ten seconds after
switching on the laser in order to ensure the
output power.
Figure 4: CMOS quantum efficiency.
Diopters (m
-1
)
Equivalence
(mm/px)
-4 -3
-2 -1 0
1
2
3 4 5
0
0.05
0.1
0.15
0.2
0.25
Photonic Sensing and Characterisation of Multiphase Water Flows - Computational Sensing and Imaging
57
▪ Negative (divergent) lens, responsible for
enlarging the laser beam. In order to avoid the
appearance of sparkles in the image produced
by the CMOS sensor it is necessary to diverge
the laser beam. To achieve it, a negative
NBK-7 glass lens with plane-concave shape is
used with a focal distance f = –75 mm, diameter
of = 50.8 mm.
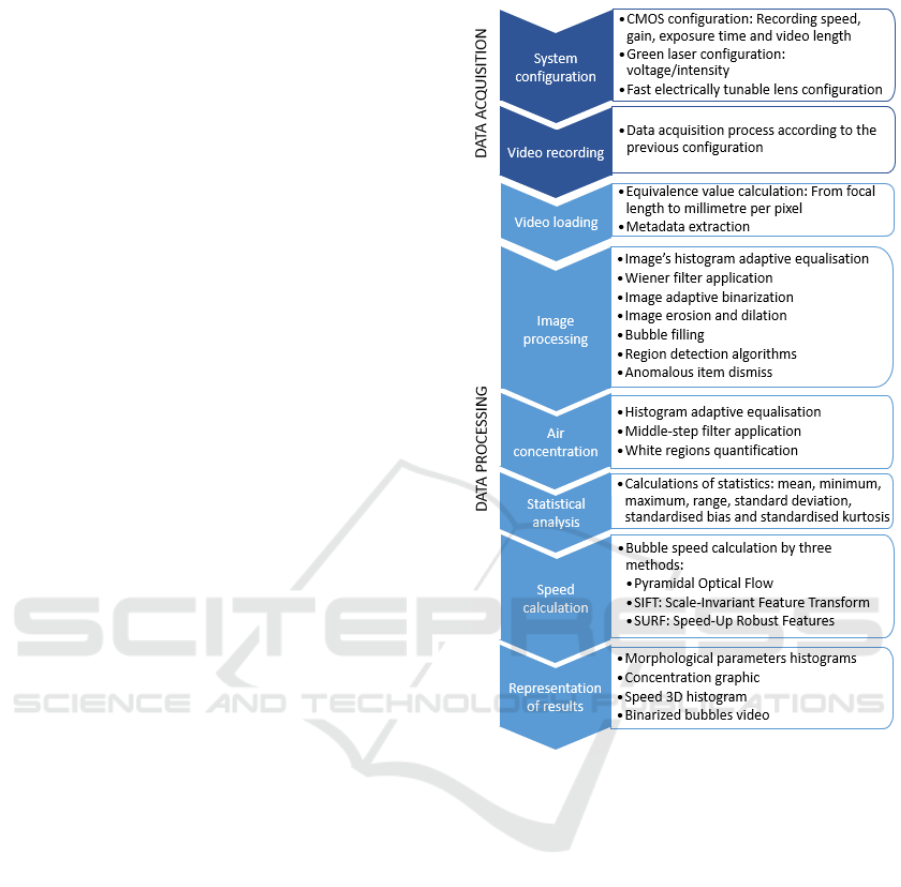
2.2 Data Acquisition and Digital Signal
Processing
Figure 5 depicts the main steps followed for the data
acquisition and processing of the images to full
characterize the bubble flow.. As a first step, the
sensor is configured remotely via C commands
including the CMOS configuration, the output power
of the laser diode and the lens focus. The CMOS
sensor is configured in:
▪ Gain correction, employed to homogenise the
CMOS sensibility. The dead pixel correction
allows the software to fix the turned off pixels.
This correction consists in storing the average
value of the adjacent pixels in the black pixel.
Furthermore, it is useful to post-process the
images as improves the detection area, but at
the same time, may cause errors in the image’s
adaptive histogram equalisation.
▪ Exposure time, also known as shutter speed,
adjusts the amount of incident light in order to
avoid blurred images.
▪ Recording speed: Readout speed tells how
many frames-per-second the camera can
capture. In these experiments, after capturing
the images at a speed of 100 fps (i.e. each frame
is captured at 1/100 seconds or 10 ms), the
speed is immediately set to 1110 fps (i.e.
1/1110 or 0.9 ms) reducing the region of
interest (RoI). This greatly improves the result
of bubble speed estimation.
Once the image sequence is recorded, adjusting
the focus system, the equivalence value is obtained
with the mm/px conversion depicted previously in
Figure 3. In the image-processing step, the
recognition of any object is carried out by the
discrimination of what is seen regarding the ideal
concept of the object to be identified. To achieve that,
it is necessary to transform the images acquired in
greyscale –pixels whose values go from 0 to 1, being
0 a black pixel and being 1 a white pixel– into images
in which there are just black and white pixels. This
process is known as binarization as only 0 or 1 values
remain in the image.
Figure 5: Data acquisition and processing diagram.
To minimize the interclass variance between the
white and black pixels, it is necessary to have some
ambient lighting. An accurate conversion from a grey
image to a binarized image is essential for the
application of region detection algorithms. The laser
diode illumination provided by our optical sensor
increases the contrast of the bubbles in the flow and
enhances the binarization process.
In order to carry out the identification of
circular/elliptical forms some extra filtering and
processing should be implemented to the images, as
depicted in Figure 6.
PHOTOPTICS 2018 - 6th International Conference on Photonics, Optics and Laser Technology
58
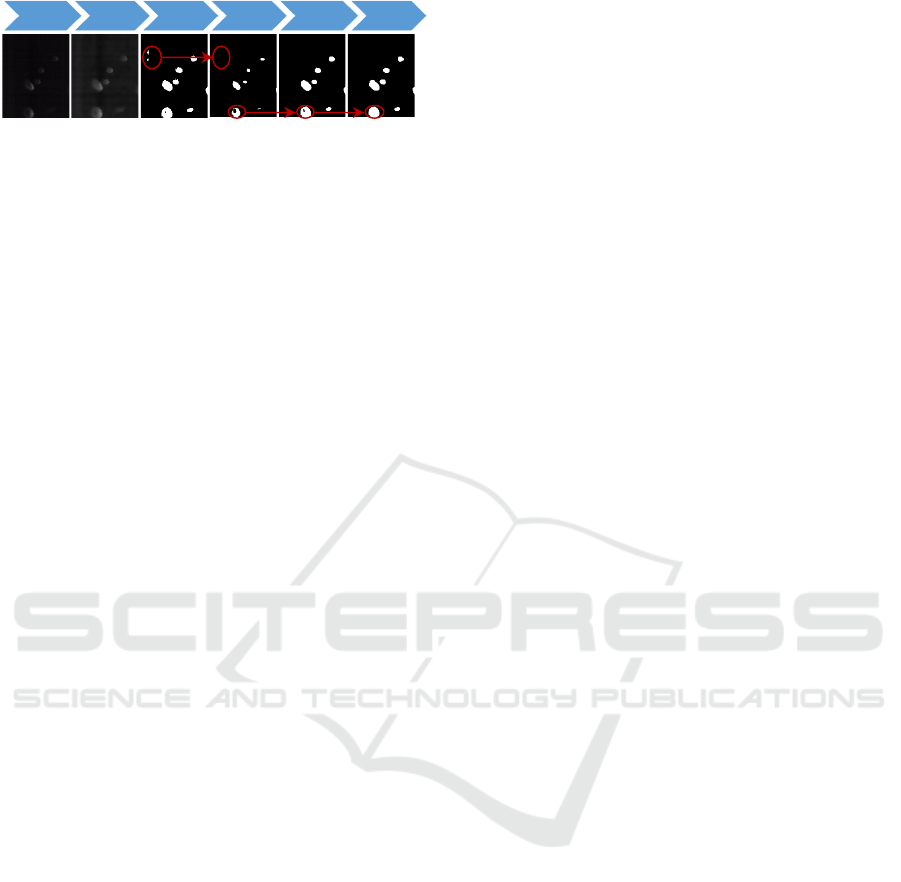
Figure 6: Evolution of an image captured from the water
column after digital signal processing.
The filters and processes applied to the images are
integrated in C/Fortran language. Figure 6 shows the
different steps applied to the images captured from
the water column including:
▪ Wiener filter (Bankman, 2008): provides a
statistical computation from a degraded image.
This filter is designed considering that the
image and its noise are random processes.
▪ Image erosion: This function erodes the binary
image applying a structuring element object in
order to erase the remaining noise after the
Wiener filter.
▪ Image dilation: Due to the previous image
erosion, in some cases it is necessary to recover
lost white pixels as it can be observed in Figure
6. In order to do so, a dilatation of the image is
implemented employing the same structuring
element object applied previously in the
erosion step.
▪ Bubble filling: In order to be able to employ
properly the region detection algorithms, we
explore the binary image as a matrix composed
by ones and zeros. The filling algorithms locate
those 0 pixels in the matrix surrounded by ones
and replaces the 0 within by 1, filling the
bubble contour.
▪ Anomalous item dismiss: In the sensing area,
two or more bubble may appear too close each
other, providing mistakes in the statistical
analysis of the bubble shape. To avoid this, data
with 1.5 times higher the morphological bubble
parameters typical deviation, was debugged
from the analysis.
After the statistical analysis of the detected
bubbles, the bubbles’ speed is calculated. In this
topic, we performed an exhaustive state-of-the-art
study of the methods available for the calculation of
the velocity profile of moving objects. In particular,
in these experiments we compare three evaluation
methods:
• Optical Flow, based on the distribution of
apparent velocities of brightness movement
patterns. Pyramidal optical flow arises from the
relative movement of objects and the observer,
so it does not take into account the movement
of the observer (Horn & Schunck, 1981).
• Scale-Invariant Feature Transform (SIFT)
(Lowe, 2004), which computing steps are
scale-space extrema detection, key-point
localization, orientation assignment and key-
point descriptor. This method identifies key-
points in a set of images in order to compare
later every new image with an older one to find
matching features based on the Euclidean
distance of their feature vectors.
• Speed-Up Robust Features (SURF) (Bay, et al.,
2008): This method searches for patterns in the
recognized points in discrete images classified
in three types, i.e. points of interest, descriptors
and markers.
Once the bubbles’ speed is calculated, the
processing algorithms represent the results in form of
histograms and saves the binarized video for further
evaluation.
3 EXPERIMENTAL BUBBLE
CHARACTERIZATION
RESULTS
The validation of the developed processing
algorithms using the proposed sensor is performed at
the laboratory with bubbly water columns within a
transparent tank as depicted previously in Figure 2.
In these experiments, the void pump was set to 0.05
MPa to generate a turbulent bubbly flow with similar
bubble shapes and sizes.
3.1 Air Bubble Concentration
Calculation
The air bubble concentration, i.e. the air in the form
of bubbles in the sensed area, is carried out
integrating all the white regions detected after the
binarization of the image. Figure 7(a) shows the raw
image acquired by the sensor and Figure 7(b) shows
the binarized image result for bubble concentration
calculation. In the processed representation, the
background was coloured in green to enhance the
contrast of the results.
As it can be observed in Figure 7(b), for the
concentration calculation we do not dismiss any
anomalous form, as the clusters of bubbles are also
taken into account for the total concentration in the
area. In these experiments, the bubble concentration
is evaluated in every frame acquired (i.e. 500 frames).
Original
Image
Wiener
Filter
Binary
Image
Erosion Dilation
Bubble
Filling
Photonic Sensing and Characterisation of Multiphase Water Flows - Computational Sensing and Imaging
59
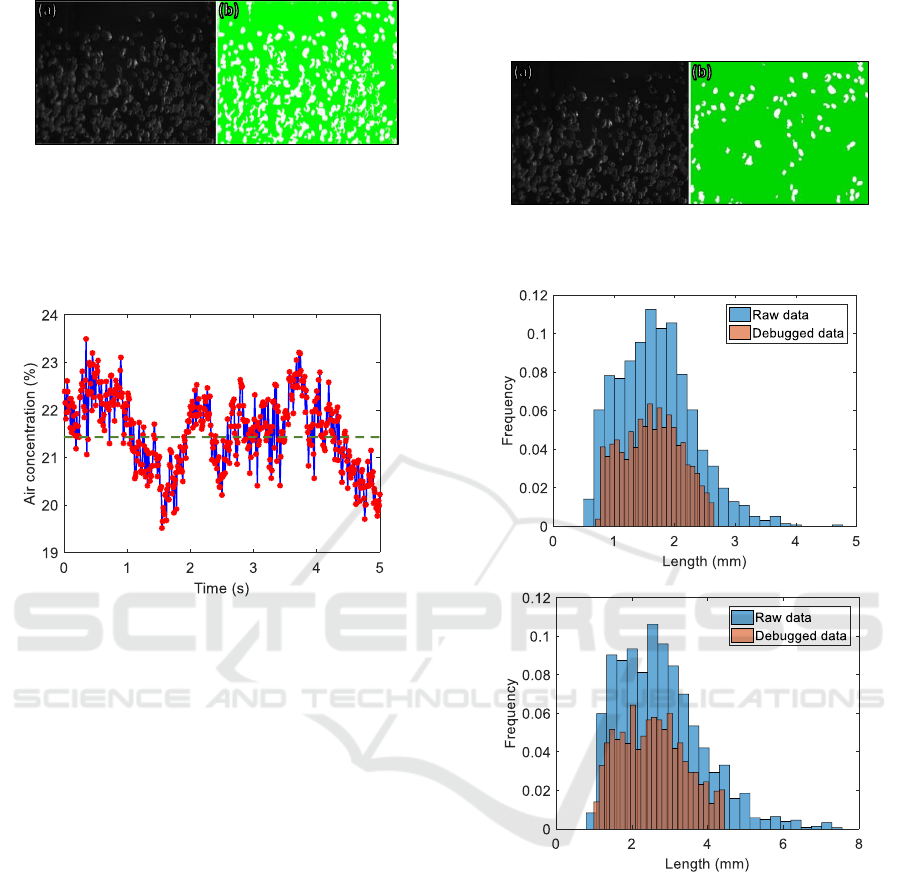
Figure 7: (a) Original frame vs. (b) binarized frame sample
for the calculation of bubble concentration.
Figure 8 shows the experimental mean of bubble
concentration measured in an area of 53.67 cm
2
(81.92 mm × 65.52 mm), during 5 s for 500 images.
Figure 8: Experimental results of bubble concentration
analysis. Horizontal line indicated the mean of bubble
concentration in the detected area of 21.5%.
In this example, the measured bubble
concentration mean is 21.5%, ranging from 19.51%
to 23.49% in a sensed period of 5 seconds. Figure 8
represent in the red marks the bubble concentration
for each frame and in blue lines the slope between
sequential frames.
3.2 Bubbles’ Shape
As it was described in detail in Section 2.2, applying
region detection algorithms to the binarized images,
we were able to quantify shape parameters in the
white regions –filled bubbles–. From the filtered data,
region detection algorithms are able to calculate the
bubbles’ shape parameters, e.g. equivalent area and
both half-axes. The typical deviation (σ) for each
parameter is calculated to debug data what surpass 1.5
times its σ. This debugging is intended to remove the
bubbles that, being too close each other, appeared as
one bigger bubble after binarization. Figure 9
compares the acquired data with the processed image
after binarization, filtering and debugging. The
processing algorithms are applied to the same original
raw data as in Figure 7 so, comparing both figures,
we can observe the debugging of bubble clusters and
anomalous items for the analysis of bubbles’ shapes.
Figure 9: (a) Original frame vs. (b) processed frame sample
for the statistical analysis of bubbles’ shapes.
(a)
(b)
Figure 10: Histogram of the experimental results for
(a) minor and (b) major half-axis estimation (raw vs.
debugged data) expressed as parts per unit.
Figure 10, shows the experimental results for
minor and major half-axis. The mode of the minor
and major half-axis is 1.67 mm and 2.04,
respectively, as observed in Figure 10(a) and (b). It is
clearly observed that the debugging of anomalous
items eliminates clusters of half-axis bigger than
2.63 mm (minor half-axis) and larger than 4.44 mm
(major half-axis).
PHOTOPTICS 2018 - 6th International Conference on Photonics, Optics and Laser Technology
60
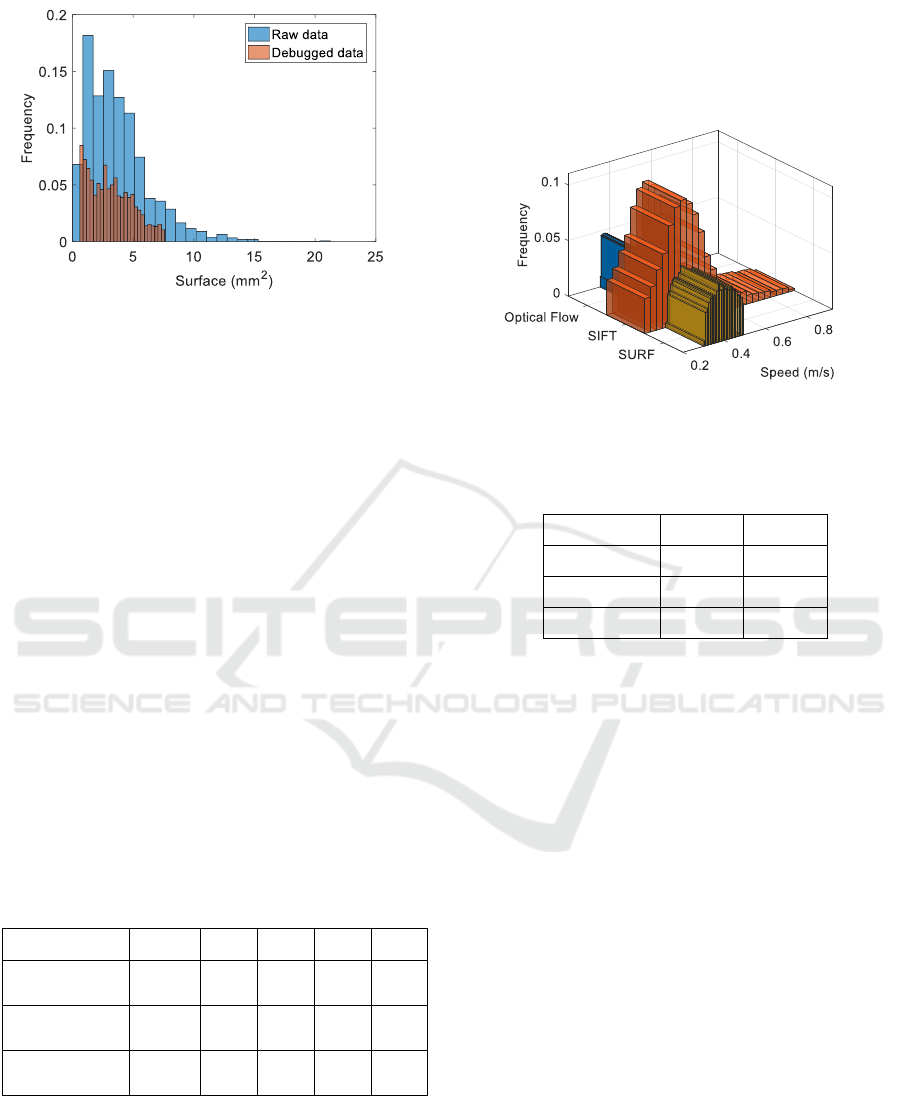
Figure 11: Histogram of the experimental results for
equivalent area estimation (raw vs. debugged data)
expressed as parts per unit.
Figure 11 shows the statistical results for
equivalent area of the bubbles present in the water
column. The mode of the equivalent area is 0.66 mm
2
,
being the maximum equivalent area found by the
algorithms after the debugging of anomalous items
7.55 mm
2
.
By means of statistical analysis of data associated
with bubbles such as mode, mean (), minimum
(Min), maximum (Max) and σ; the measurement of
the fraction of air and bubble shape in critical
multiphase flows in electricity generation facilities is
carried out. Table 2 summarizes the statistical
analysis results obtained with debugged data. From
the analysis of the experimental bubbly water
column, the minor and major half-axis has a mean of
1.64 and 2.57 mm, respectively. The mean equivalent
area of the bubbles is of 3.19 mm
2
with a deviation of
σ = 1.78. This deviation appears due to the non-
uniform porous diameter of the diffusor that generates
bubbles with different sizes as expected in a real-case
hydraulic scenario.
Table 2: Statistical analysis with debugged data.
Parameter
Mode
Min
Max
σ
Minor half-
axis (mm)
1.67
1.64
0.78
2.63
0.47
Major half-
axis (mm)
2.04
2.57
1.10
4.44
0.85
Eq. area
(mm
2
)
0.66
3.19
0.64
7.55
1.78
3.3 Bubbles’ Speed Calculation
Figure 12 represents the 3D histograms of the bubble
speed distribution in bubbly water column calculated
with different estimation methods. The mean and the
mode of speed results represented in Figure 12 are
summarised in Table 3. It can be observed that all the
speed estimation algorithms (Optical Flow, SIFT and
SURF) have a mode of 0.4 m/s. The SIFT estimation
has a mean slightly higher than Optical Flow and
SURF methods but only in a 5%.
Figure 12: Bubbles’ speed estimation calculated with
different algorithms expressed as parts per unit.
Table 3: Bubbles’ speed statistical results for different
estimation methods.
Method
Mean
Mode
Optical Flow
0.40 m/s
0.40 m/s
SIFT
0.42 m/s
0.40 m/s
SURF
0.40 m/s
0.40 m/s
4 CONCLUSIONS
We propose and demonstrate experimentally a
photonic sensor comprising a laser diode and a
CMOS array with tunable optic lens designed to
calculate the size and speed of the bubbles present in
a bubbly water column. With this information, it is
possible to increase efficiency and security in power
generation plants while ensuring a longer duration of
the usefulness not only of the structure but also of the
hydraulic components, such as turbines and screws.
In this work, we presented proposed laser-assisted
CMOS sensor and the associated algorithms to
process the data. The optical sensor comprises a
CMOS sensor that captures high-speed frames of the
bubbles illuminated with a laser diode. A laser diode
emitting in λ = 532 nm is selected to optimize the
CMOS sensing performance.
Experimental data gathered indicates that
bubble’s shape depends on the diffusor porous
dimensions. In these validation examples the minor
and major half-axis of the bubbles are estimated to be
1.64 and 2.57 mm, respectively. The mean equivalent
area of the bubbles is of 3.19 mm
2
with a deviation of
Photonic Sensing and Characterisation of Multiphase Water Flows - Computational Sensing and Imaging
61

σ = 1.78. Such typical deviation appears due to the
diffusor porous diameter is not uniform; generating
bubbles with different sizes emulating a real-case
hydraulic scenario. The experimental results point out
that a correct binarization is necessary to calculate the
air concentration in the sensed area. For this reason,
the laser-assisted sensor increases the contrast and
shape contouring of the bubbles to enhance the
processing efficiency.
ACKNOWLEDGEMENTS
This research work was supported in part by Spain
National Plan MINECO/FEDER UE RTC-2014-
2232-3 HIDRASENSE and TEC2015-70858-C2-1-R
XCORE projects. BIOFRACTIVE project with IIS
La Fe is also acknowledged. M. Morant work was
partly supported by UPV postdoc PAID-10-16
program.
REFERENCES
Bankman, I., 2008. Handbook of Medical Image
Processing and Analysis. s.l.:Academic Press.
Bay, H., Ess, A., Tuylaars, T. & Van Gool, L., 2008. Speed-
Up Robust features (SURF). Computer Vision and
Image Understanding, Junio, 110(3), pp. 346-359.
Bian, Y., Dong, F. & Wang, H., 2011. Reconstruction of
Rising Bubble with Digital Image Processing Method.
Instrumentation and Measurement Technology
Conference (I2MTC).
Brennen, C. E., 2005. Fundamentals of Multiphase Flows.
Pasadena(California): Cambridge University Press.
Brujan, E. A., Keen, G. S., Vogel, A. & Blake, J. R., 2002.
The final stage of the collapse of a cavitation bubble
close to a rigid boundary. Physics of Fluids, 14(1), pp.
85-92.
Buckland, H. C., Masters, I., Orme, J. A. C. & Baker, T.,
2013. Cavitation inception and simulation in blade
element momentum theory for modelling tidal stream
turbine. Part A: Journal of Power and Energy, Junio,
227(4), pp. 479-485.
Chanson, H., 1994. Drag reduction in open channel.
Journal of Hydraulic Research, 32(1), pp. 87-101.
Chanson, H., 1997. Air bubble entrainment in open
channels. Flow structure and bubble size distributions.
Intl Jl of Multiphase Flow, 23(1), pp. 193-203.
Cheng, C., Webster, C. & Wong, J., 1990. Cavitation-
resistant coatings for concrete hydraulic structures. ACI
Materials Journal, 87(6), pp. 594-601.
Chudina, M., 2003. Noise as an Indicator of Cavitation in a
Centrifugal Pump. Acoustical Physics, 49(4), pp. 463-
474.
Duraiswami, R., Prabhukumar, S. & Chahine, G. L., 1998.
Bubble counting using an inverse acoustic scattering
method. The Journal of the Acoustical Society of
America, 104(5), pp. 2699-2717.
Edel, Y. U., 1977. Guide to protecting spillway structures
from cavitation, Power Technology and
Engineeringformerly Hydrotechnical Construction).
Springer, 11(9), pp. 948-949.
ETH Zurich, Laboratory of Hydraulics, Hydrology and
Glaciology, n.d. Air detrainment of high-speed waters
flows. [Online] Available at: http:\\www.vwa.ethz.ch/
people/hy/archive/hy_151_air_detrainment [Accessed
2017 06 12].
Horn, B. K. P. & Schunck, B. G., 1981. Determining optical
flow. Artificial Intelligence, 17(1-3), pp. 185-203.
Iyer, K., Shridharani, S., Arunkumar, S. & Venkatesan, M.,
2013. Application of Image processing for a Bubble
Column Reactor. Computational Intelligence and
Computing Research (ICCIC).
Jonsson, P., 2014. Evaluation of air micro bubbles in
dialysis sustems in vitro. American Journal of Kidney
Diseases, 63(5).
Karassik, I. & McGuire, T., 1997. Centrifugal Pumps. 2nd
ed. ed. New York: Pergamon.
Li, N., Jia, L. & Zhang, P., 2015. Detection and volume
estimation of bubbles in blood circuit of hemodialysis
by morphological image processing. Cybernetics and
Intelligent Systems (CIS) and IEEE Conference on
Robotics, Automation and Mechatronics (RAM).
Lowe, D. G., 2004. Distinctive Image Feature from Scale-
Invariant Keypoints. International Journal of
Computer Vision, Noviembre, 60(2), pp. 91-110.
Muddle, R. F., Schulte, H. B. M. & Vand den Akker, H. E.
A., 1994. Analysis of a bubbling 2-D gas-fluidized bed
using image processing. Powder Technology, 81(2), pp.
149-159.
O'hern, T. et al., 1995. Development of an electrical
impedance tomography system for an air-water vertical
water-column. Forum on Measurement techniques in
Multiphase Flowa ASME, pp. 1-9.
Peterka, A. J., 1983. The effect of entrained air on cavitation
pitting. Proceedings of Minnesorta International
Hydraulic Convention, pp. 507-518.
Shan-Yong, L., Jiang-An, W. & Si-Guang et al., Z., 2013.
Laser detection method of shi`p wake bubbles based on
multiple scattering intensity and polarization
characteristics.. Acta Phys. Sin, 62(6)(060704).
Volkart, P. & Rutschmann, P., 1984. Rapid flow in spillway
chutes with and without deflectors. A model-prototype
comparison. Proceedings of the Symposium on Scale
Effects in Modeling Hydrualic Research, pp. 3-6.
PHOTOPTICS 2018 - 6th International Conference on Photonics, Optics and Laser Technology
62
