
Abnormal Events Detection for Infrastructure Security
using Key Metrics
Van-Khoa Le, Edith Grall-Maes and Pierre Beauseroy
Institut Charles Delaunay (ICD)/LM2S - CNRS, Troyes University of Technology,
12 rue Marie Curie CS 42060 - 10004 Troyes Cedex, France
Keywords:
Anomaly Detection, Statistic Method, Security System, Cyber-physical Attacks, Key Metric.
Abstract:
This paper presents a detection process which utilizes various sensors (camera, card readers, movement detec-
tor) for detecting automatically abnormal events. The detection process strengthens current security systems to
identify attackers in the context of building and office. Key metrics are proposed to describe people’s behavior
in critical zones of the building. They are built using measures from the sensors, which provide information
about the person, the position, and the instant. These metrics are used to classify abnormal behaviors from
regular ones, based on a statistical classifier. This technique is tested on both simulated data and real data,
in which an attacking scenario was prepared by security experts. Results show that abnormal events from
the scenario have been successfully detected. The experiments demonstrate that the proposed key metrics are
relevant and the proposed detection scheme is appropriate for infrastructure surveillance.
1 INTRODUCTION
In the last decades, there has been an increasing de-
mand for security protection for citizens due to the in-
crease of crime level. Numbers security guards have
been increased in public places to protect the citizen
from terrorist attack. In the context of building and
office, more CCTV or IP cameras have been installed
at critical places to support and reduce the workload
of security guards. However, the operation of these
camera systems still depends on human, which is a
weakness of the security system because the opera-
tors cannot keep concentration through an extended
period, and they have to observe many screens at a
time. So there is a risk that they miss the critical ac-
tivity on the screen. Therefore, the development of an
automatic surveillance system is essential to assist op-
erators to detect abnormal events. An automatic mon-
itoring system is a combination of a set of sensors and
a detection process. The system of sensors is used to
capture the information in the controlled zone. Sen-
sors can be cameras, movement detectors, iris scan-
ners or card readers. The detection process analyzes
the captured information from sensors and compares
it with normal situations to give the decision.
According to (Chandola et al., 2009), the detec-
tion anomaly techniques can be classified into differ-
ent categories like classification based and statistic
based. In detection anomaly classification based tech-
niques, the authors (Wang et al., 2012) proposed an
algorithm to detect abnormal events based on video
streams. The algorithm uses optical flow descriptor
to extract the video data, and a One-Class SVM clas-
sification model to detect the abnormal events. It can
work in crowded scenes to detect the abnormal behav-
iors in public spaces. Activity recognition using deep
learning in (Vignesh et al., 2017) is also a popular ap-
proach to detect abnormal activities. However, in the
context of building and office, the types of activities
such as standing or walking are not diversified, so it
is not easy to distinct attackers base on their gestures.
In (Morris and Trivedi, 2008b), the authors de-
fined a trajectory as a sequence of Point of Interest
(POI) and Activity Path (AP). The POI is the en-
try/exit of the surveillance zone or the zone where the
tracked person stays longer than a threshold. APs are
interspersed with POIs, and a classification model is
built to detect abnormal sequences of AP. In (Bon-
homme et al., 2007), a statistic based method is used
for a surveillance system for elderly in a hospital. A
detection process is based on movement detector’s
data and some diagnostic criterions to measure the
normality of the patient’s behaviors. However, these
systems do not combine many types of sensors into
the surveillance system. They only use one type of
sensors like camera (Wang et al., 2012) or movement
284
Le, V-K., Grall-Maes, E. and Beauseroy, P.
Abnormal Events Detection for Infrastructure Security using Key Metrics.
DOI: 10.5220/0006552102840290
In Proceedings of the 7th International Conference on Pattern Recognition Applications and Methods (ICPRAM 2018), pages 284-290
ISBN: 978-989-758-276-9
Copyright © 2018 by SCITEPRESS – Science and Technology Publications, Lda. All rights reserved

detector (Bonhomme et al., 2007). So the amount
and the type of the information used for analysis are
limited. Despite many efforts on tracking people in
a multi-camera environment, the problem of tracking
people inside a building by multi-camera is still chal-
lenging. So in a building context, techniques which
are built on trajectories classification [(Morris and
Trivedi, 2008b), (Morris and Trivedi, 2008a), (Bran-
dle et al., 2006)] need a good tracking capability of
the sensor system to perform well. Thus it can be
challenging to operate well in a real situation.
In this paper, we concentrate on using data of tra-
jectories of people inside a building and build a detec-
tion method based on this data. The data of trajecto-
ries come from a system of camera and card reader in-
tegrated into a building, and the data collecting steps
were done by a company within our project. A com-
bination of these sensors could give us a precise de-
scription of people’s activities. We propose a detec-
tion scheme based on key metrics that uses data from
various sensors, and that is adapted for building super-
vision. These metrics describe the behavior of people
in the controlled zone into specific periods of an entire
day. The detection process is separated into two parts,
offline training, and online detection. Thresholds for
key metrics at each period is calculated in the train-
ing process, and new observations of the camera are
analyzed and compared with thresholds in the online
detection process. This model has an advantage that it
does not require any prior knowledge about ordinary
events in the zone to set threshold. Instead, it learns
what constitutes regular activity from its observations
in a period, and the confidence intervals automatically
describe this knowledge.
The primary contribution of our work is that we
have integrated a statistical detection process into an
automatic security system in the context of building
and office. We define key metrics that can be used
to differentiate attackers from regular people and can
adapt to different contexts. The detection process can
be trained offline and detect abnormal events online.
The rest of the paper is organized as follows. In
session 2, we present the general idea of the proposed
method. Experimental contents about the detail of the
technique and the datasets are presented in section 3.
In session 4, experiment results are presented by us-
ing simulated data and real data, and we conclude our
work in section 5.
2 PROPOSED METHOD
2.1 General Description
The proposed detection process aims to apply for
vulnerable local areas in the building. We assume
that sensors are installed to capture people’s move-
ment in this zone and can provide data in the format
[ID, t, Pos], which describe the presence of a per-
son with identity ID at instant t in a position Pos in-
side the building. Then we define key metrics which
are characteristics of the zone and can be used to de-
tect an abnormal behavior. The detection process is a
method based on the statistics of the key metrics and
is parameterized with thresholds used for decision-
making. A training stage uses regular events to de-
termine the threshold values. In the operational stage,
the observed metrics are compared with the prede-
fined threshold to raise the alarm if some values ex-
ceed the thresholds.
2.2 Key Metrics And Time Windows
In this technique, we are interested in examining the
behavior of people in relation to their presence in a
critical area. Key metrics describe the duration or
the instant of presence at a place. Because a typi-
cal duration in the morning may become abnormal in
the evening, so we propose to define key metrics de-
pending on the considered moment. For this purpose,
the key metrics are attached to a time window. The
simplest way is to divide the day into multiple equal
parts with a chosen width which we call fixed win-
dow. However, some key metrics may be dependent
on the position of the window; it may be more suit-
able to use a sliding window, which is defined by its
width and shift, so that a day is a set of overlapped
windows. These two types of time window are pre-
sented with their parameters in Figure 1.
W1 W2 W3 W4 W5 W6
width
W1 W3
W4
W5
W6
W7
W2
width
Shift
Fixed window
Sliding window
Figure 1: Two types of time window.
For both time windows, there is a trade-off when
defining the parameter window’s width. If the width
is too large, a window may include key metrics with
Abnormal Events Detection for Infrastructure Security using Key Metrics
285

different statistical properties, and thus the estimated
values could be biased. On the contrary, if the width
is too short, the number of observed key metrics in
the windows may be too small to obtain a reliable es-
timation of the statistics. Besides, it has to be noted
for the sliding window that the computation may be
expensive if the shift is too small. The width and the
sliding speed are chosen by author’s experience.
The primary key metrics that we propose are du-
ration of stay, number of visits and occupation rate,
which can be varied in three fields: type of people,
time and location. It means we can calculate same
primary key metrics for different types of people, time
periods or locations according to the input data. For
example, the metric Average duration of each visit of
an engineer at the printer zone is computed by using
raw data of engineers at the printer area.
2.3 Training Stage
In the training stage, we use observations of sensors
collected during regular days. The aim is to deter-
mine the threshold of each predefined key metric in
each time window. The following is a summary of
this stage:
1. For the predefined key metrics, raw data from the
training set is filtered to fit with the appropriate
key metrics. This step is called data preprocess-
ing.
2. Next, according to the time window’s type, and
its parameter (width, shift), the events inside each
time window are collected, and the metrics are
computed using these events.
3. Finally, thresholds are set for the metrics. The cal-
culations of thresholds are based on the mean and
standard deviation of the metric in each time slot.
Data from cameras
and sensors in real
time
Data
preprocessing
Key metrics
computation
Output
alerts
Surpass the
Thresholds?
Yes
No
Data from cameras
and sensors of
training dataset
Data
preprocessing
Key metrics
computation
Thresholds
calculation
Training phase
Detection phase
Figure 2: Training and operational stages for detection pro-
cess.
2.4 Operational Stage
The operational stage is based on the following prin-
ciple: the events are observed in real time, and when
certain activity criteria exceed a reference value (the
detection threshold), an alarm is generated. The de-
tection process is as follow:
1. The data from cameras and sensors are collected.
2. A filter allows selecting only events in the prede-
fined zone. It chooses the points of trajectories
which are closed to the critical object like printer
because the attackers cannot cause much damage
if they are distanced from the weak points of the
building.
3. The key metrics in each window are computed
and compared with the threshold. An event is con-
sidered as abnormal if the threshold is exceeded.
4. If the event is normal, we return to the first step
and wait for new events, if not, we send an alarm
to the system describing the abnormal event and
then come back to the first step.
The training and operational stage of the detection
process are presented in Figure 2. The alert is sent
right at the moment the metric exceeds the threshold.
3 EXPERIMENTAL CONTENT
3.1 Infrastructure
A typical office is presented in Figure 3. Two crit-
ical zones in this map are the server room and the
area around the printer because there are key elements
that can be violated by attackers. We use this building
as the applying case for our technique, and simulated
data is generated on this cartography. The camera and
sensor system is installed in the building so we can
observe every movement in the passage, but not in-
side the office or server room.
Server
Office
Printer
Camera
Door
Figure 3: Simulation office.
In the real building, a system of IP cameras and
card readers has been installed along passages and
ICPRAM 2018 - 7th International Conference on Pattern Recognition Applications and Methods
286

at the main entrance or critical zones such as printer
zone or server room to guard the whole building. Em-
ployees have to check their card each time they enter
or leave the main entrance, or the server room or make
a photocopy.
3.2 Key Metrics
In this section, we present the key metrics that were
chosen for experiments:
• Number of visits in a time slot in the controlled
zone ; the aim is to detect that an abnormal num-
ber of persons is visiting the zone. This metric
counts the number of visits in a sliding time win-
dow, assigning a visit to the time window of the
entering moment.
• Occupation rate in a time slot in the controlled
zone; the aim is to detect that the percentage of
the time window that the place is occupied by at
least one person is abnormal. The sliding window
is applied for this metric.
• Average duration of a visit of a person in the con-
trolled zone; the aim is to detect the abnormal
length of stay. The duration is assigned to the time
window which the events begin. This metric uti-
lizes a fixed window. The two previous metrics
provide only one value for each time window. On
the contrary, for this metric there are many du-
rations in one time window, which correspond to
different events. So there are different possibili-
ties to assign a value of duration that can represent
the metric. The most common ways are using the
average or the maximal duration.
In order to determine the threshold for each metric
M
k
in time window k, the average µ
M
k
and the stan-
dard deviation σ
M
k
are estimated using the data in the
training set composed of m days, assumed to be with-
out abnormal events, according to:
µ
M
k
=
∑
m
j=1
A
k, j
m
(1)
σ
M
k
=
s
1
m
m
∑
j=1
(A
k, j
− µ
M
k
)
2
(2)
where A
k, j
is the value of the metric M
k
, in day j. The
threshold T
M
k
is calculated according :
T
M
k
= µ
M
k
+ α ∗ σ
M
k
(3)
where α is a tuning parameter. The bigger the value of
α is, the higher the numbers of true positive and false
positive are. The value α is chosen as in (Denning,
1987), where the probability of a value falling outside
the confidence interval T
M
k
is at most 1/α
2
. Which is
at most 0.0625 for α = 4.
3.3 Data description
We use two datasets in this application, a simulated
dataset and a real dataset.
3.3.1 Simulated data
The raw simulated data is a vector S with four
features: S = [IDperson,Time,X
coordinate
,Y
coordinate
].
They depict the people’s trajectories in the building,
as the example given in Table 1. These data allow
building events specifying the length of stay in the
predefined controlled area. Assuming that the posi-
tions of the first three observations in Table 1 are in-
side the predefined zone Printer, and the last obser-
vation is out of the area, the event given in Table 2
is created using these data. It defines the ID of the
person, the time, the controlled area location, and the
duration.
Table 1: Raw data.
ID Time X Y
101 9:20:01 4.5 -5
101 9:20:02 4.6 -4.8
101 9:20:03 4.7 -4.6
101 9:20:04 4.8 -4.3
Table 2: Event description.
ID Time Location Duration (s)
101 9:20:01 Printer 3
To illustrate the estimation of the statistics of the
key metrics, a set composed of six events in two days
is reported in Table 3.
Table 3: Events in two days.
Day ID Time Location Duration (s)
1 101 9:05:00 Printer 10
1 103 9:06:01 Printer 35
1 102 9:10:01 Printer 60
2 101 9:20:01 Printer 45
2 102 9:40:01 Printer 20
2 103 10:10:01 Printer 50
Using a window width of 3600 seconds and cho-
sen the metric M as Average maximal duration of a
visit. This metric is an extension of the metric Aver-
age duration of a visit which calculates the most atyp-
ical duration of an event. A
k, j
= max(D
i,k, j
) where
D
i,k, j
is the duration of the i
th
event in time window
k day j . Therefore, A
10,1
= 60 and A
10,2
= 45. M
10
is the metric in the interval between 9 o’clock and 10
o’clock and M
11
is the metric in the interval between
Abnormal Events Detection for Infrastructure Security using Key Metrics
287
10 o’clock and 11 o’clock. Then the estimated values
for µ
M
10
and µ
M
11
are:
µ
M
10
=
∑
2
j=1
A
10, j
2
=
60 + 45
2
= 52.5 (4)
µ
M
11
=
∑
2
j=1
A
11, j
2
=
0 + 50
2
= 25 (5)
In the simulated dataset, there were a total of 11
days, including two days with unusual events and nine
regular days. Therefore, the typical days were used
for training and the abnormal days were used for test-
ing.
3.3.2 Real data
In the real dataset, the tracking process is a combi-
nation of face detection and silhouette tracking. The
format of the raw data in the real dataset is more
complicated than the format for the simulated dataset,
but it keeps the same core information. It assigned
the UNIX timestamp for each observation in the real
dataset. To construct the real dataset, a system of
cameras and sensors was installed to capture move-
ments of people in a building for five days. One day
contains an abnormal event with the same attacking
scenario as the simulated data. Then four days were
available for the training phase of the system and one
day was used for testing in real-time the detection pro-
cess.
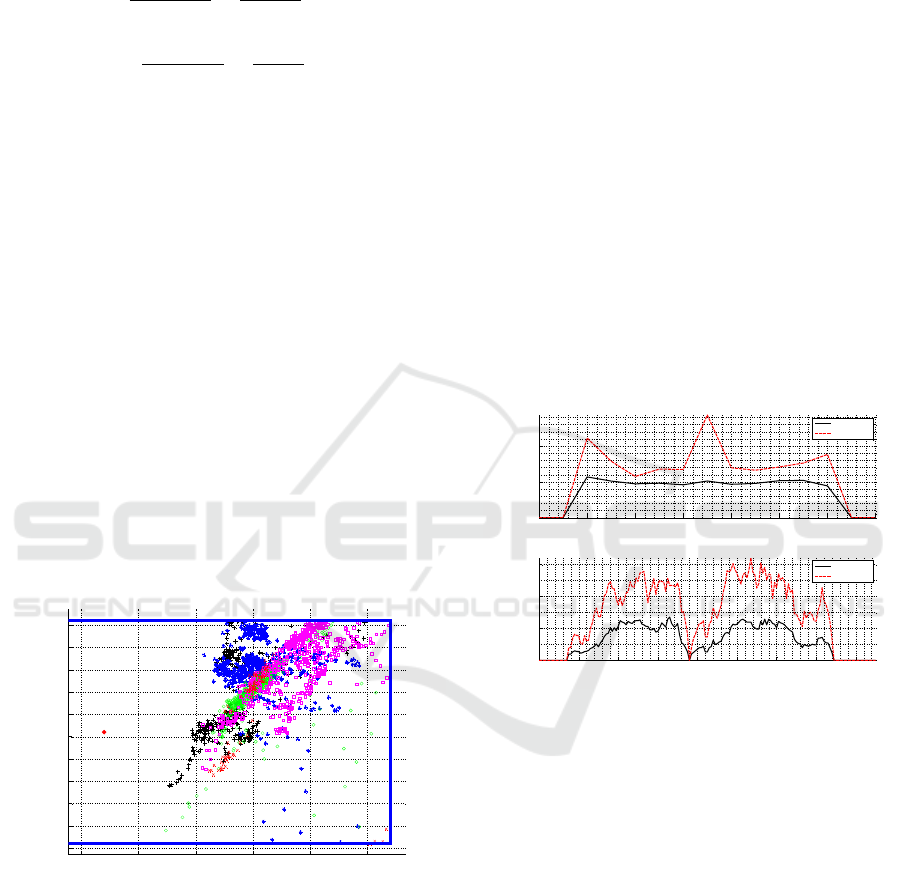
4.3 4.4 4.5 4.6 4.7 4.8
-5.5
-5.4
-5.3
-5.2
-5.1
-5
-4.9
-4.8
-4.7
-4.6
-4.5
X
Y
Printer
Figure 4: Observations around printer, the blue square is the
predefined zone, each color specifies a person’s positions.
The visualization of raw data in the real dataset is
presented in Figure 4, where the critical zone around
the printer is inside the rectangle. Except for the
printer point, each point represents position’s mea-
surements of people in the zone.
4 EXPERIMENTAL RESULTS
For both datasets, the data of the regular days in the
training set were used to determine the thresholds of
the chosen key metrics. Then the system was per-
formed using the set containing the day(s) with ab-
normal data. The critical zone that we used in our ex-
periment is the zone of 0.5 meters around the printer
and parameter α was equal to 3. Two metrics cho-
sen for experiments are Average maximal duration of
a visit in a zone and Number of visits in a zone and
are symbolized as A
location
and N
location
respectively.
4.1 Simulated Data
There are two attack scenarios in the simulated
dataset. The first one is an intruder disguised as an
employee and who tried to hack into the information
system through the printer. The second attack is an
intrusion in the server room which happens on a dif-
ferent day.
6 8 10 12 14 16 18 20
0
50
100
Duration of a visit at the printer
Time slot
Duration (s)
Average
Threshold
80 100 120 140 160 180 200 220 240
0
5
10
15
Number of visits at the printer
Time slot
Number of visits
Average
Threshold
Figure 5: Training results at Printer.
The result of the training stage is a series of thresh-
olds for each key metric, in relation to the time posi-
tion on the day of the time window. Figure 5 is the
curve of means and thresholds of the metrics A
printer
and N
printer
.
In the metric A
printer
, a fixed window with a width
equals to 3600 seconds was applied. So a day is sep-
arated into 24-time slots. The time slot i indicates a
window from i − 1 o’clock to i o’clock.
In the metric N
printer
, we used a sliding window
with a shift of 300 seconds and a width of 1800 sec-
onds. Therefore, the day contains 288-time slots. For
this window, the time slot number i specifies a win-
dow in the time interval from (i ∗ 300/3600−1800) to
(i ∗ 300/3600). For example, time slot 160 captures
all events between 12:50:00 and 13:20:00. There is
no observation before 7 am, and after 19 pm in the
dataset, so the figures are scaled for better visualiza-
tion.
ICPRAM 2018 - 7th International Conference on Pattern Recognition Applications and Methods
288
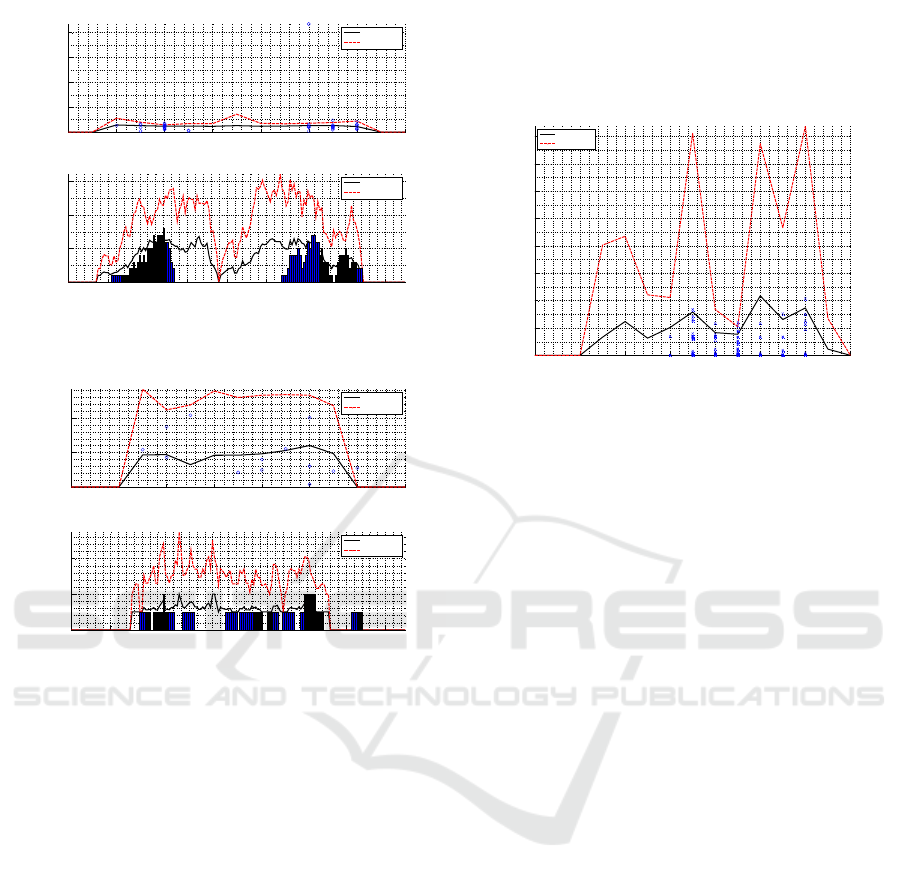
6 8 10 12 14 16 18 20
0
200
400
600
800
Duration of a visit at the printer
Time slot
Duration (s)
Average
Threshold
80 100 120 140 160 180 200 220 240
0
5
10
15
Number of visits at the printer
Time slot
Number of visits
Average
Threshold
Figure 6: Detection results at printer zone.
6 8 10 12 14 16 18 20
0
1000
2000
Duration of a visit in server room
Time slot
Duration (s)
Average
Threshold
80 100 120 140 160 180 200 220 240
0
2
4
Number of visits in server room
Time slot
Number of visits
Average
Threshold
Figure 7: Detection results in server room.
Figure 6 is the detection results of two key metrics
mentioned above, and it detects an abnormal duration
in the time window 16 (between 15 and 16 o’clock).
Figure 7 shows the detection result of the two key
metrics A
server
and N
server
. Both key metrics detects
the abnormal access to the server room between 17
and 18 o’clock.
The different behaviors of people at two different
places like the printer zone and server room are ex-
plored in Figure 6 and Figure 7. The average duration
in the server room is longer than at the printer zone
because of the different action’s type at each location.
The number of visits in the server room is lower and
more stable than in the printer area because the printer
is placed in an open space like a passage. On the other
hand, only administrators have the right to access the
server room.
4.2 Real data
The metric A
printer
was calculated using real data in
this experiment. Figure 8 describes the training and
detection results of the real dataset. An abnormal
event appears in the 15th time slot corresponding to
the attack in front of the printer between 14 and 15
o’clock.
6 8 10 12 14 16 18 20
0
50
100
150
200
250
300
350
400
Duration of a visit at the printer
Time slot
Duration (s)
Average
Threshold
Figure 8: Detection result of real dataset.
5 CONCLUSION
In this article, we have introduced a detection process
to detect abnormal events at a zone inside a build-
ing. This technique explores different key metrics of
critical areas. A training stage allows to determine
thresholds, and in the operational stage, the measured
metrics are compared with the thresholds to raise pos-
sibly an alarm. Cameras and card readers are used
to collect daily activities of the people in the build-
ing. Key metrics allow describing people’s behavior
in critical zones of the building. They are built using
measures from the sensors, which provide informa-
tion about the person, the position, and the instant.
Sliding time windows or fixed time windows provide
key metrics which are time-dependent. We used both
simulated dataset and real dataset to train a detection
process and detect anomaly given in attacking scenar-
ios. Our experimental evaluation demonstrates that
the proposed key metrics are relevant to detect abnor-
mal events in the attacking scenarios for both datasets.
ACKNOWLEDGEMENTS
This work is currently being undertaken as part of
the VIRTUALIS project by cooperation between UTT
(the University of Technology of Troyes), Thales
(https://www.thalesgroup.com/fr) and other compa-
nies. Special thanks go to the staff of Thales for their
help during the data collection.
Abnormal Events Detection for Infrastructure Security using Key Metrics
289

REFERENCES
Bonhomme, S., Campo, E., Esteve, D., and Guennec, J.
(2007). An extended prosafe platform for elderly
monitoring at home. In Engineering in Medicine
and Biology Society, 2007. EMBS 2007. 29th Annual
International Conference of the IEEE, pages 4056–
4059. IEEE.
Brandle, N., Bauer, D., and Seer, S. (2006). Track-based
finding of stopping pedestrians-a practical approach
for analyzing a public infrastructure. In Intelligent
Transportation Systems Conference, 2006. ITSC’06.
IEEE, pages 115–120. IEEE.
Chandola, V., Banerjee, A., and Kumar, V. (2009).
Anomaly detection: A survey. ACM computing sur-
veys (CSUR), 41(3):15.
Denning, D. E. (1987). An intrusion-detection model. IEEE
Transactions on software engineering, (2):222–232.
Morris, B. T. and Trivedi, M. M. (2008a). Learning and
classification of trajectories in dynamic scenes: A
general framework for live video analysis. In Ad-
vanced Video and Signal Based Surveillance, 2008.
AVSS’08. IEEE Fifth International Conference on,
pages 154–161. IEEE.
Morris, B. T. and Trivedi, M. M. (2008b). A survey
of vision-based trajectory learning and analysis for
surveillance. IEEE transactions on circuits and sys-
tems for video technology, 18(8):1114–1127.
Vignesh, K., Yadav, G., and Sethi, A. (2017). Abnor-
mal event detection on bmtt-pets 2017 surveillance
challenge. In Computer Vision and Pattern Recogni-
tion Workshops (CVPRW), 2017 IEEE Conference on,
pages 2161–2168. IEEE.
Wang, T., Snoussi, H., and Smach, F. (2012). Detection
of visual abnormal events via one-class svm. In Pro-
ceedings of the International Conference on Image
Processing, Computer Vision, and Pattern Recogni-
tion (IPCV), page 1. The Steering Committee of The
World Congress in Computer Science, Computer En-
gineering and Applied Computing (WorldComp).
ICPRAM 2018 - 7th International Conference on Pattern Recognition Applications and Methods
290
