
On Detecting Chronic Obstructive Pulmonary Disease (COPD) Cough
using Audio Signals Recorded from Smart-Phones
Anthony Windmon
1
, Mona Minakshi
1
, Sriram Chellappan
1
, Ponrathi R. Athilingam
2
,
Marcia Johansson
2
and Bradlee A. Jenkins
2
1
Department of Computer Science and Engineering, University of South Florida, Tampa, FL, U.S.A.
2
College of Nursing, University of South Florida, Tampa, FL, U.S.A.
Keywords:
Chronic Obstructive Pulmonary Disease, COPD, Cough, Machine Learning, Algorithms, Classification.
Abstract:
Chronic Obstructive Pulmonary Disease (COPD) is a lung disease that makes breathing a strenuous task with
chronic cough. Millions of adults, worldwide, suffer from COPD, and in many cases, they are not diagnosed
at all. In this paper, we present the feasibility of leveraging cough samples recorded using a smart-phone’s
microphone, and processing the associated audio signals via machine learning algorithms, to detect cough
patterns indicative of COPD. Using 39 adult cough samples evenly spread across both genders, that included
23 subjects infected with COPD and 16 Controls, not infected with COPD, our system, using Random Forest
classification techniques, yielded a detection accuracy of 85.4% with very good Precision, Recall and F-
Measures. To the best of our knowledge, this is the first work that designs a smart-phone based learning
technique for detecting COPD via processing cough.
1 INTRODUCTION
Chronic Obstructive Pulmonary Disease (COPD) is a
common and treatable disease, distinguishable by per-
sistent respiratory symptoms and airflow limitations
due to airway and/or alveolar abnormalities (GOLD,
2017). The main cause of COPD in developed coun-
tries is tobacco smoking. In the developing world,
COPD occurs in people exposed to fumes from burn-
ing fuel for cooking/ heating with poor ventilation.
According to World Health Organization (2010), 65
million people, worldwide, have moderate to severe
COPD. Studies also show that more than 50% of
adults with low pulmonary function were not aware
that they had COPD. The prevalence in America is
projected to be over 20 million today. (CDC, 2016).
COPD symptoms often don’t appear until signifi-
cant lung damage has occurred. However, daily cough
and mucus (sputum) production at least three months
to a year or two are reported by 90% of COPD suf-
ferers (GOLD, 2017). Patients tend to find coughing
the most embarrassing and disruptive of these symp-
toms. Coughing can interfere with social events, like
going to the movies, and it can prevent patients from
falling asleep at night. As annoying as coughing may
be, it actually serves a useful function. Deep cough-
ing clears the mucus clogging the airways, allowing
individuals to breathe more easily (GOLD, 2017).
The evaluation of chronic cough begins with a
thorough history, including smoking status, environ-
mental exposures, and medication use. Once the
healthcare provider diagnoses that the coughing and
trouble breathing are due to COPD, patients are told
to quit smoking and are started on medications to con-
trol symptoms. For patients with COPD, coughing is
due to mucus buildup. Therefore, patients are also
taught to self-manage COPD symptoms at home and
taught a coughing technique, called huff cough, to
bring up mucus without wearing out. It is important
however, for patients to understand their coughing
patterns to know if their symptoms are getting worse
due to superimposed infection, or if their symptoms
are more stable. The clinical criteria for assessment of
COPD include a pulmonary function test and listen-
ing to lung sounds with a stereoscope for wheezing,
rales, and other adventitious sounds by trained health
care providers. But this is not possible to be done in
patient homes, which imposes a serious challenge to
care, which this paper aims to overcome.
1.1 Our Contributions
In this paper, we make the following contributions.
Between Fall 2016 and Spring 2017, we visited
Windmon, A., Minakshi, M., Chellappan, S., Athilingam, P., Johansson, M. and Jenkins, B.
On Detecting Chronic Obstructive Pulmonary Disease (COPD) Cough using Audio Signals Recorded from Smart-Phones.
DOI: 10.5220/0006549603290338
In Proceedings of the 11th International Joint Conference on Biomedical Engineering Systems and Technologies (BIOSTEC 2018) - Volume 5: HEALTHINF, pages 329-338
ISBN: 978-989-758-281-3
Copyright © 2018 by SCITEPRESS – Science and Technology Publications, Lda. All rights reserved
329

Tampa General Hospital in the Hillsborough County
area of Downtown Tampa, Florida, USA to collect
cough samples from patients diagnosed with COPD,
and those without any history of COPD (Controls).
The collection process was executed using a smart-
phone recording application developed in Android.
While specific details are presented later, Table 1
summarizes the patient’s demographics. Our experi-
ments resulted in collecting 82 seconds of cough sam-
ples from 23 COPD patients and 83 seconds of cough
samples from 16 Controls. Then, we extracted sev-
eral audio-related features from the cough samples
and used an Information Gain approach to select a
subset of 15 features, which were used to develop a
cough detection model.
Our model is based on the notion of Random
Forests Classifiers, which are ideal for our problem,
because they are one of the most accurate learners
available, produce high classification accuracy, and
reduce the likelihood of over-fitting (Breiman, 2001).
Our performance evaluations, using a 10-Fold Cross
Validation technique, yielded an accuracy of 85.4%
with very good Precision, Recall and F-Measure in
distinguishing COPD from Controls cough patterns.
1.2 Paper Organization
The remainder of this paper is organized as follows.
Section 2 discusses related work, Section 3 details the
cough sample collection process, and Section 4 ex-
tensively elaborates upon the design of our algorithm.
Section 5 presents our results and Section 6 presents
clinical applications of our work. Finally, we con-
clude the paper in Section 7.
2 RELATED WORK
We now present important work related to our paper.
a. Detecting COPD from Breath Analysis: In
(Berkel et al., 2010) and (Phillips et al., 2012), tech-
niques are developed to analyze breath samples using
gas chromatography and mass spectrometry to detect
the presence of volatile organic compounds (VOCs)
that are indicative of COPD. Accuracies, in range of
70% to 90%, have been reported in such studies using
samples of around 80 to 120 subjects. Unfortunately,
these techniques are quite expensive and un-suitable
for periodic or in-home use.
b. Detecting COPD symptom exacerbations
over time: Other COPD related work includes
(Amalakuhan et al., 2012), where a system to deter-
mine factors that predict risks for multiple COPD ex-
acerbations in a single year was developed. Using
Table 1: Subject’s Demographics Data.
Description COPD Controls
Age: Mean/SD 59.85±
12.88
67.43±
14.32
Range 30-86 30-89
Gender: Male 14 10
Female 9 6
Martial
Status:
Married 15 7
Single, Di-
vorced or
Widowed
8 9
Race: White 13 13
African Amer-
ican
8 1
Hispanic 2 2
Education
Level:
Graduate De-
gree or above
2 3
Bachelor’s De-
gree
4 6
Some College 5 3
High
School/GED
8 4
>High School 4 0
Smoking
Status:
Smoker 6 1
Quit Years
Ago
9 1
Non-Smoker 8 14
a Random Forests statistical model and 106 patients
the authors found that 5 variables (employment sta-
tus, body mass index, number of previous surgeries,
index of admission albumin level and whether there
was administration of Azithromycin with Ceftriaxone
during the IA) are leading causes of COPD exacer-
bations. In (Patel et al., 2009), wearables to monitor
motion and respiration rate from COPD patients were
used to identify changes in physiological responses
when patients are physically active. These papers are
considered related work since they discuss new inno-
vative methods of detecting or tracking COPD in in-
fected individuals. However, our work is unique in
that it aims to provide a mechanism to detect COPD
as and when symptoms manifest via cough in the pa-
tient’s natural settings.
c. Work related to smart-phone assisted health-
care: In the past decade, there has been a flurry of ac-
tivity centered on using various embedded sensors in
smart-phones like accelerometers, gyroscopes, cam-
eras, microphones and more for healthcare including
the detection of falls (Cheffena, 2016); respiratory
symptoms like sneeze, cough, sniffle and throat clear-
HEALTHINF 2018 - 11th International Conference on Health Informatics
330
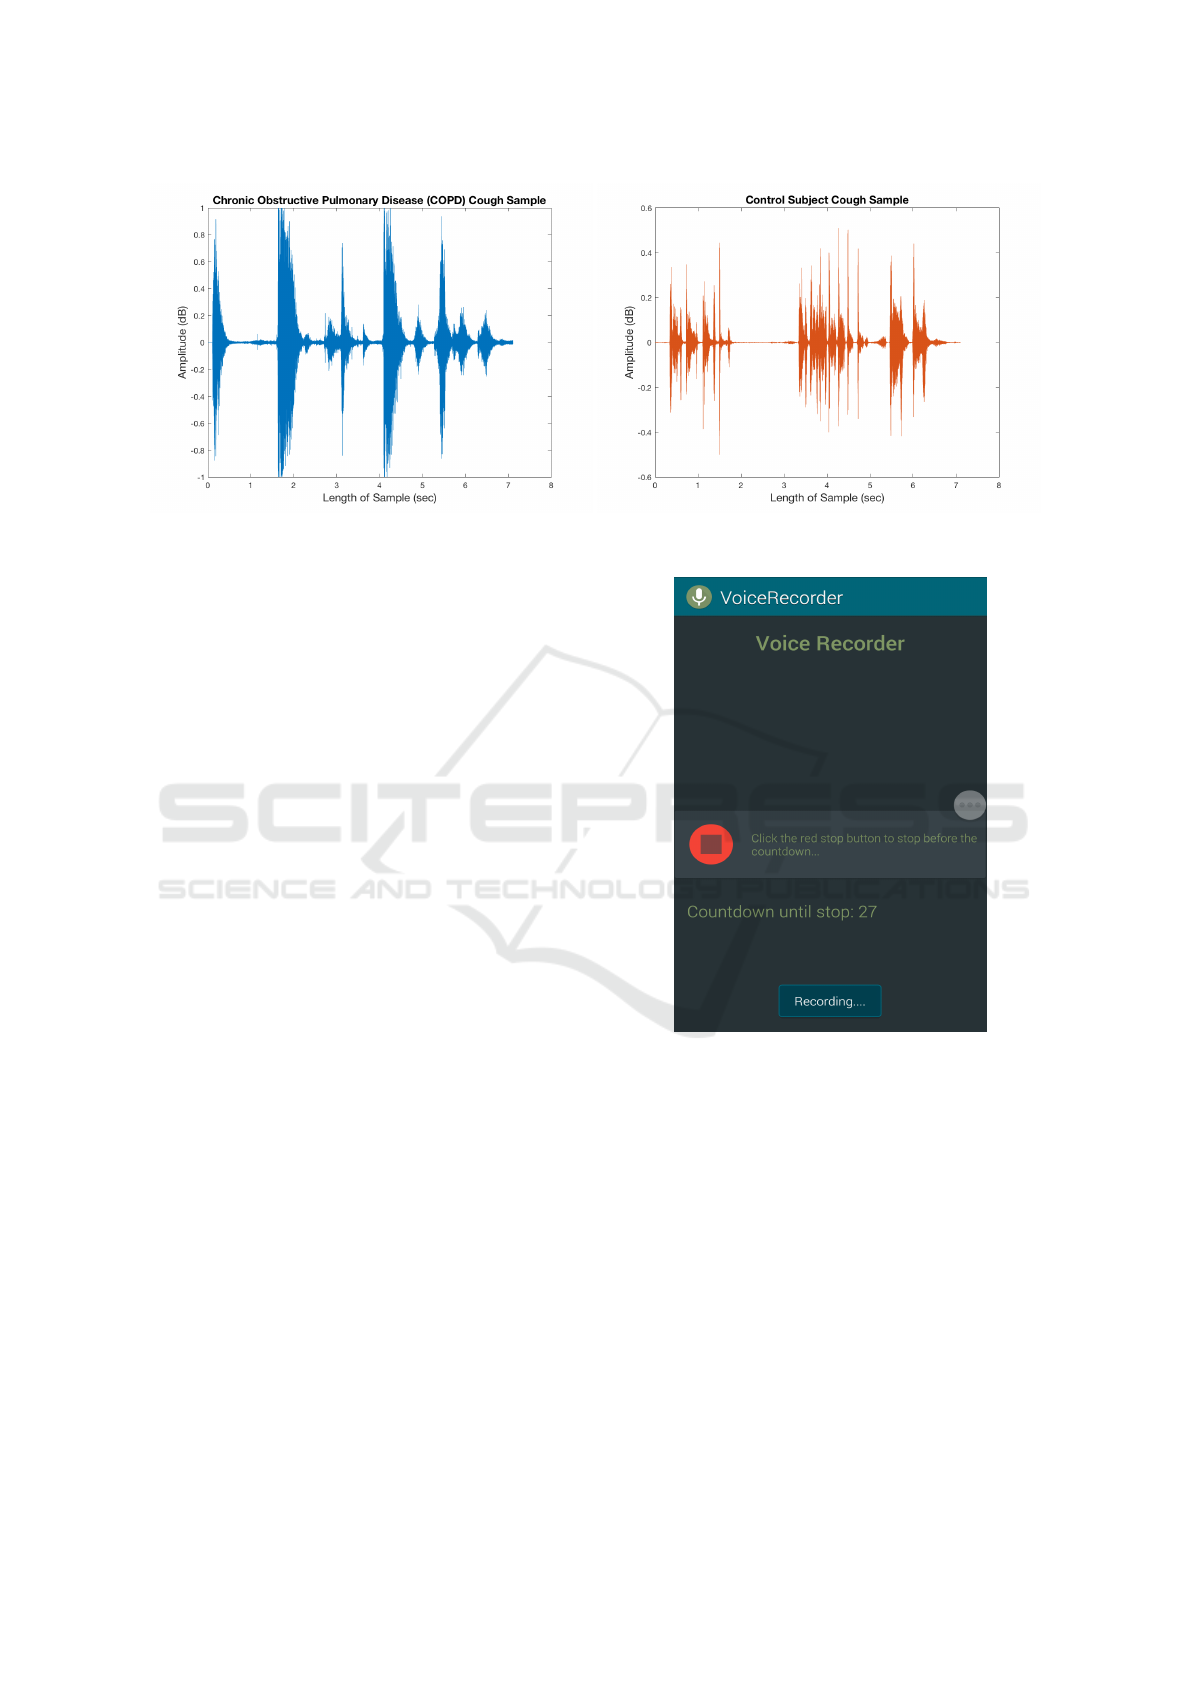
Figure 1: Amplitude (dB) and Length (sec) of a COPD and Controls Cough Sample.
ing (Sun et al., 2015); pertusis (Pramono et al., 2016)
and more. Our paper innovates in presenting a system
based on smart-phone audios that is simple, low cost,
and ubiquitous for COPD detection that is applicable
for in-home usage.
3 DATA COLLECTION
In this section, we first present important details on
our custom mobile application used to record cough
samples. Then, we elaborate on our data collection
process to record COPD and Controls cough.
3.1 App for Recording Cough Samples
All cough samples were recorded using a cus-
tom voice recording android application, called
VoiceRecorder, developed by the authors. This appli-
cation was implemented on the Samsung Galaxy S5
smart-phone, which uses Android Operating System
5.1.1 Lollipop, used to record cough samples. This
smart-phone devices also consists of a microphone
with a sampling rate of 44100Hz. We present the
graphical user interface (GUI) of this recording appli-
cation in Figure 2. The recording applications works
as follows:
1. When the application is opened, it immediately
initiates a 30 second timer, and audio recording
begins.
2. The Stop button is used to stop the audio record-
ing. Otherwise, the application will automatically
close and stop the audio recording upon reaching
the 30 second limit.
3. Recording is saved in local device storage of
smart-phone as 3GP file.
Figure 2: GUI of Voice Recorder Mobile Application that
we Developed to Collect Cough Samples.
3.2 Recording Cough Samples
Tampa General Hospital (TGH) in Downtown Tampa,
FL was our primary source for data collection. With
the expertise of nursing staff, we identified many pa-
tients with COPD, and many alternative subjects, of a
similar age group, that did not have COPD and served
as Controls. All subjects that gave us their cough sam-
ples consented to do so.
Individuals with COPD and Controls were num-
bered traditionally, as we recorded their cough sam-
ples. Prior to recording each cough sample, the nurse
would turn on the app, and state a unique identifying
number for the patient, followed by stating whether
On Detecting Chronic Obstructive Pulmonary Disease (COPD) Cough using Audio Signals Recorded from Smart-Phones
331

or not the patient has COPD (stated as “COPD” or
“Controls”). Then, the subject was asked to cough
into the microphone of the Samsung Galaxy S5 smart-
phone for a maximum of 30 seconds. The duration
of each cough ranged from 2 seconds to 14 seconds.
The number of subjects were 23 with COPD and 16
without COPD. Table 1 presents demographics of the
subjects.
4 TECHNICAL APPROACH
In this section, we discuss our approach to distin-
guish COPD from Controls cough, using smart-phone
recorded cough samples. In our approach, we first re-
move irrelevant noises and pauses from each sample,
tag each sample in the presence of medical profes-
sionals with COPD expertise, extract and select lim-
ited features from cough audio, and then design our
algorithm for classification.
4.1 Remove Irrelevant Noise and Pauses
The first step is to remove irrelevant noise from each
cough sample. Occasionally, during data collection,
there were additional sounds picked up while record-
ing cough samples. These sounds were derived from
televisions, medical equipment, surrounding conver-
sations, and dialog between the nurses and patients.
Such noises were considered distractions from our
main concern, which is the cough itself, and, there-
fore, were removed. Also, recall that nurses began
each recorded cough sample stating a patients num-
ber and cough association. Once we created individ-
ual files, separating COPD and Controls cough sam-
ples, the nurses recorded identification was no longer
needed, so it was discarded.
Additionally, there were few instances of sam-
ples containing long pauses before, after and in be-
tween coughs. These occurrences, as well as previ-
ously mentioned ones, will cause inconsistencies in
samples that could later become a problem while ex-
tracting features. Consequently, pauses were removed
to ensure consistency. All noises, additional voices,
and pauses were removed from cough samples using
a publicly available online audio cutting application.
4.2 Data Tagging to Enable Learning
Once all noises were removed, we developed a one
second windowing algorithm to partition each cough
sample into one second segments. That is, for a
cough duration of 10 seconds, we extract 10 segments
each of one second duration. Then, our collabora-
tors with COPD expertise listened to each second of
each cough sample, to tag the segment as indicative of
COPD or otherwise. As a result of this step, we ob-
tained a total of 82 seconds of COPD cough, and 83
seconds of Controls cough, which enabled subsequent
model development.
4.3 Feature Extraction and Selection
The third step is feature extraction. We first chose 30
features to extract from each cough sample
1
. Since,
we partitioned each cough sample to multiple one
second segments, these 30 features were computed
for each one second segment for COPD and Controls
cough. For example, suppose a COPD cough sam-
ple lasted for 10 seconds. Then in total, 300 features
are computed for this sample. The same is done for
Controls coughs. After computing features for both
cough classes, the accumulated numerical data from
features was appended to a .csv file where each fea-
ture and class name (COPD or CONT ROLS) was la-
beled to create a dataset, i.e., a collection of organized
data.
After extracting features, the next step is to intel-
ligently reduce the number of features to a select few
that provides high discriminatory power among the
two classes. We did this because processing too many
features can lead to over-fitting and increased over-
head. To do so, we employed an Information Gain
feature selection approach (Lee and Lee, 2006). In
this approach, the entropy (or randomness) of each
feature is computed to determine the feasibility of that
feature for classification. More specifically, Informa-
tion Gain of each feature is calculated as the differ-
ence between entropy of all features combined and
entropy of the individual feature. A higher difference
means more information contained in that feature for
classification, and hence is more useful. The Informa-
tion Gain IG for a feature F
i
calculated is as follows:
IG(Tr, F
i
) = H (Tr) −
∑
t ε F
i
p(t)H(t), where (1)
H(Tr) = −
∑
x ε m
p(x)log
2
p(x) (2)
Here, Tr denotes the set of training samples con-
taining all features extracted for all cough segments,
and F
i
denotes the i
th
feature. The term t denotes the
number of unique values for the feature F
i
, and p(t) is
the ratio of the number of cough segments for which
the corresponding Feature F
i
= t. Here, H(Tr) and
1
Due to space limitations, all features initially chosen
for classification are not elaborated in the paper. See Ap-
pendix for complete list of features.
HEALTHINF 2018 - 11th International Conference on Health Informatics
332

H(t) are the entropy of the features in training set Tr
and the entropy of features in the subset t respectively.
The term p(x) is the ratio of number of cough seg-
ments in one class x (i.e., COPD or CONT ROLS) to
the total number of cough segments in training data
set Tr and m is the total number of classes (in this
case = 2).
This feature selection technique provides a good
measure for deciding the relevance of a feature by
quantifying the degree of utility (i.e., via entropy).
For our problem scope, we attempted the use of the
top 5, 10, 15, 20 and 25 features and selected the top
15 features, described in Table 2, which produced the
highest classification accuracy. See Table 3 for defi-
nition of terms used in Table 2’s Equation column.
4.4 Algorithm Design
The last step is design of our classification algorithm.
In this paper, we apply a Random Forest based tech-
nique for our problem. Random Forests creates ran-
dom subsets of training samples from datasets by cre-
ating a congregation of decision trees. Each decision
tree predicts a class, independently. The class predic-
tion is based on a vote made by each decision tree and
the class that earns the majority vote will be the final
predicted class. For instance, let us denote our dataset
S as training samples of cough, each of which consists
of F cough features. RF constructs the training model
by executing the following steps:
1. C random samples are selected from the dataset S,
to train model of a specific decision tree.
2. G random features are chosen from the set of un-
used cough features F, where G F.
3. Each decision tree will grow to its maximum size
until it has reached its benchmark.
In our algorithm, the benchmark consisted of 100 de-
cision trees which gave us the best classification ac-
curacy. Once the forest has been ensembled, test-
ing data specimen is labeled with one of the classes
(COPD or C ONT ROLS) by taking the majority vote:
i.e., it is labeled with the class which has been selected
by maximum number of trees.
To illustrate further, given an unclassified fea-
ture variable z, which is a variable extracted from
the cough samples, conditional probabilities of both
classes are calculated by taking the average of the
conditional probabilities given by the trees construct-
ing the forest.
The following describes how conditional proba-
bilities are determined. Given decision tree R, the un-
classified input feature variable z, we can denote v(z)
as the leaf node where z is assigned when classified
by R. The probability P(e|z, R) that variable z lies in
class e, where e ∈ {COPD or CONT ROLS}, is calcu-
lated as follows:
P(e
|
z, R) =
w
e
w
. (3)
Here, w
e
represents the amount of cough training
samples assigned to v(z) after the learning procedure
and w is the amount of cough training samples as-
signed to v(z) by the training procedure. The proba-
bility P(e|z) that variable z belongs to the cough class
e is calculated as follows:
P(e
|
z) =
1
J
J
∑
i=1
P(e
|
z, R), (4)
where J is the number of trees present in the for-
est and P(e|z, R) is the conditional probability of the
decision tree R. The following output is given for the
variable z to be classified:
c = {P(COPD
|
z), P (CONT ROLS
|
z)}. (5)
The corresponding class (COPD or CONT ROLS)
of a decision tree containing the maximum probability
out of the two is selected. For our RF algorithm, the
class which gets the majority vote from the forest of
decision trees is the final class. Algorithm 1 details
the work flow of the RF algorithm, which includes
feature extraction, training and prediction.
5 RESULTS
Understanding the Testing Method: We now dis-
cuss the results of our system using 10-Fold Cross
Validation as our testing method. The idea of 10-fold
cross validation is to divide an entire dataset into 10
subsets, and evaluate them 10 times. Each time, nine
subsets are used to train, or build a model, and one
is used to test, or validate the built model. Finally,
the average error across all 10 trails is calculated for
reporting.
Metrics: Precision, Recall, F-Measure and Confu-
sion Matrix are the metrics used to test our system.
Based on classification of True Positives (T P), False
Positives (FP) and False Negatives (FN), we have
Precision =
T P
T P + FP
, (6)
Recall =
T P
T P + FN
. (7)
We then define the F-Measure, a metric that balances
Precision and Recall, as
F − Measure = 2 ×
Precision × Recall
Precision + Recall
. (8)
On Detecting Chronic Obstructive Pulmonary Disease (COPD) Cough using Audio Signals Recorded from Smart-Phones
333
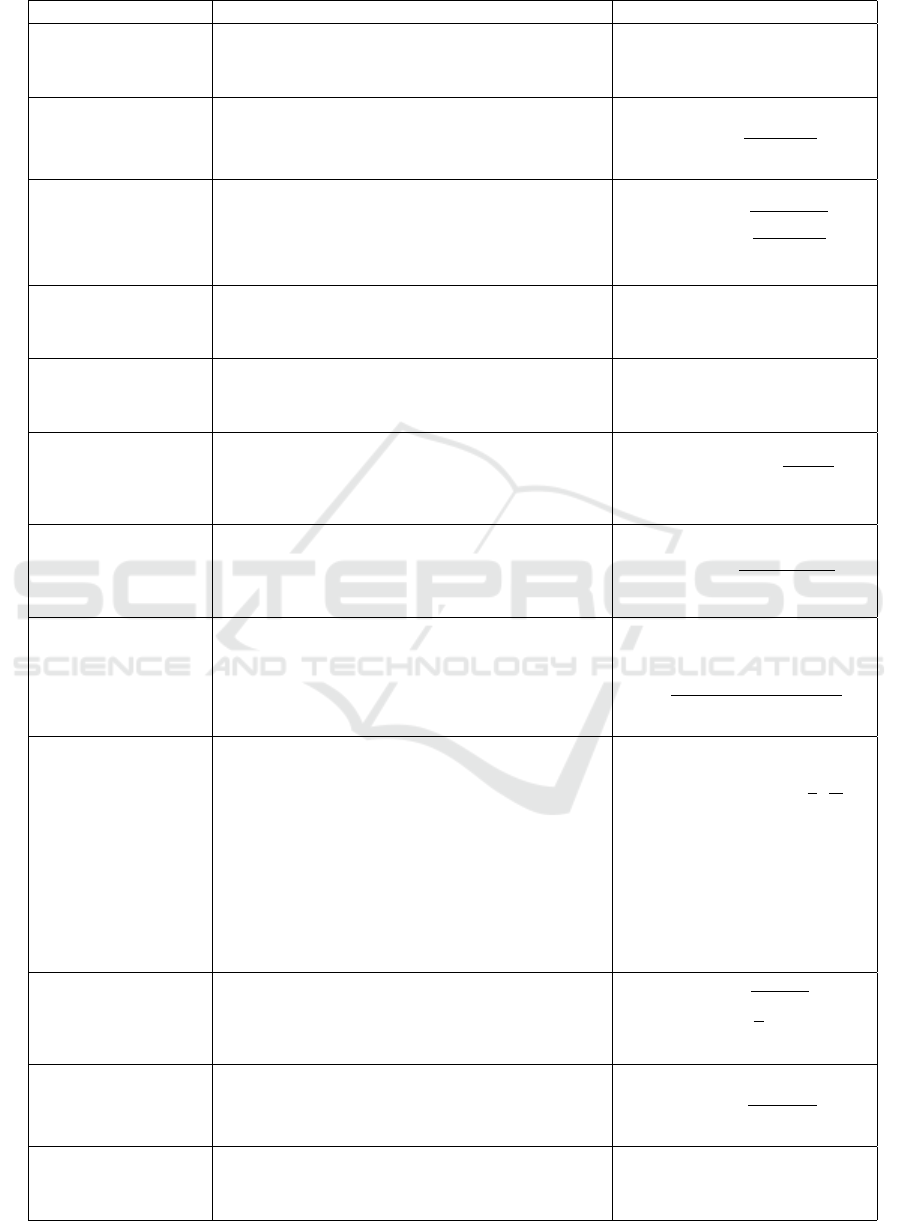
Table 2: Selected Features Extracted From Cough Samples.
Feature Description Equation
Index Maximum
(IM)
Calculates the index where the maximum fast
fourier transform (FFT) value can be found in
each window.
im = max| f f t(x − ¯x)|
Variance (VAR) Calculates variance for time series signal of each
window.
var(x) =
∑
(x − ¯x)
2
L
Standard Deviation
(STD)
Calculates standard deviation for time series sig-
nal of each window.
std(x) =
r
∑
(x − ¯x)
2
L
Maximum Value
(MX)
Calculates the largest component for the time se-
ries signal of each window using, MATLAB’s max
function.
mx = max(x)
Entropy (ENT) Calculates the entropy for the time series signal of
each window. See Equation 2
Total Power (TP) Calculates the total power of signal in frequency
domain of each window.
t p =
∑
f f t(x) ∗ f f t(x)
Sound Pressure
Level (SPL)
Calculates sound pressure level of each window
measured in decibel (dB).
spl = 20log
10
x
2.0 ∗ 10
−5
Pa
dB
Zero Crossing Rate
(ZCR)
Counts the number of times that the sign of the
signals amplitude changes in the time domain for
each window.
zcr( f ) =
L
∑
i=2
|sgn(S
i
) − sgn(S
i
− 1)|
2(L − 1)
Mel-Frequency Cep-
stral Coefficients
(MFCC)
Evaluates cough audio performing the following
steps: 1. Frame Blocking, 2. Windowing, 3. FFT,
4. Mel-frequency Wrapping, 5. Cepstrum, which
produces mel cepstrum coefficients (Hasan et al.,
2004). 4 out of the 13 mel cepstrum coefficients
were selected features for our algorithm.
C =
K
∑
k=1
(logS
k
)[x(k −
1
2
)
π
K
]
, where
C = mean o f input value
x = 1, 2, ...K
K = 44100
Root Mean Square
(RMS)
In cough samples, the signal value (amplitude) of
each window is squared, averaged over a period
of time, then the square root of the result is calcu-
lated.
rms =
s
1
L
L
∑
i=1
x
2
i
Energy (E) Calculates energy of signal in frequency domain
of each window.
e(x) =
∑
| f f t(x)
2
|
f f t(x)
Minimum Value
(MN)
Calculates the smallest component for the time se-
ries signal of each window, using MATLAB’s min
function.
mn = min(x)
HEALTHINF 2018 - 11th International Conference on Health Informatics
334

Algorithm 1: RF-based Algorithm to differentiate between
COPD and Controls cough patterns.
Cough dataset = S, Cough Training dataset = S
T R
,
Cough Testing dataset= S
T E
, Extracted Features from
Cough Training dataset = F
T R
, Extracted Features
from Cough Testing dataset = F
T E
, Classified Disease
from Coughs = e, Probability that class variable z ∈ e
= P (e
|
z), Number of Decision Trees used during Ran-
dom Forests = J.
Step 1 Extraction:
1. Features F
T R
and F
T E
are extracted from raw
dataset S, which consists of S
T R
and S
T E
Step 2 Dimensionality Reduction:
1. Using Information Gain Equations 1 and 2, Fea-
tures F
T DR
and F
T DE
are selected from Features
F
T R
and F
T E
.
Step 3 Training:
Input: Training feature dataset F
T DR
Output: Random Forests model to differentiate be-
tween COPD and Controls cough patterns
1. Select sample size from training dataset F
T DR
2. Grow decision tree R by execution of these rules:
(a) Select G random features from F
T DR
features
(b) Choose best features (based on rank order) and
split features, to be build decision tree, using
Information Gain Equations 1 and 2
(c) Split nodes until all subsets are pure
(d) Grow decision tree to maximum size
(e) Repeat these steps when constructing further
decision trees (we constructed 100 decision
trees for our algorithm)
Step 4 Prediction:
Input: Test F
T DE
and trained RF model from previ-
ous step (Step 2)
Output: Final Disease prediction e
1. Select the testing feature set F
T DE
, which includes
same features used for training the model.
2. Predict classification e based on cough samples
using the following equations:
for each R in Forest do
P(e
|
F) =
1
J
J
∑
i=1
P(e
|
F
T DE
, R
i
)
end for
e = argmax
i∈{1,2}
P(e
i
|
F
T DE
)
,
where e
i
classified as either (1) COPD or
(2) CONT ROLS
Table 3: Definition of Terms used in Table 2.
Term Definition
x Number of samples = 44100
¯x Mean of x
f ft discrete Fourier Transform of (x) using
fast Fourier Transform algorithm
L Length of samples in cough recordings
f A frame consisting of x samples
sgn Signal function returning 1 for positive
arguments, 0 for zero, and -1 for nega-
tive (Sun et al., 2015)
S
i
Sign of the signals amplitude
S
k
Mel cepstrum coefficients
Table 4: Comparing Performance of Different Machine
Learning Algorithms.
Algorithm Accuracy
Random Forests 85.4%
Naive Bayes 81.82%
Logistic Regression 76.36%
One R 52.73%
Finally, we also present the Confusion Matrix,
which is a tabular representation of the performance
of an algorithm. In our case, it presents the degree of
our algorithm to correctly and incorrectly identifying
instances of both classes.
Results and Interpretations: Our analysis reveals
that our system can differentiate between COPD
cough and otherwise with high accuracy. The average
Recall was 85.5% and the Precision was 85.6%. The
average F-Measure was 85.4% and the overall Accu-
racy was 85.4%. These results are depicted in Fig-
ure 3. The Confusion Matrix, also shown in Figure 3,
shows that 73 out of 82 COPD (89.02%) and 68 out of
83 Controls (81.92%) seconds of the cough samples
were correctly classified.
Despite a certain degree of confusion in the per-
formance of our system, we are confident in our over-
all results. First off, the results with a relatively
smaller number of cough samples are still good. We
plan to improve our system in three ways. First, we
can certainly include many more cough samples from
many more subjects to enable better learning and fur-
ther improve accuracy. Secondly, we can include
certain demographics, behavioral, and medical infor-
mation of subjects like age, smoking history, other
chronic conditions are more as features for classify-
ing. With more orthogonal (i.e., non audio) features,
we expect learning and accuracy to improve. Also, we
believe that while our system certainly will recognize
more intense COPD coughs, it could possibly make
mistakes in classifying mild COPD cough as a non
On Detecting Chronic Obstructive Pulmonary Disease (COPD) Cough using Audio Signals Recorded from Smart-Phones
335
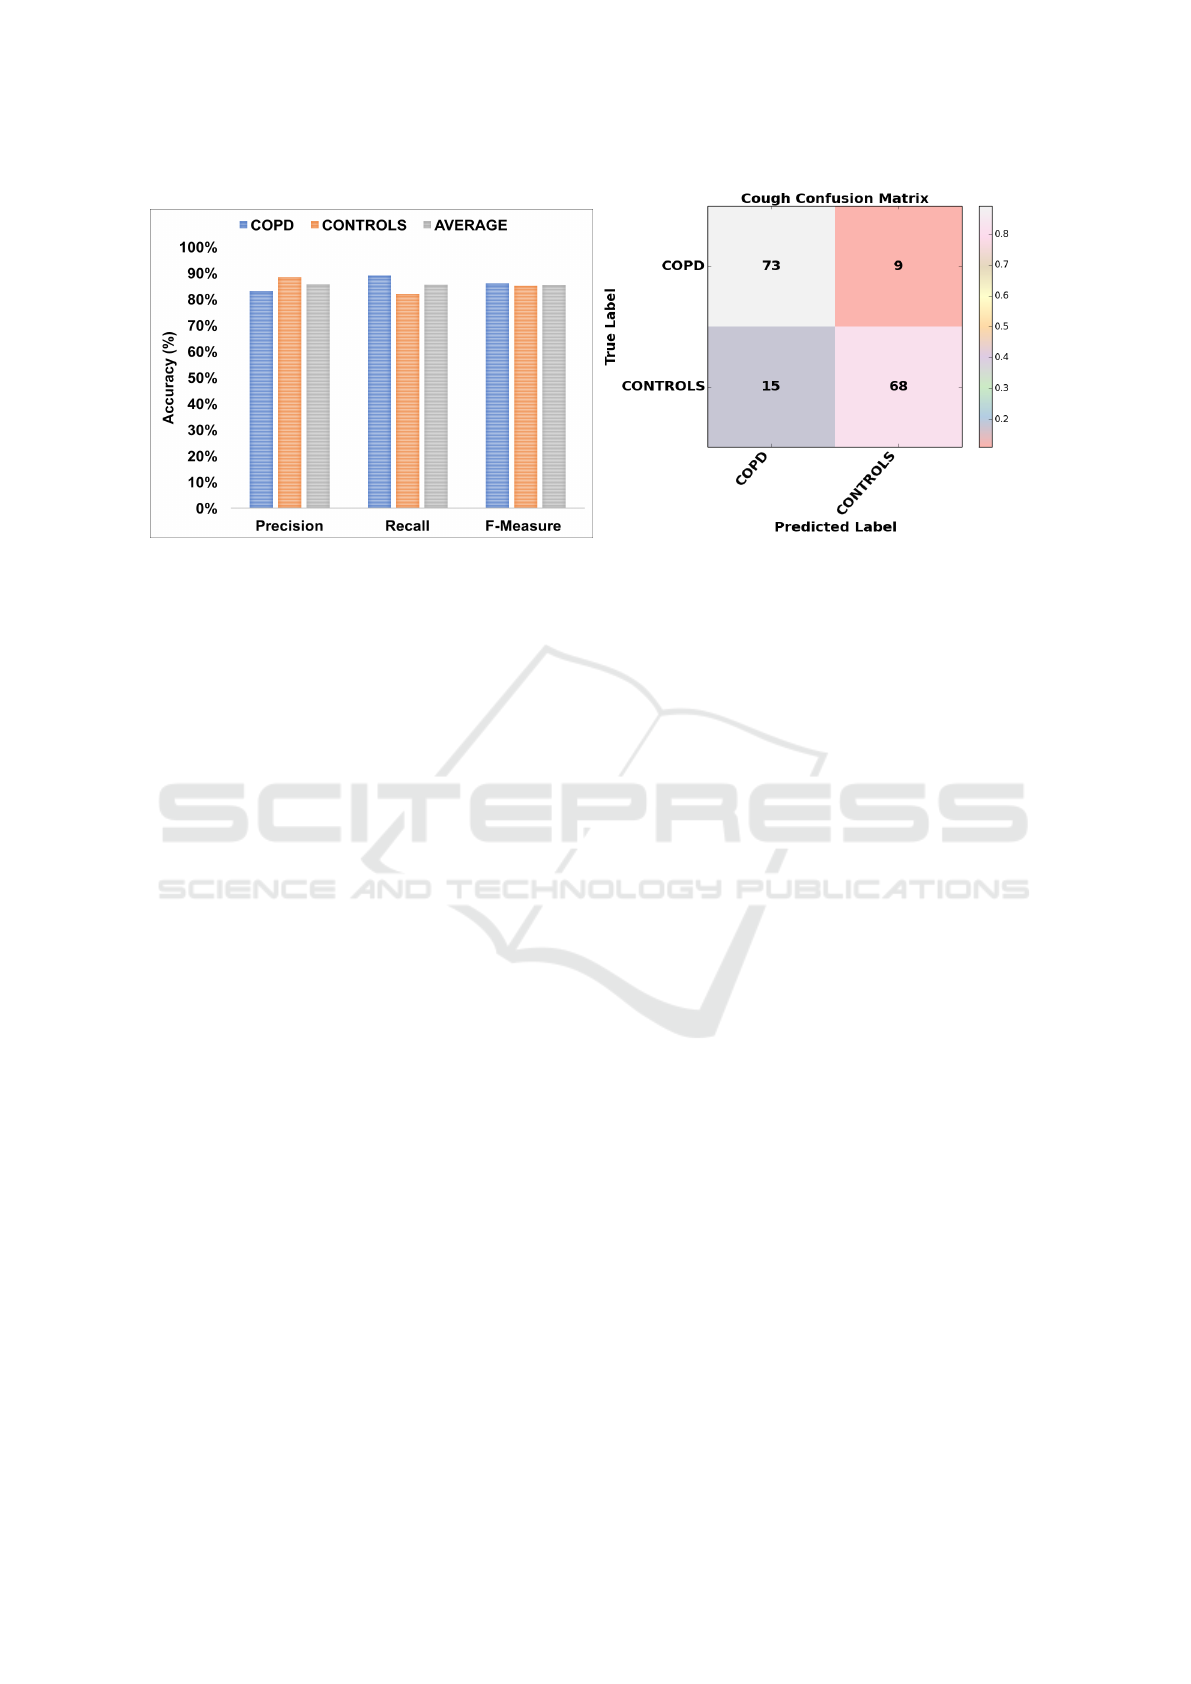
Figure 3: Precision, Recall and F-Measure evaluation using 10-Fold Cross Validation (left) and the Confusion Matrix (right).
COPD cough. To circumvent this issue, we are plan-
ning for algorithms design that will classify COPD
cough itself as severe, medium or mild. With more
patients, this will also be feasible. With learning in
this manner, accuracy of COPD detection will defi-
nitely improve. Finally, for comparison purposes, we
show in Table 4, our results from implementing dif-
ferent machine learning algorithms for classification
using the features extracted, and found that Random
Forests performs the best, for the same reasons dis-
cussed earlier in Section 1.1.
Complexity of Execution: Our evaluation procedure
using Random Forests classification algorithm took
a mere milliseconds to predict COPD or Controls
cough. The classification and testing were executed
on a MacBook Pro with an Intel Core i7 Processor,
2.5 GHz with 16 GB RAM configuration. The speed
makes our system practical for in-home usage and
also the feasibility of implementing the entire system
on a smart-phone as an application, which is our cur-
rent work.
6 CLINICAL APPLICATION
We now present important clinical perspectives of our
proposed system.
According to new estimates by WHO, COPD is
predicted to become the third leading cause of death
globally by 2030 (WHO, 2016). Although death rates
for COPD have declined in the United States, the
prevalence of COPD varies considerably by state in-
dicating the need for novel patient-centered symptom
monitoring and education to combat the rising preva-
lence (Zhang X, 2014). Monitoring symptoms related
to COPD can be a difficult endeavor for patients living
with this disease. The GOLD 2017 strategy (GOLD,
2017) classifies persons with COPD into four groups
based on the severity of disease, as assessed by the
degree of airflow restriction, a patient symptom score,
and the number of exacerbations in one year. There-
fore, we propose to use the COPD classification using
patient symptom score to help patients track COPD
symptoms such as coughing and shortness of breath
using the system proposed in this paper, which we
will encode as an easy to use smart-phone applica-
tion. The symptom score will be assessed by the fre-
quency and intensity of cough and shortness of breath
(Dyspnea). GOLD recommends the use of the COPD
Assessment Test (CAT) or the modified Medical Re-
search Council Dyspnea Scale. We propose to use the
modified Medical Research Council Dyspnea Scale
(Fletcher et al., 1959), shown in Table 5, in combi-
nation with our proposed system for cough analysis
and prediction. Persons with mild or moderate air-
flow restriction will be assigned to groups A or B,
whereas those with severe or very severe airflow re-
striction are assigned to groups C or D. Based on the
data on symptom score, our proposed mobile applica-
tion will be designed to give feedback on use of in-
halers for relief. The app will be further expanded to
enable oxygen saturation level and peak flow monitor-
ing from wearables and integration, offer reminders to
take medication, keeping step count for six-minutes
and motivate to exercise. The application will provide
health education components such as medication, nu-
trition, exercise, and advice on coping with emotions
that affect individuals health overtime. These are the
proposed future works based on our contributions in
this paper.
HEALTHINF 2018 - 11th International Conference on Health Informatics
336

Table 5: Modified Medical Research Council Dyspnea
Scale Score.
Description of breathlessness Score Group
I get breathless only with
strenuous exercise.
0 A
I get short of breath when
hurrying on level ground or
walking up a slight hill.
1 A or B
On level ground, I walk
slower than other people my
age because of breathless-
ness, or I have to stop for
breath when walking at my
own pace.
2 B
I stop for breath after walk-
ing about 100 yards or af-
ter a few minutes on level
ground.
3 C
I am too breathless to leave
the house, or I am breathless
when getting dressed.
4 D
7 CONCLUSIONS
In this paper, we presented a smart-phone based sys-
tem to record cough, and then detect if the cough pat-
terns are indicative of COPD. Our proposed system
involves an application for recording cough, remov-
ing noise, an information gain approach for feature
selection, followed by a Random Forests based algo-
rithm for classification. We presented our results that
demonstrated high accuracy with good Precision, Re-
call and F-measure. We presented practical ideas to
further improve accuracy of classification of our algo-
rithm. Towards the end, we presented important clin-
ical applications of our proposed system for compre-
hensive in-home COPD monitoring by patients them-
selves.
ACKNOWLEDGEMENTS
This work was supported in part by the US National
Science Foundation under grants CNS 1205695, IIS
1559588 and CNS 1718071. Any opinions, thoughts
and findings are those of the authors and do not re-
flect views of the funding agency. The work was also
supported by The Florida-Georgia Louis Stokes Al-
liance for Minority Participation (FGLSAMP) Award
HRD #1612347. Furthermore, we thank the patients
and volunteers for providing cough sample data.
REFERENCES
Amalakuhan, B., Kiljanek, L., Parvathaneni, A., Hester, M.,
Cheriyath, P., and Fischman, D. (2012). A prediction
model for copd readmissions: catching up, catching
our breath, and improving a national problem. Journal
of Community Hospital Internal Medicine Perspec-
tives, 2(1).
Berkel, J. V., Dallinga, J., Mller, G., Godschalk, R., Moo-
nen, E., Wouters, E., and Schooten, F. V. (2010). A
profile of volatile organic compounds in breath dis-
criminates copd patients from controls. Respiratory
Medicine, 104(4):557 – 563.
Breiman, L. (2001). Random forests. Machine learning.
CDC (2016). Chronic obstructive pulmonary disease
(COPD). Center for Disease Control and Prevention
(CDC).
Cheffena, M. (2016). Fall detection using smartphone au-
dio features. IEEE Journal of Biomedical and Health
Informatics, 20(4):1073–1080.
Fletcher, C. M., Elmes, P. C., Fairbairn, A. S., and Wood,
C. H. (1959). Significance of respiratory symptoms
and the diagnosis of chronic bronchitis in a working
population. BMJ, 2(5147):257–266.
GOLD (2017). Global strategy for the diagnosis, manage-
ment and prevention of copd.
Hasan, M. R., Jamil, M., Rabbani, M. G., and Rahman,
M. S. (2004). Speaker identification using mel fre-
quency cepstral coefficients. variations, 1(4).
Lee, C. and Lee, G. G. (2006). Information gain
and divergence-based feature selection for machine
learning-based text categorization. Information pro-
cessing & management, 42(1):155–165.
Patel, S., Mancinelli, C., Healey, J., Moy, M., and Bonato,
P. (2009). Using wearable sensors to monitor physical
activities of patients with copd: A comparison of clas-
sifier performance. In 2009 Sixth International Work-
shop on Wearable and Implantable Body Sensor Net-
works, pages 234–239.
Phillips, C. O., Syed, Y., Parthalin, N. M., Zwiggelaar, R.,
Claypole, T. C., and Lewis, K. E. (2012). Machine
learning methods on exhaled volatile organic com-
pounds for distinguishing copd patients from healthy
controls. Journal of Breath Research, 6(3):036003.
Pramono, R. X. A., Imtiaz, S. A., and Rodriguez-Villegas,
E. (2016). A cough-based algorithm for automatic di-
agnosis of pertussis. PLOS ONE, 11(9):1–20.
Sun, X., Lu, Z., Hu, W., and Cao, G. (2015). Symdetector:
Detecting sound-related respiratory symptoms using
smartphones. In Proceedings of the 2015 ACM Inter-
national Joint Conference on Pervasive and Ubiqui-
tous Computing, UbiComp ’15, pages 97–108, New
York, NY, USA. ACM.
WHO (2016). Chronic obstructive pulmonary disease
(COPD).
Zhang X, Holt JB, L. H. e. a. (2014). Multilevel re-
gression and poststratification for small area estima-
tion of population health outcomes: a case study
of chronic obstructive pulmonary disease prevalence
using BRFSS. American Journal of Epidemiology,
179(8):1025–1033.
On Detecting Chronic Obstructive Pulmonary Disease (COPD) Cough using Audio Signals Recorded from Smart-Phones
337

APPENDIX
Included in this section is a list of all audio based fea-
tures initially extracted from cough samples, prior to
feature selection. These features include: Mean, Me-
dian, Maximum Amplitude, Index Maximum (Ampli-
tude), Variance, Standard Deviation, Minimum Value,
Maximum Value, Entropy, Total Power, Sound Pres-
sure Level, Spectrum Flatness, Zero Crossing Rate,
Energy, Root Mean Square, Spectral RollOff, Short
Time Energy, and 13 mel cepstrum coefficients com-
puted by the Mel-Frequency Cepstral Coefficients
(MFCC).
HEALTHINF 2018 - 11th International Conference on Health Informatics
338
