
A New Approach to Gait Variability Quantification using Cyclograms
Slavka Viteckova
1
, Patrik Kutilek
1
, Radim Krupicka
1
, Zoltan Szabo
1
, Martina Hoskovcova
2
and
Evzen Ruzicka
2
1
Faculty of Biomedical Engineering, Czech Technical University in Prague, Kladno, Czech Republic
2
Department of Neurology and Centre of Clinical Neuroscience, First Faculty of Medicine and General University Hospital
in Prague, Charles University in Prague, Prague, Czech Republic
Keywords:
Gait Variability, Cyclogram, Cyclic Movement Analysis.
Abstract:
Human gait is cyclic movement and its properties are not constant. Gait variability is widely assessed by
fluctuation in spatio-temporal parameters. Since this method operate on a single parameter of the gait cycle,
the cycle signal in its entirety does not affect the result. The objective of this work is to present new gait
variability assessment method. In order to quantify the variability of entire gait cycle, we have proposed and
tested the method based on synchronized cyclograms. The novel approach showed the ability to assess gait
variability. The method is not restricted to gait variability assessment and would be beneficial in different areas
of cyclic movement variability analysis.
1 INTRODUCTION
The properties of movement are not constant when
one moves repeatedly. There are slight alterations in
each individual cycle of movement. Fluctuation in
gait parameters from one stride to the next is referred
as intra-individual gait variability. Fluctuation can be
seen even when there are no environmental or exter-
nal perturbations (Hausdorff, 2005).
The alternation of gait variability shows gait that
is influenced by disease (e.g. Parkinson’s disease, de-
mentia, multiple sclerosis) (Blin et al., 1990; Jamour
et al., 2012; Kaipust et al., 2012) or healthy ageing
(Grabiner et al., 2001). Increased gait variability is re-
lated to changes in mobility, higher risk of falls (Brach
et al., 2005; Hoskovcov
´
a et al., 2015) and subtle alter-
ations in underlying physiology (e.g. cardiovascular
changes, mental health) (Hausdorff et al., 1994; Haus-
dorff et al., 2003). Evidence indicates that gait vari-
ability may serve as a quantifiable feature of walking
function.
Usually, standard deviation and coefficient of vari-
ation of kinematic or spatio-temporal parameters of
stride are used to assess gait variability (Blin et al.,
1990; Hausdorff et al., 1994; Hausdorff et al., 2003;
Grabiner et al., 2001; Brach et al., 2005). Nonlin-
ear methods, e.g. detrended fluctuation analysis and
approximate entropy, have also been used to quantify
gait variability (Kaipust et al., 2012). The most com-
monly employed parameters are stride length, stride
width, and cycle timing (e.g. duration of various
phases) (Blin et al., 1990; Grabiner et al., 2001; Haus-
dorff et al., 2003; Brach et al., 2005; Kaipust et al.,
2012; Hoskovcov
´
a et al., 2015). Since these meth-
ods operate on a single parameter of the gait cycle,
the cycle signal in its entirety does not affect the re-
sult. Next, different methods have different require-
ments on walking distance, e.g. nonlinear methods
work better over long walks. However, these methods
and specified parameters are more difficult to inter-
pret and use in clinical practice.
While spatio-temporal parameters provide infor-
mation about discrete time events (features) variabil-
ity, e.g. the double support phase duration, they do
not describe the complete curves i.e. development of
a feature. For example, curves may have similar peak
values indicating low variablity but different wave-
forms. Therefore, we present an approach to gait vari-
ability quantification that enables the evaluation and
comparison of entire stride signals. This comparison
is carried out by the continuous symmetry method,
namely the method of cyclograms (also called cy-
clokinograms) (Goswami, 2003). The concept of cy-
clograms, although known to the biomechanics com-
munity, has not been mentioned as a tool for evaluat-
ing gait variability. The first mention of a cyclogram
(Grieve, 1968) argued that a cyclic process such as
walking is better understood if studied with a cyclic
Viteckova, S., Kutilek, P., Krupicka, R., Szabo, Z., Hoskovcova, M. and Ruzicka, E.
A New Approach to Gait Variability Quantification using Cyclograms.
DOI: 10.5220/0006546601270132
In Proceedings of the 11th International Joint Conference on Biomedical Engineering Systems and Technologies (BIOSTEC 2018) - Volume 4: BIOSIGNALS, pages 127-132
ISBN: 978-989-758-279-0
Copyright © 2018 by SCITEPRESS – Science and Technology Publications, Lda. All rights reserved
127

plot. The method of cyclograms is usually used, but
not limited, to symmetry (similarity) assessment of
contralateral limbs signals. Our approach is to use
the method of cyclograms to assess gait variability via
inter-cycle similarity. Intra-individual gait variability
is assessed by the comparison of entire consecutive
stride signals to each other. It means the similarity
of entire stride signals (not only one parameter of the
stride) is assessed.
In our case, we will use cyclograms for evaluating
gyroscope data, i.e. angular rate of lower limb move-
ments during gait. Cyclograms in conjunction with
gyroscope data has not been used before for evaluat-
ing gait variability. This new application of gyroscope
data and cyclograms can provide new clinical use in
the diagnosis of patients.
2 METHODS
2.1 Participants
In the study we included 34 Parkinson disease (PD)
patients (24 males, 11 females), mean age 67.2 years
(SD 7.9), with mild to moderate PD. The control
group included 21 volunteers (13 males, 8 females),
mean age 65.5 years (SD 8.4), with no history of neu-
ropsychiatric disorders. All PD patients were eval-
uated in OFF and ON medication states within the
same day. The first examination in clinically defined
OFF state was followed by an examination in the ON
state after a dose of levodopa equivalent to 150 % of
their usual morning dose. The study was approved by
the Ethics Committee of the General University Hos-
pital in Prague, Czech Republic, and therefore per-
formed in accordance with the ethical standards es-
tablished in the 1964 Declaration of Helsinki.
2.2 Data Acquisition
Xbus Master (Xsens Technologies B.V.), a
lightweight (330g) portable device using motion
tracking units (MTx) for orientation and acceleration
measurement of body segments, was used for the
measurement of segment movements. The MTx unit
with an embedded accelerometer and gyroscope is
an accurate inertial measurement unit measuring
drift-free 3-D orientation and 3-D acceleration. Kine-
matic data was recorded from 3 gyro-accelerometers
with a data sampling rate of 100 Hz. The gyro-
accelerometer units were symmetrically attached
on the lateral shank of each lower leg, 4 cm above
the ankle joint; and the chest, 2 cm below the
sternal notch. They were calibrated according to
manufacturer instructions.
All subjects accomplished an extended Timed Up
& Go Test (ETUG) (Wall et al., 2000). Each subject
was observed and measured while he/she rose from
a chair during the ETUG, walked 7 meters, turned,
walked back, and sat down again. Two repeated col-
lections of ETUG were recorded for each subject (i.e.
patients and healthy subjects). One of two ETUG
trial’s accomplishments was randomly selected and
processed.
The MTx unit of the chest was utilized in iden-
tification subcomponents of ETUG (see subsection
Method of Data Processing). Two MTx units, lower
leg units, were used to process all three angular rate
signals in the particular axes. Besides, we evaluated
the magnitude of the angular rate vector
kωk =
q
ω
2
vertical
+ ω
2
horizontal
+ ω
2
sagittal
(1)
This was done in order to eliminate incorrect place-
ment of the measurement units.
2.3 Method of Data Processing
Before further processing, the raw angular rate sig-
nal was low-pass filtered with a zero-phase second-
order Butterworth filter with a 60 Hz corner fre-
quency. The ETUG subcomponents, namely sit-to-
stand, gait, turn, and turn-to-sit, were automatically
identified, see (Salarian et al., 2010). The gait cy-
cles of the steady gait components were determined
by automatic identification (Salarian et al., 2010). All
preprocessing and analysis was carried out offline us-
ing the MatLab (MatLab R2010b, Mathworks, Inc.,
Natick, MA, USA) programming environment.
The GaitRite instrumented walkway (7.0 m long
and 0.6 m wide) and a video camera were used as the
references for the TUG subcomponents and gait char-
acteristics to verify implementation of implemented
algorithms (not published). Previous studies have ver-
ified that the GaitRite is a valid and reliable method
for measuring mean gait characteristics in older adults
(Menz et al., 2004). During each trial, the video cam-
era recorded at 25 frames per second and was used to
determine total step count over the complete trial.
The signals of both lower limbs were used. Gait
cycles signals were time-normalized to the same
length, see Figure 1. The inter-cycle comparisons via
the cyclogram method were done. It can be assumed
that lower variability in gait cycles is demonstrated by
their high level of similarity (low level of dissimilar-
ity). It is possible to use two options to achieve inter-
cycle comparison. The first is to compare each gait
cycle to the consecutive one. In this way we get n − 1
BIOSIGNALS 2018 - 11th International Conference on Bio-inspired Systems and Signal Processing
128
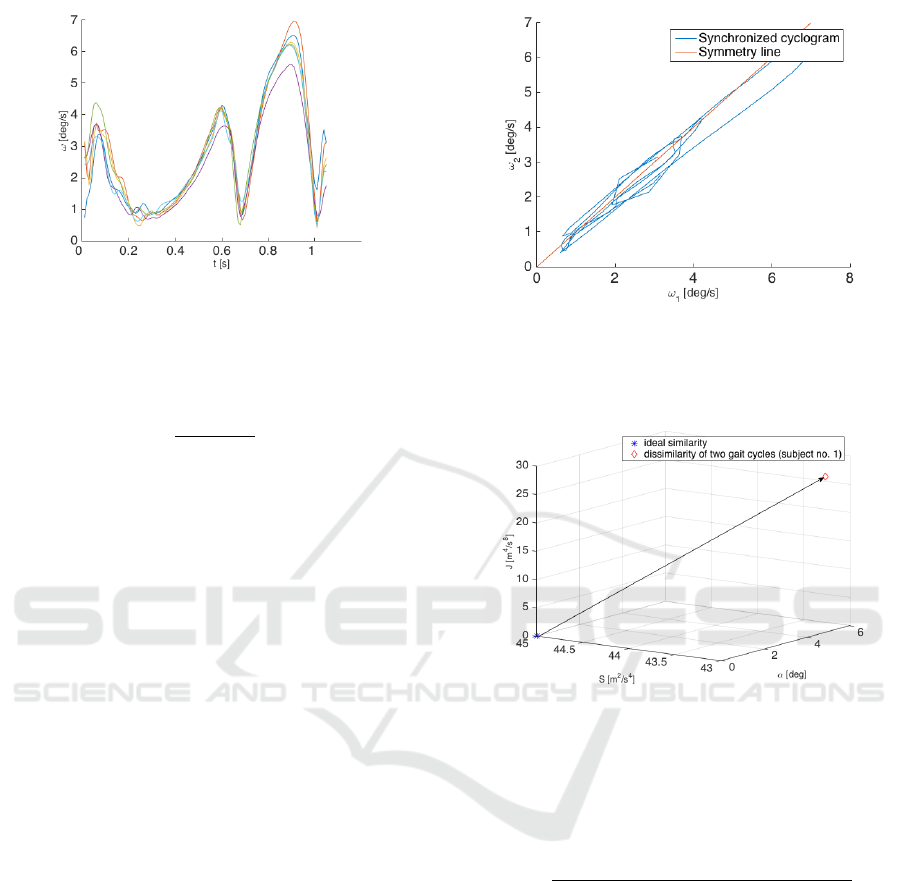
Figure 1: Example of six gait cycles from subject no. 1 (PD
OFF). ω - magnitude of angular rate, t-time.
comparisons from n gait cycles. The second option is
to compare each gait cycle with all other cycles. In
this way we get
n!
2!(n − 2)!
(2)
comparison from n gait cycles. The disadvantage of
the first option is that the same amount of change (e.g.
same level of dissimilarity) between all consecutive
cycles does not adequately reflect the real variability,
e.g. dissimilarity between first and last cycle. Thus,
we employed the second option. Then, the median of
all inter-cycles comparisons was computed. Accord-
ing to the assumption, the higher value of dissimilar-
ity represents the greater variability of gait.
2.4 Method of Cyclograms
The creation of cyclograms is based on plotting two
gait variables vs. each other (Figure 2). In the case
of the traditional use of cycles for gait evaluation, two
time-series (trajectories) should be identical and a cy-
clogram should lie on a symmetry line (Kutilek et al.,
2014). In our case, the two time-series are time-series
of two gait cycles. The symmetry line is a straight
line passing through the origin inclined at an angle of
45 degrees. We can also compute the area within the
cyclogram, and its orientation to evaluate the rate of
asymmetry (Goswami, 2003). We can express math-
ematically the cyclogram deviation from the cyclo-
gram of an ideal symmetric gait to obtain a quantifica-
tion of asymmetry. The triplet of geometric properties
of cyclograms, namely the area within the cyclogram
(S), orientation (α), and moment (J), can be repre-
sented by points in 3D space (Figure 3). The ideal
point for symmetric gait has the coordinates (0, 45,
0), (Goswami, 2003). The point in the 3D space of the
geometric properties of a cyclogram was determined
for each measurement. Then, the asymmetry, A, was
defined as the distance from the measurement point,
Figure 2: Example of the cyclogram of angular rates of two
consecutive gait cycles of subject no. 1. ω
1
-magnitude of
angular rate of the first gait cycle, ω
2
-magnitude of angular
rate of the second gait cycle.
Figure 3: Example of three geometric properties of the cy-
clogram (subject no. 1). The distance from the point of
geometric properties of ideally similar curves (star symbol,
[0, 45, 0]) to the point of current cyclogram properties (di-
amond symbol, [5, 43, 26]) is the quantifier of the curves
dissimilarity.
M, and ideal point I:
A =
q
(S
M
− S
I
)
2
+ (α
M
− α
I
)
2
+ (J
M
− J
I
)
2
(3)
In our case, the asymmetry, A, is the measure of
the dissimilarity of two gait cycles. The higher value
of dissimilarity, the higher variability of gait cycles.
The indicator of gait variability based on cyclogram
characteristics was calculated for the measured move-
ment of the lower limbs of all healthy subjects and PD
patients.
2.5 Statistical Analysis
Statistical analysis was performed to examine
whether gait variability via the method of cyclograms
is able to distinguish a healthy subject from a PD pa-
tient. The exclusion criterion was that all gait cycles
A New Approach to Gait Variability Quantification using Cyclograms
129
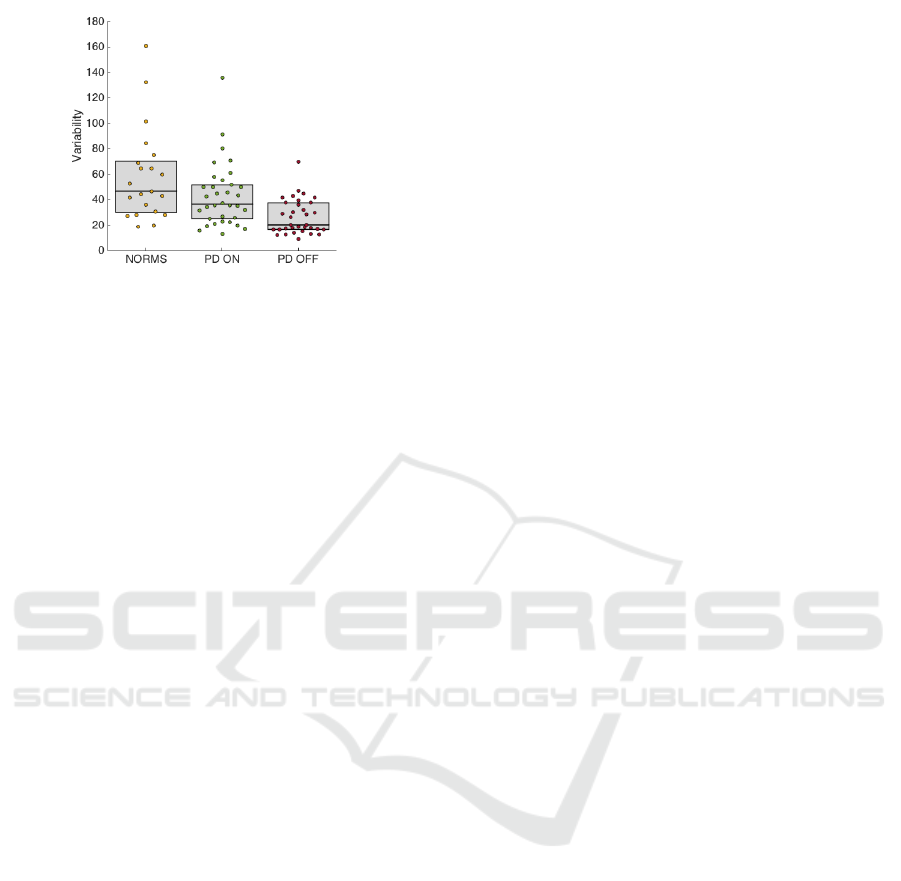
Figure 4: The values of cyclogram-based variability quanti-
fiers for angular rate magnitude.
before turn are detected. Shapiro-Wilk test was used
to verify the normality of parameters in each observed
dataset. The assumption of normal data distribution in
the observed datasets has been rejected (significance
level p = 0.05). Therefore, nonparametric Wilcoxon
signed rank test was used to compare the statisticaly
significant differences in gait variability between PD
patients in the ON and OFF state. Nonparametric
Wilcoxon rank sum test was used to compare PD pa-
tient data to norms data. The significance level was
set to p < 0.05. Statistical analyses and data pro-
cessing were performed using MATLAB sw (MatLab
R2010b, Mathworks, Inc., Natick, MA, USA).
3 RESULTS
The gait variability assessment via method of cyclo-
grams revealed a significant difference between the
control group and PD ON in the variability of the
angular rate about the sagittal-axis (p < 0.01). The
statistically significant difference between the control
group and PD OFF has been proven in the variability
of the angular rate about the sagittal-axis (p < 0.01)
and magnitude (p < 0.01). The variability about the
vertical-axis (p < 0.01) and the magnitude of the an-
gular rate (p < 0.01) delivered a significant difference
between PD ON and PD OFF. The variability about
the horizontal-axis did not exhibit a statistically sig-
nificant difference in any of the evaluated cases. For
detailed statistical evaluation see Table 1. The dis-
tribution of values of the new variability quantifier is
shown in Figure 4.
4 DISCUSSION
We tested and verified a new method of gait variability
assessment that is derived from the geometric prop-
erties of cyclograms. To our knowledge, this is the
first report of the use of symmetry quantification tech-
niques to evaluate stride-to-stride fluctuations.
The results obtained by this novel approach
showed a discriminative ability between evaluated
subjects groups. Hausdorff et al. (Hausdorff et al.,
1998) revealed increased gait variability in PD. Our
results are not inconsistent with his findings. In con-
trast to their work dealing with relative changes in gait
parameter variability, our work focused on absolute
change in gait cycle variability. Normalization can
be included in signal preprocessing to achieve rela-
tive change in gait variability. Moreover, they anal-
ysed the gait cycle timing while our work deals with
rotational properties of gait. Our results confirm that
medication has an effect on gait variability in PD as
was also mentioned in a previous study (Bryant et al.,
2016).
The advantage of our approach to gait variability
assessment is the analysis of an entire gait cycle un-
like the calculation of coefficients, which are mainly
used for quantification of a gait cycle at a specific
time. Thus, this method can be employed on any
gait signal regardless of precisely predefined events,
e.g. double support phase. The other advantage of
this method is the uniform approach to gait variabil-
ity in all movement direction and thus, the possiblity
of comparing the impact of a disease or pathology
on movement in different directions can be applied.
The analysis of variability in various movement di-
rections can reveal new knowledge and clinical inter-
pretations.
Another potential of this method is that it is a gen-
eral approach to signal variability analysis that can be
employed in other areas of cyclic movement analysis,
e.g. finger tapping test, stairs ascending/descending,
stand-to-sit-to-stand tests.
Different methods quantify different aspects of
gait variability and work with various spans of gait
signal length, e.g. number of gait cycles. By intra-
subject signal normalization to the same length when
utilized method of cyclograms the result is unaffected
by gait cycle duration. Next, the selection of an ap-
propriate method for specified research or clinical aim
is crucial in gait variability assessment (Chau et al.,
2005). Therefore, this new approach to gait variability
assessment is not a replacement of existing methods
but is complimentary.
There are limitations to our study. The most im-
portant one is that the sample of the subjects probably
is not representative of the larger population. How-
ever, to verify the ability of the proposed method to
assess gait variability in this preliminary study, a sam-
BIOSIGNALS 2018 - 11th International Conference on Bio-inspired Systems and Signal Processing
130

Table 1: Statistical evaluation of variability via similarity measures. * differences significant at the Holm-Bonferroni-corrected
level of p < 0.05 (for 4 tests performed).
Norms vs PD ON Norms vs PD OFF PD ON vs PD OFF
ω
vertical
0.45 0.26 < 0.01∗
ω
horizontal
0.90 0.33 0.12
ω
sagittal
< 0.01∗ < 0.01∗ 0.05
kωk 0.03 < 0.01∗ < 0.01∗
ple of subjects is sufficient. A second limitation in
this study is the number of measurements made of
each subject. Some patients had stability problems, as
is common in these patients, therefore only a limited
number of instrumented tests could be performed to
ensure that patients remained in a stable motor state.
5 CONCLUSIONS
This paper introduced and tested a new method of
stride-to-stride fluctuation using synchronized cyclo-
grams. The variability indicator is based on similarity
assessment of gait cycles. We can designate that this
method is suitable for the evaluation of gait variabil-
ity in practice. The proposed method is not limited
to gait variability assessment and would be benefi-
cial in different areas of cyclic movement variability
analysis. The quantitative analysis of wave form may
bring new knowledge of the variability with respect to
movement disorders.
ACKNOWLEDGEMENTS
This work was supported by Ministry of Health of the
Czech Republic, AZV Grant no. 16-28119a ”Analy-
sis of movement disorders for the study of extrapyra-
midal diseases mechanism using motion capture cam-
era systems”.
REFERENCES
Blin, O., Ferrandez, A., and Serratrice, G. (1990). Quanti-
tative analysis of gait in parkinson patients: increased
variability of stride length. Journal of the Neurologi-
cal Sciences, 98(1):91 – 97.
Brach, J. S., Berlin, J. E., VanSwearingen, J. M., Newman,
A. B., and Studenski, S. A. (2005). Too much or too
little step width variability is associated with a fall his-
tory in older persons who walk at or near normal gait
speed. Journal of NeuroEngineering and Rehabilita-
tion, 2:21–21.
Bryant, M. S., Rintala, D. H., Hou, J., Collins, R. L., and
Protas, E. J. (2016). Gait variability in parkinson’s
disease: levodopa and walking direction. Acta Neuro-
logica Scandinavica, 134(1):83–86.
Chau, T., Young, S., and Redekop, S. (2005). Manag-
ing variability in the summary and comparison of gait
data. Journal of NeuroEngineering and Rehabilita-
tion, 2:22–22.
Goswami, A. (2003). Kinematics quantification of gait
symmetry based on bilateral cyclograms. In P, M., B,
W., and Dunedin, Y. T., editors, Proceedings of XIX
Cong Int Soc Biomech, pages 34–43.
Grabiner, P. C., Biswas, S. T., and Grabiner, M. D. (2001).
Age-related changes in spatial and temporal gait vari-
ables. Archives of Physical Medicine and Rehabilita-
tion, 82(1):31–35.
Grieve, D. (1968). Gait patterns and the speed of walking.
Biomedical Engineering, 3(3):119–122.
Hausdorff, J. M. (2005). Gait variability: methods, model-
ing and meaning. Journal of NeuroEngineering and
Rehabilitation, 2(1):19.
Hausdorff, J. M., Cudkowicz, M. E., Firtion, R., Wei, J. Y.,
and Goldberger, A. L. (1998). Gait variability and
basal ganglia disorders: Stride-to-stride variations of
gait cycle timing in parkinson’s disease and hunting-
ton’s disease. Movement Disorders, 13(3):428–437.
Hausdorff, J. M., Forman, D. E., Ladin, Z., Goldberger,
A. L., Rigney, D. R., and Wei, J. Y. (1994). Increased
walking variability in elderly persons with congestive
heart failure. Journal of the American Geriatrics So-
ciety, 42(10):1056–1061.
Hausdorff, J. M., Herman, T., Baltadjieva, R., Gurevich, T.,
and Giladi, N. (2003). Balance and gait in older adults
with systemic hypertension *. American Journal of
Cardiology, 91(5):643–645.
Hoskovcov
´
a, M., Du
ˇ
sek, P., Sieger, T., Bro
ˇ
zov
´
a, H.,
Z
´
arubov
´
a, K., Bezd
´
ı
ˇ
cek, O.,
ˇ
Sprdl
´
ık, O., Jech, R.,
ˇ
Stochl, J., Roth, J., and R
˚
u
ˇ
zi
ˇ
cka, E. (2015). Predicting
falls in parkinson disease: What is the value of instru-
mented testing in off medication state? PLOS ONE,
10(10):1–13.
Jamour, M., Becker, C., Synofzik, M., and Maetzler, W.
(2012). Gait changes as an early indicator of de-
mentia. Zeitschrift f
¨
ur Gerontologie und Geriatrie,
45(1):40–44.
Kaipust, J. P., Huisinga, J. M., Filipi, M., and Stergiou, N.
(2012). Gait variability measures reveal differences
between multiple sclerosis patients and healthy con-
trols. Motor Control, 16(2):229–244.
Kutilek, P., Viteckova, S., Svoboda, Z., Socha, V., and
Smrcka, P. (2014). Kinematic quantification of gait
asymmetry based on characteristics of angle-angle di-
agrams. Acta Polytechnica Hungarica, 11(5):25–38.
A New Approach to Gait Variability Quantification using Cyclograms
131

Menz, H. B., Latt, M. D., Tiedemann, A., Kwan, M. M. S.,
and Lord, S. R. (2004). Reliability of the gaitrite
R
walkway system for the quantification of temporo-
spatial parameters of gait in young and older people.
Gait & Posture, 20(1):20 – 25.
Salarian, A., Horak, F. B., Zampieri, C., Carlson-Kuhta, P.,
Nutt, J. G., and Aminian, K. (2010). itug, a sensitive
and reliable measure of mobility. IEEE transactions
on neural systems and rehabilitation engineering : a
publication of the IEEE Engineering in Medicine and
Biology Society, 18(3):303–310.
Wall, J. C., Bell, C., Campbell, S., and Davis, J. (2000).
The timed get-up-and-go test revisited: Measurement
of the component tasks. Journal of rehabilitation re-
search and development, 37(1):109 – 114.
BIOSIGNALS 2018 - 11th International Conference on Bio-inspired Systems and Signal Processing
132
