
Modular Platform for Customer-Side Detection of BGP Redirection
Attacks
Marco Silva, Ant
´
onio Nogueira and Paulo Salvador
Instituto de Telecomunicac¸
˜
oes, DETI, University of Aveiro, Aveiro, Portugal
Keywords:
BGP Attack Detection, Internet-scale Traffic Redirection, BGP Routes Hijacking, At Distance Man-in-the-
Middle Attacks.
Abstract:
Border Gateway Protocol (BGP) enables world-wide Internet connectivity and its inherent non-secure cha-
racteristics, together with the nonexistence of a trustable identity that correlates IP network prefixes with the
Autonomous Systems (AS) allowed to announce them, opens the way to attacks or misconfiguration on a
world-wide scale. Since corporate customers do not have access to the whole routing information used by
Internet Service Providers (ISP), they can not act against these kind of attacks and must only rely on the ISP
to promptly detect and take measures to mitigate them. This paper presents a world-wide distributed probing
platform, with a simple and very low cost implementation, that can be used to detect traffic routing variations.
Upon detection, the corporate customer can locally deploy security policies while notifying its network service
provider(s) and requesting for further actions.
1 INTRODUCTION
Pilosov & Kapela (Pilosov and Kapela, 2008) propo-
sed an exploit of the BGP vulnerabilities to implement
BGP routing redirection attacks. In recent years se-
veral reports (Cowie, 2013; Madory, 2015a; Madory,
2015b) describe evidences of active traffic redirection
attacks.
Several works have been dedicated to the de-
tection and analysis of BGP traffic redirection and
routes hijacking. Zhang et al. (Zhang et al., 2010)
and Yujing et al. (Liu et al., 2013) proposed met-
hodologies to identify and characterize BGP route
changes by periodically analyzing BGP RIBs (Rou-
ting Information Bases), which is very demanding
from a computational point of view. Biersack et al.
(Biersack et al., 2012) presented a survey of visu-
alization methods for BGP monitoring, but they re-
quire an updated, complete and trustable collection of
BGP route announcements, which is quite difficult to
obtain (Roughan et al., 2011). Chang et al. (Chang
et al., 2013) proposes an AS reputation and alert ser-
vice that detects anomalous BGP updates, but it requi-
res a distributed monitoring of BGP announcements.
Such methodologies to detect this type of attacks can
only be deployed by service providers, which have
access to BGP updates and BGP RIBs (Routing In-
formation Bases), and because of that are impossible
to be implemented on customer networks. Customer
network managers are completely impotent to deal
with these threats, since they are not able to detect
attacks by relying only on their local resources and,
even upon detection, they can only request appropri-
ate and prompt actions from their ISP and implement
temporary local security policies.
In order to help managers of customer networks,
we propose a distributed platform to monitor, detect
and take measures in real-time, on the consumer side,
against BGP hijacking attacks. The framework is ba-
sed on the methodology proposed in (Salvador and
Nogueira, 2014). A set of probes spread worldwide
periodically measures the Round-Trip Time (RTT)
and perform trace routes to target hosts/routers loca-
ted in the networks being monitored, and report their
measurements to a central location. By correlating the
obtained measurements, consistent end-to-end RTT
deviations (from past values) in multiple probes to can
be considered as a clear sign of traffic redirection. The
different probes should be located in a set of widely
spread places, since relevant deviations can only be
observed if probes are located relatively far from the
monitored network and/or attack point.
Silva, M., Nogueira, A. and Salvador, P.
Modular Platform for Customer-Side Detection of BGP Redirection Attacks.
DOI: 10.5220/0006543601990206
In Proceedings of the 4th International Conference on Information Systems Security and Privacy (ICISSP 2018), pages 199-206
ISBN: 978-989-758-282-0
Copyright © 2018 by SCITEPRESS – Science and Technology Publications, Lda. All rights reserved
199

2 TECHNOLOGIES
The proposed platform has been implemented using
four main technologies: Python (Python, 1991),
Flask-Python framework (Ronacher, 2010), Mon-
goDB (Inc., 2009) and Docker (Ronacher, 2013).
Python being an interpreted, interactive and object-
oriented programming language as well as portable
(it runs on multiple Unix variants, macOS, Windows
2000 and above) allows for fast development and por-
tability, and as such was the language of choice for
developing this platform and modules associated with
it. Since there is a need to build and deploy web servi-
ces for this platform, and since Python was the chosen
language to do so, Flask-Python framework is used
as the tool to create and deploy them since it is light-
weight and easy to use. MongoDB is a non-relational,
open-source database and it has been chosen due to
the amount of data this platform may store and the
low level of relationships between data. In order for
deployment to be as smooth as possible and not prone
to failure due to different Unix systems configurati-
ons, Docker was chosen to be used as a container.
A container allows this platform to be deployed wit-
hout concerns about dependencies, libraries or other
issues that could arise from different configurations;
by wrapping every needed component in a container,
which takes care of communication with the operative
system’s kernel, one can mitigate the effects of run-
ning the platform on different systems. Docker makes
it so that it’s possible to simply transfer the preconfi-
gured container to the desired machine, and have it up
and running in a matter of minutes.
3 DESIGN & IMPLEMENTATION
3.1 Overview
The system relies on a set of Probes, widely spread
around the globe, and a central unit (Mainframe).
Probes are able to perform multiple monitoring tasks
to a specific destination/target, pre-process data and
relay results to the Mainframe. Routing anomalies are
detected at the Mainframe by comparing/correlating
new data with data that was previously acquired. Fi-
gure 1 depicts the platform elements and relations. A
probe resides in a Virtual Private Server or Cloud Ser-
ver (VPS/CS) with minimum computational require-
ments and consequently low cost. Each probe runs the
Central Probe Module (CPM) which is responsible
to manage all the modular monitor modules running
under that probe supervision, collect and pre-process
data and relaying it to the Mainframe.
Figure 1: Platform elements.
CPM deploys a web-server, using Flask-Python,
to which monitoring modules can be attached. Mul-
tiple monitoring modules can be added and individu-
ally assigned to perform monitoring tasks to speci-
fied targets. The modules can be developed in py-
thon, or in any compatible language other than py-
thon and integrated by means of a python wrapper
(see sub-section 3.4). Currently, the active modules
are RTT Monitor and Traceroute/HopRTT Moni-
tor developed natively in python. The former per-
forms periodic RTT measures to predefined destinati-
ons (network prefixes being monitored) defined at the
Mainframe. The latter performs trace route to the des-
tinations, also defined at the Mainframe, and records
the path hops and respective RTT to each one. Note
that monitoring destinations may be different for dif-
ferent monitoring modules.
The Mainframe deploys a web-service, using
Flask-Python, and a non-relational database (Mon-
goDB). It is responsible for probe initialization, con-
trol, monitoring, data collection as well as data ana-
lysis, alarms, countermeasures and for the graphical
user interface (GUI).
The desired VPS/CS minimum requirements for
the Mainframe are: 8GB RAM, Quadcore 2.4GHz+,
500GB disk space, Linux 64-bit (Ubuntu 16.04+,
CentOS6+, Debian7+), Python 3.X, PIP, MongoDB.
And for the PCM, are: 1GB RAM, Single core
1.4GHz+, 10GB disk space, Linux 64-bit (Ubuntu
16.04+, CentOS6+, Debian7+).
3.2 Control and Communication
The Mainframe performs installation and control
tasks remotely on Probes using Secure Shell (SSH)
and Secure Copy (SCP) for file transfers both to and
from the Probes. For that to be possible, the plat-
form’s users, when setting up a new Probe on the plat-
form, are required to provide a user name with root
privileges and it’s respective password for the new
ICISSP 2018 - 4th International Conference on Information Systems Security and Privacy
200

Figure 2: REST message general format.
Probe.
From the Mainframe, it is possible to setup,
start, restart and stop any given probe that is under
the Mainframe’s control. These actions are car-
ried by using SSH and, as such, require that the
remote server has a user with root privileges that
is known to the Mainframe. On setup, a RSA key
pair is generated on the CPM and it’s public key
transferred to the Mainframe (via SCP), as well as
the Mainframe’s public key is sent to the CPM, set
into the authorized key files for SSH and stored in
a file to be accessed by the Probe when receiving
or sending messages to and from the Mainframe.
The Probes public keys are stored in the Mainframe,
under the ’ProbesRSA’ folder, as ’ProbeID.pub’; e.g.:
’Q5UYY1ZIBZ6KV5H204HDZF8TTSNLNTV7.pub’.
As referenced above, the user must submit a root
privileged user name and password for this setup to
be possible. After the setup is done, the password is
discarded, as to not pose a security risk if it were to
be stored in plain text. During the setup the docker
image containing the CPM code is transferred and
configured in the Probe.
The Mainframe also keeps track of which Probes
are running. In order for that to be possible, all active
Probes send an HTTP POST request to the Mainframe
every 15 seconds. If a Probe fails to communicate
with the Mainframe for over 3 attempts (45 seconds),
the Mainframe will attempt to attempt to restart the
Probe’s services; if it cannot, it’ll check for a backup
Probe that was assigned to the former, if any, and start
it. In both cases, an alert will be issued.
Data is relayed to the respective web-services
using REST with JSON formatted messages, namely,
from monitoring modules to the CPM and from the
CPM to the Mainframe. Figure 2 depicts the con-
tent of the JSON/REST messages. All messages have
a common header which contains a Data field that
transports monitoring modules specific data, inclu-
ding the module’s name.
Figure 3: Normal traffic flow.
Figure 4: Simulated anomalous traffic flow.
REST communications between the CPM and
Mainframe deploy AES encryption and RSA signa-
ture for sensible fields. A new AES key is gene-
rated for each new message from the CPM to the
Mainframe, and that key is used to encrypt every-
thing on the ’Data’ field of the message (Figure 2).
The AES key is then encrypted with the receiver’s
(Mainframe) RSA public key, and it’s finally signed
with the sender’s RSA private key. Using an AES cip-
her provides data security, as it cannot be easily read
by an unauthorized third party and the RSA signature
provides authentication, to verify if the message came
from a valid source.
3.3 Data Gathering & Analysis
Probes gather data by using one or more modules.
Two of the already implemented modules gather the
data depicted in Figure 2. This data is then transfer-
red to the Mainframe and stored in the database to be
used by the analysis modules.
For testing and validation purposes, Python scripts
have been created to configure Probes in order for
them to be able to simulate the results of a BGP re-
direction attacks. The way used to achieve that goal
was to create IPv4 GRE tunnels between groups of
three VPS’s, and respective iptables rules to redirect
traffic from the ’normal’ path, through a middle node
which we’ll call a relay. An example of normal traffic
flow (Figure 3) is:
1. Probe A (Source) sends packet to Probe B (Tar-
get);
2. Probe B receives the packet and sends a response
to Probe A;
3. Probe A receives the response and calculates the
time it took for the packet to complete it’s path
(RTT).
Modular Platform for Customer-Side Detection of BGP Redirection Attacks
201
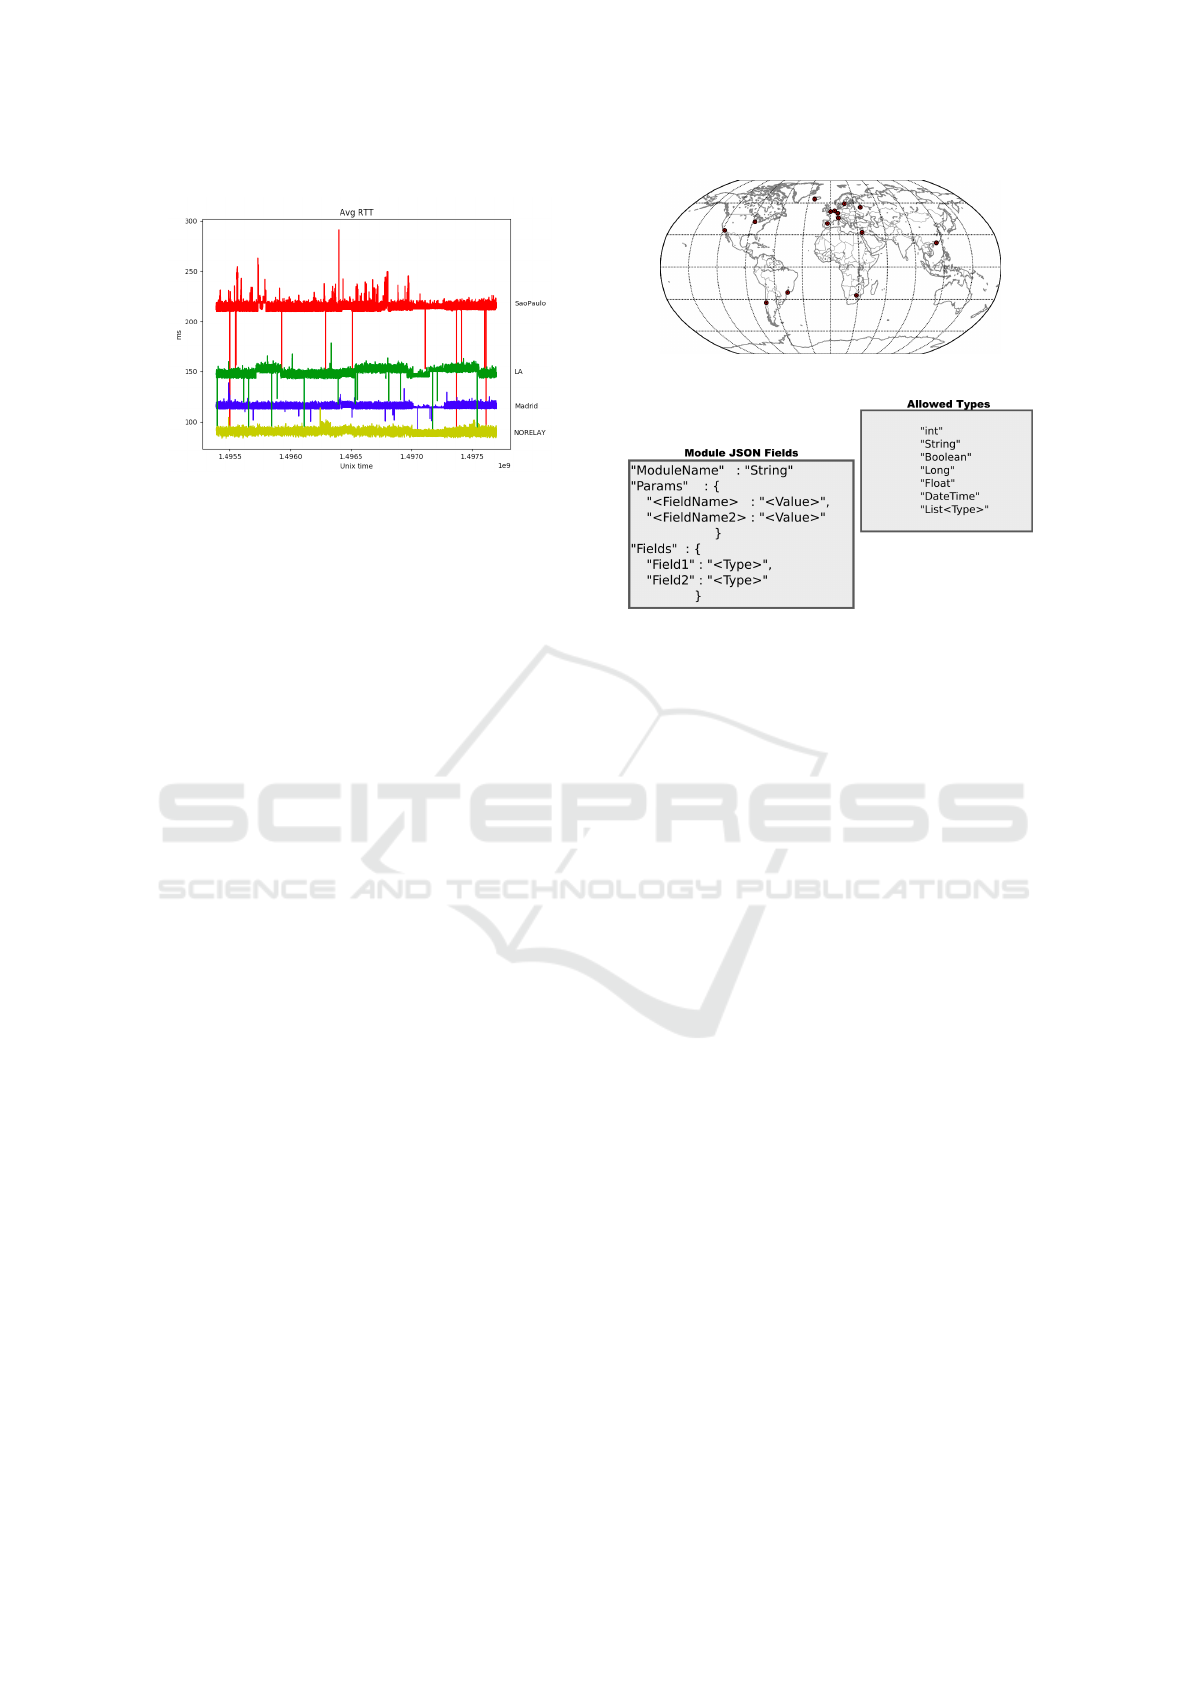
Figure 5: RTT data with and without simulated routing at-
tacks, from Chicago to London.
While a routing redirection attack (Figure 4) is simu-
lated as follows:
1. Probe A (Source) sends packet to Probe B (Tar-
get);
2. Iptables capture the packet on OUTPUT chain and
redirect it to Probe C (Relay);
3. Probe C iptables check the packet on PREROU-
TING chain and redirect it through a tunnel to
Probe B;
4. Probe B receives the packet and sends the re-
sponse to Probe A;
5. Probe A receives the response and calculates the
time it took for the packet to complete it’s path
(RTT).
By doing this routing redirect depending on the Tar-
get:Port combination, one can, simultaneously, obtain
both the ’normal’ path and the ’attack’ path RTT.
A sample of the obtained RTT results can be visu-
alized in Figure 5, which shows the data collection of
RTT values from Chicago to London with three dif-
ferent relays: S
˜
ao Paulo, Madrid, and Los Angeles).
The ’No Relay’ is the ’normal’ path.
The abnormal spikes on all samples may be due to
intermittent and instantaneous issues on the VPS/CS
or the internal network itself. This data can then be
used to test and validate the algorithms used to detect
anomalies. Currently, the algorithm being used con-
templates only the RTT values from Probe X to Target
Y, as depicted in (Salvador and Nogueira, 2014).
Figure 6 depicts a map with the location of the
currently active 20 probes; in Europe (including
Moscow), North and South America, South Africa,
Israel and China. Note that some geographical locati-
ons have more than one active probe, for CPM redun-
dancy.
Figure 6: Currently active probes.
Figure 7: New module insert JSON file.
3.4 Modularity
The platform was designed with modularity in mind,
for both the CPM and the Mainframe. This platform
allows for two distinct types of modules: data gather-
ing and data analysis. Data gathering modules are to
be used in the CPM. Modules written in python or
with a python wrapper are supported. All modules
that wish to have the data sent to the Mainframe must
obey the following rules:
• Load the configurations, if any, from a file named
’moduleName.json’.
• Send data, JSON formatted, via HTTP POST
request to ’localhost:port/receiveData’ with the
mandatory fields depicted in Figure 2.
• Contain a time stamp on each message.
When a new module for CPM is added in the
Mainframe, a new entry will be added to the database,
containing the path to the Python file in question, the
execution parameters and the output fields (data) as
well as the module’s name. When doing so, a new
Python class and method will be created in order to
be able to represent the data and insert it in the data-
base. Because Python does not allow imports in run-
time, a restart will be required before the new module
can be deployed. In order for a module to be validated
and accepted by the mainframe, a JSON file must be
uploaded, together with the Python file, upon module
insertion. The JSON file has the required fields stated
in Figure 7 and those are mandatory. Any attempt to
upload a new module that does not respect the manda-
tory fields will be rejected and an error message dis-
played.
ICISSP 2018 - 4th International Conference on Information Systems Security and Privacy
202
Time stamp 1 Field 1 Time stamp 2 Field 2 Time stamp 3 Field 3
1501155649 121 1501155621 5 1501155630 12.1
1501155679 132 1501155661 6 1501155640 14.2
1501155709 98 1501155701 5 1501155650 9.8
... ... ... ... ... ...
Figure 8: Input data file sample for analysis modules.
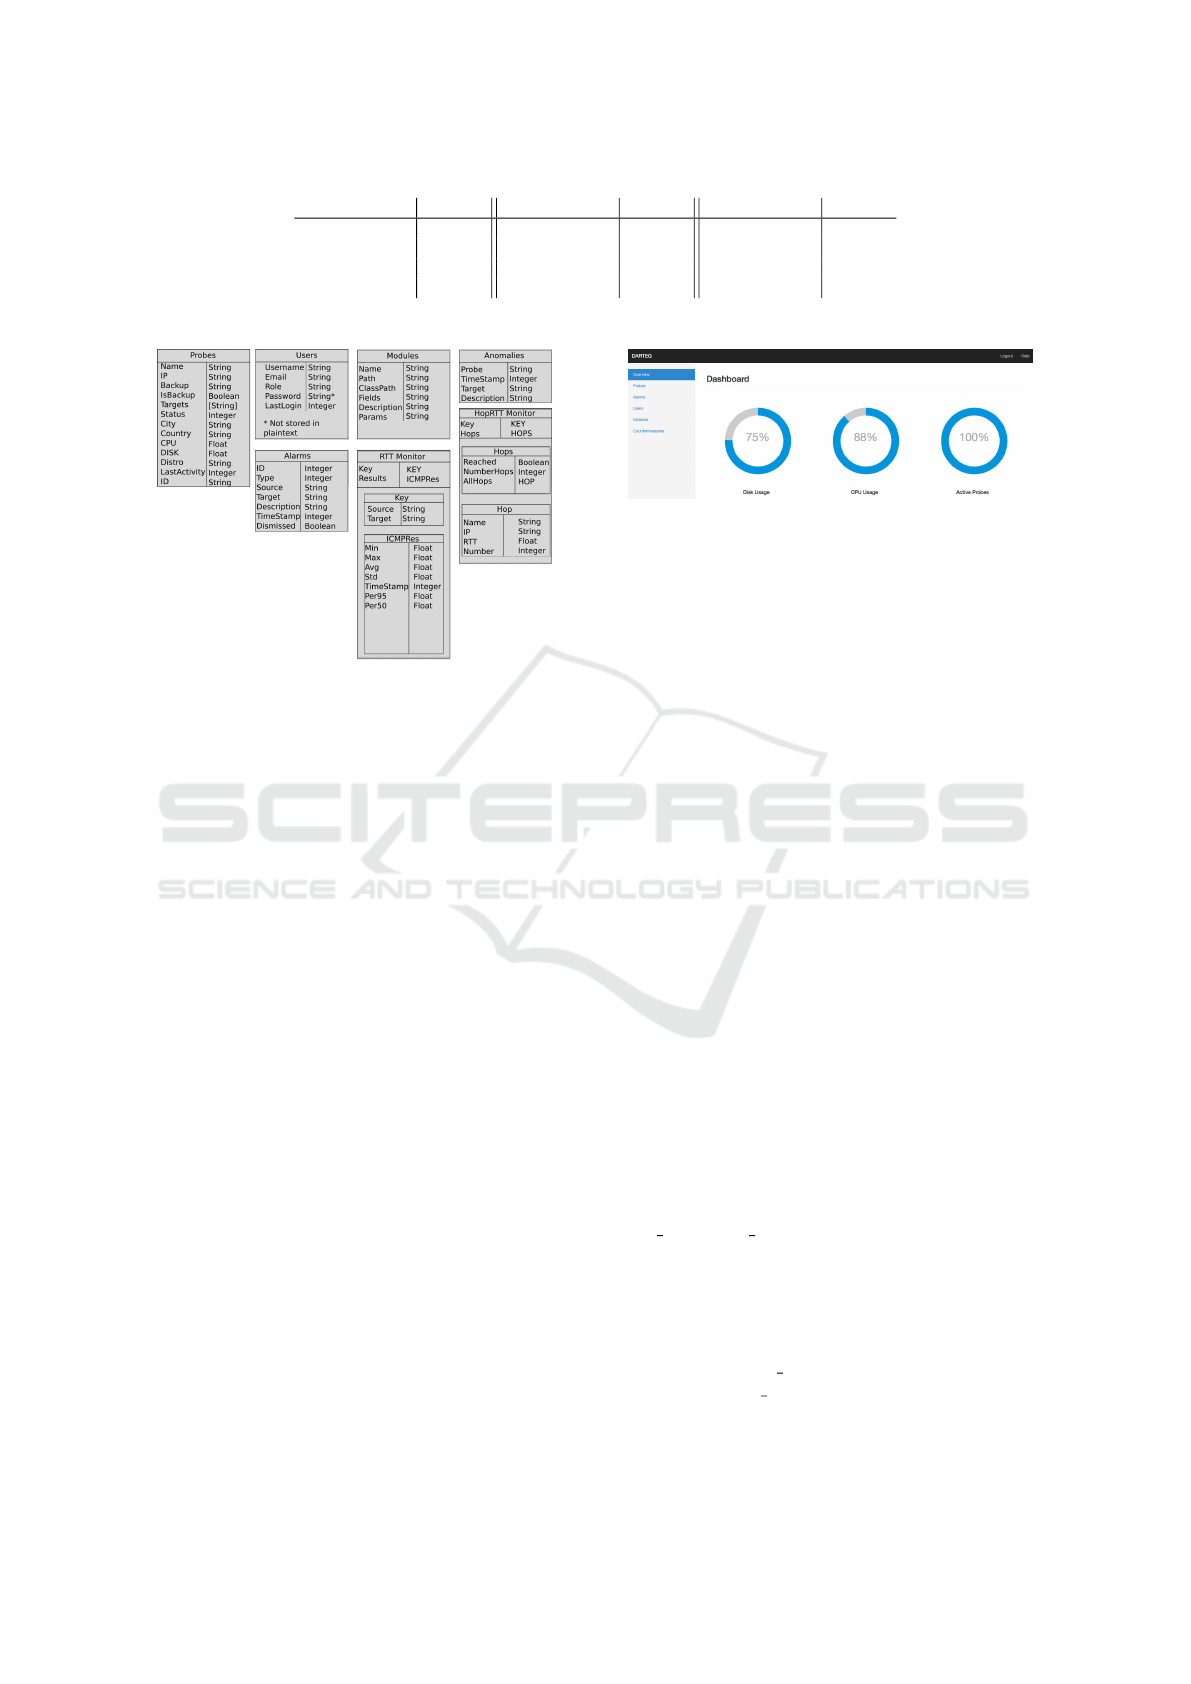
Figure 9: Database Collections.
When a module is successfully inserted, an admi-
nistrator can then assigning it to selected Probe/Target
pairs, and activate the new module. All the needed fi-
les and configurations will be sent to the Probes in
question and configuration changes will be made so
that it’ll use the new module upon restarting (which is
done automatically). Unless stated otherwise, the pa-
rameters used for the module will be the default ones
(defined when uploading a new module).
Data analysis modules will be used by the
Mainframe to process the gathered data and create
new metrics and/or return an anomaly detection re-
sult. As is the case for the data gathering modules,
these must also be written in Python or with a Python
wrapper. When inserting a new analysis module, it’ll
be stored, identically as the data gathering module, in
the database. The administrator must then select the
wanted fields from the database collections, at what
interval it should be ran, and assigning it to the desi-
red destination/targets.
The module is responsible for correct handling of
the data that it’ll receive via a tab separated values
(.tsv) file, passed as an argument (e.g., ’python ana-
lyticModule.py -f dataFile.tsv’). The file containing
the requested data will have the format present in Fi-
gure 8. Each Field will have an associated timestamp
relative to when it was acquired. The analysis module
is responsible to order and select the data for a spe-
cific time window. The output must be a JSON for-
matted string with the following mandatory elements:
’Anomaly’ : Boolean and ’Description’: String. In
the event of the ’Anomaly’ field being True, a new
Figure 10: Platform GUI.
alarm will be raised and a notification sent to the ad-
ministrator(s).
It is also possible to upload scripts, again Python
or Python wrapped ones, to act as countermeasures.
Countermeasure scripts will be ran at certain events,
which can be defined by an administrator. For exam-
ple, an administrator may decide to activate a counter-
measure whenever two anomalies have been detected
to a chosen target by one or more Probes. The coun-
termeasure may be as simple as disconnecting and re-
jecting all existing and further connections for a cer-
tain amount of time, or increasing encryption levels
on communications. In order to allow some customi-
zation of these scripts the Target IP of the alarm will
be passed as arguments to the script whenever it is
executed.
4 DATA STORAGE
Storing the data received from the Probes is of pa-
ramount importance, because without such storage,
there’s no use for the platform. As referred in
section 2, the platform makes use of a non-relational
database (MongoDB). It was preferred over relational
databases due to the volume of data that it can receive,
and also due to low relationships between data. The
database was organized in several different collecti-
ons: Users, Probes, Modules, Anomalies, Alarms,
Mod RTT, Mod Trace. The Users collection stores
the information regarding the user accounts and roles;
Probes collection stores the information regarding all
Probes in the platform; Modules store the information
regarding the added modules; Anomalies store the de-
tected anomalies; Alarms store the alarms raised by
the anomalies; Mod
RTT store the data from the RTT
Monitor and Mod Trace store the data from HopRTT
Monitor. Custom modules, added via the platform,
will also have a collection created for them on in-
Modular Platform for Customer-Side Detection of BGP Redirection Attacks
203

Figure 11: Probe section of GUI.
Figure 12: RTT and Hop count graphics.
sert, which will contain the fields declared on the mo-
dule’s JSON file; the collection will be named after
the module’s: ’ModA ModuleName’. Details about
each collection can be seen in Figure 9.
5 USER INTERFACE
A GUI Dashboard is available on the Mainframe,
which controls the whole platform. There it is pos-
sible to take actions regarding probes, targets, users,
visualize data and alarms. Regarding the Probes, it is
possible to:
• Add, delete, edit;
• Setup, start, restart, stop;
• Add/Remove targets and activate/deactivate mo-
dules.
As for users, it is possible to add, edit or remove
users, as long as done so from an Administrator ac-
count. Data from pair Probe-Target can be visualized
as graphics, showing the RTT and Hop Count mea-
surements. Access to the dashboard is dependent on
an user account. There are three different user ac-
counts: Administrator, Tech, and Standard. The Ad-
ministrator user can perform every action, such as
add, remove, setup, start, restart and stop probes; ma-
nage users; visualize data and alarms; upload data gat-
hering and data analysis modules; activate/deactivate
modules on Probes. As for the Tech user, it can per-
form every action except removing/stopping probes
and add/edit/remove users. For the last user type,
Standard, no actions are permitted, but visualization
of data is permitted.
6 VALIDATION RESULTS
Using the data gathering methodology, as described
in subsection 4, it was measured the RTT from twelve
probes spread over the world to a London based
server between June 8
th
2017 and June 12
th
2017.
The twelve probes used were located in: Sweden,
Amsterdam/Netherlands, Milan/Italy, Iceland, Israel,
Chile, two in South Africa (SouthAfrica1 and South-
Africa2), S
˜
ao Paulo/Brazil, Los Angeles/USA (LA2),
Chicago/USA (Chicago2), Germany (Ger2). During
the day of June 10
th
2017 all traffic was diverted via
Moscow to simulate a world-wide BGP routing at-
tack. Each probe performed an average RTT measu-
rement, with 10 packets every 60 seconds, to the Lon-
don server. Figure 13 depicts the obtain results. The
anomaly detection module was configured to signal a
global routing anomaly when 50% of the probes re-
ported an anomaly. A probe reports an anomaly when
the measured RTT for 10 consecutive measurements
were 20% above the average of the observe values in
the last hour.
From the twelve probes, eleven reported an ano-
maly 10 measurements after the traffic simulated
attack has started. The exception was the S
˜
ao
Paulo/Brazil probe which just register a small vari-
ation on the RTT (∼2%) above the values observed
before. This can be explain by two factors: (i) the
long distance and non-shortest path from Brazil to Eu-
rope and, (ii) the highly unstable network connection
to and from the Brazilian data center. Note, that the
Chilean probe was able to report the anomaly and the-
refore this is not a constrain general to all South Ame-
rica. Nevertheless, the global routing anomaly was
detected and signaled to the platform administrator,
since 91.6% of the probes reported an anomaly, and
this is well above the pre-defined threshold of 50%.
The simulated anomaly was global, however, real rou-
ting attacks may be contained within a geographic re-
gion, and because of that, the pre-defined percentage
of probes reporting anomalies must be 50% or even
less to detect routing anomalies in small geographic
regions.
7 CONCLUSION
This paper proposed a new modular platform, in
which it is possible to, as a customer, detect traffic
routing variations at an Internet-scale as proposed in
ICISSP 2018 - 4th International Conference on Information Systems Security and Privacy
204
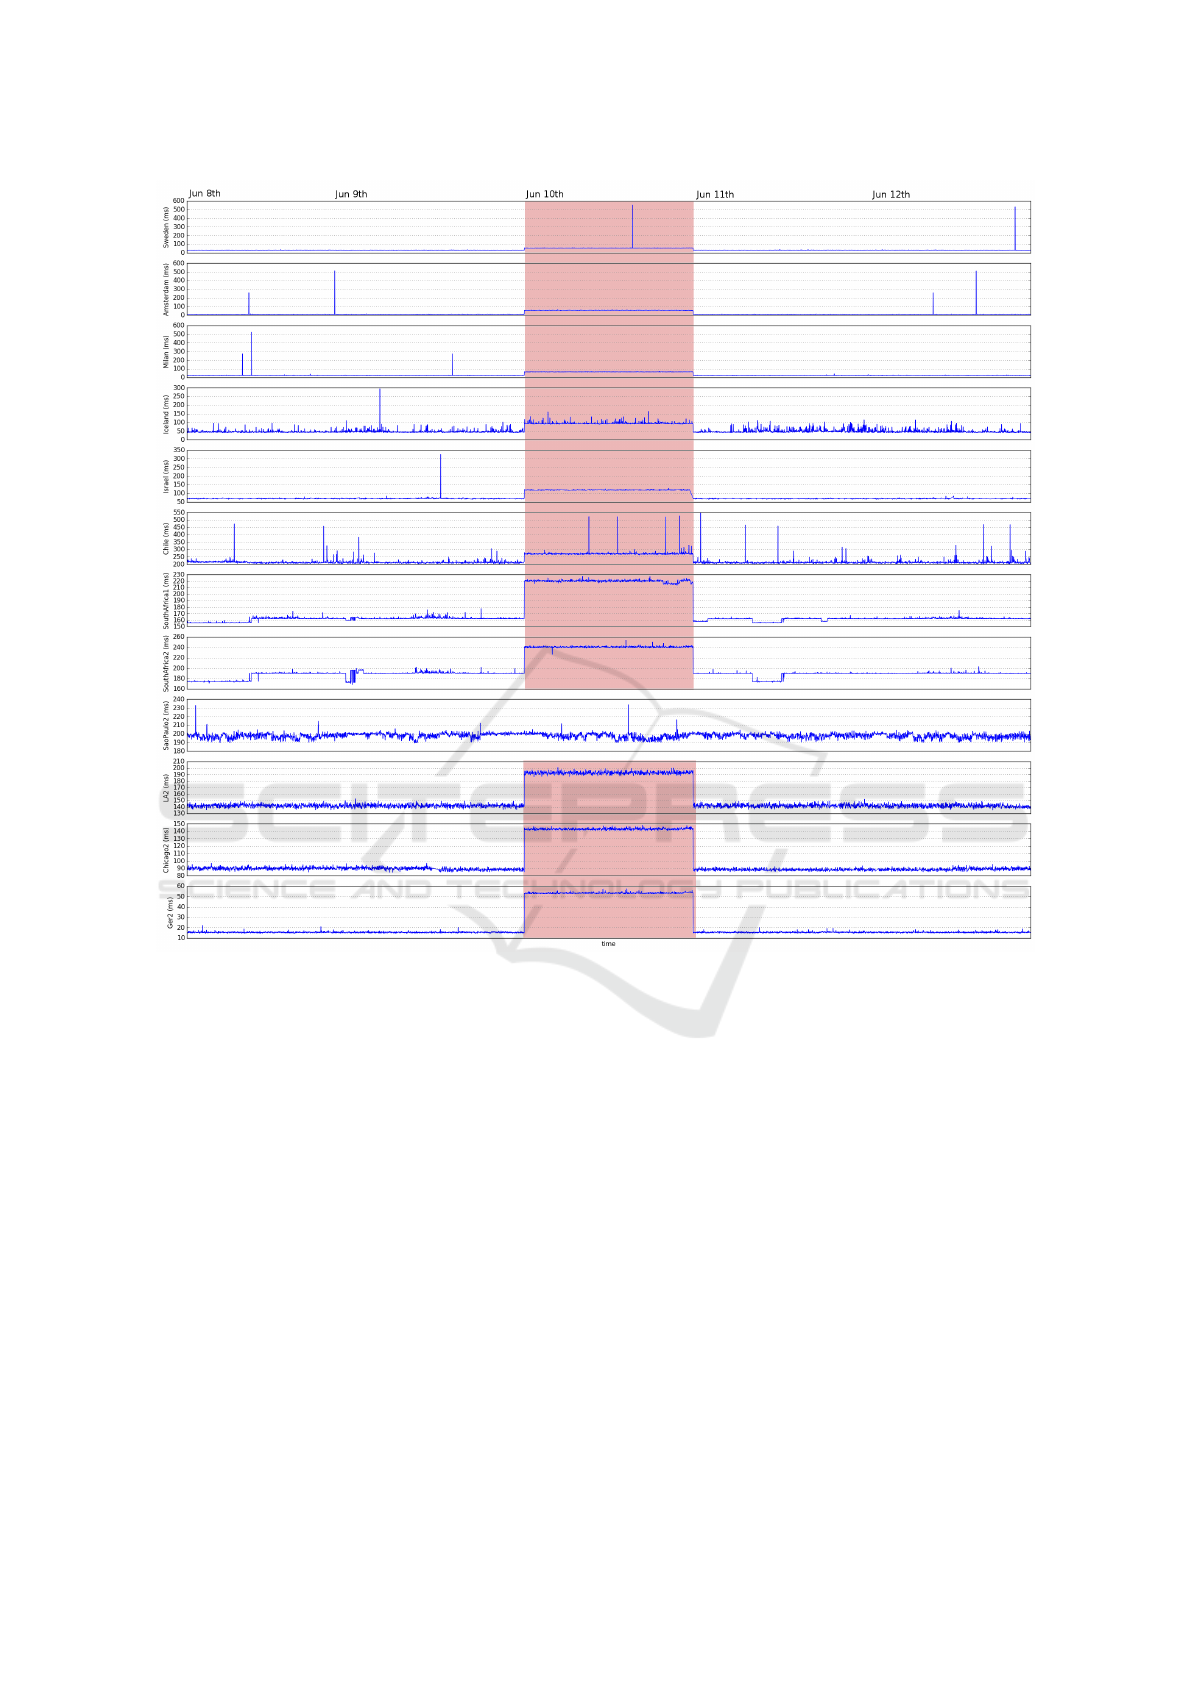
Figure 13: RTT measurements from 12 probes to a London based server from June 8
th
to June 12
th
2017. A routing anomaly
was introduced at June 10
th
, relaying all traffic via Moscow.
(Salvador and Nogueira, 2014). The modularity ena-
bles for customization and improvements for whome-
ver decides to deploy this platform. The existence of
pre-made modules makes it so that there’s no actual
need to implement any more code than the one alre-
ady provided, and allows for an almost plug & play
experience. We believe this platform will give the
much needed ability for corporations or single entities
to, at least, be able to detect what is happening to their
traffic on a global scale, and help them make decisi-
ons, or set up measurements, to mitigate such effects
such as terminating all sensible communications, in-
crease encryption levels and other security policies. It
can be further improved by creating new data analy-
sis methods and modules, as well as monitoring ones,
which can then be added to the platform.
ACKNOWLEDGMENTS
This work was supported by the Fundac¸
˜
ao para
Ci
ˆ
encia e Tecnologia (FCT) through UID/EEA/
50008/2013 and PTDC/EEI-TEL/5708/2014.
REFERENCES
Biersack, E., Jacquemart, Q., Fischer, F., Fuchs, J., Thon-
nard, O., Theodoridis, G., Tzovaras, D., and Ver-
vier, P. (2012). Visual analytics for BGP monitoring
and prefix hijacking identification. IEEE Network,
26(6):33–39.
Chang, J., Venkatasubramanian, K., West, A., Kannan, S.,
Lee, I., Loo, B. T., and Sokolsky, O. (2013). AS-
CRED: Reputation and Alert Service for Interdomain
Routing. IEEE Systems Journal, 7(3):396–409.
Modular Platform for Customer-Side Detection of BGP Redirection Attacks
205

Cowie, J. (2013). The New Threat: Targeted Internet Traffic
Misdirection. Dyn Blog.
Inc., M. (2009). Mongodb. [Online; accessed 27-July-2017
].
Liu, Y., Luo, X., Chang, R., and Su, J. (2013). Characteri-
zing Inter-Domain Rerouting by Betweenness Centra-
lity after Disruptive Events. IEEE Journal on Selected
Areas in Communications, 31(6):1147–1157.
Madory, D. (2015a). On-going BGP Hijack Targets Palesti-
nian ISP. Dyn Blog.
Madory, D. (2015b). UK traffic diverted through Ukraine.
Dyn Blog.
Pilosov, A. and Kapela, T. (2008). Stealing The Internet
- An Internet-Scale Man In The Middle Attack. In
DEFCON16.
Python (1991). Python language. [Online; accessed 27-
July-2017 ].
Ronacher, A. (2010). Python-flask web framework. [On-
line; accessed 27-July-2017 ].
Ronacher, A. (2013). Docker. [Online; accessed 27-July-
2017 ].
Roughan, M., Willinger, W., Maennel, O., Perouli, D., and
Bush, R. (2011). 10 Lessons from 10 Years of Mea-
suring and Modeling the Internet’s Autonomous Sys-
tems. IEEE Journal on Selected Areas in Communi-
cations, 29(9):1810–1821.
Salvador, P. and Nogueira, A. (2014). Customer-side de-
tection of internet-scale traffic redirection. In 16th
International Telecommunications Network Strategy
and Planning Symposium (NETWORKS 2014).
Zhang, Z., Zhang, Y., Hu, Y. C., Mao, Z. M., and Bush, R.
(2010). iSPY: Detecting IP Prefix Hijacking on My
Own. IEEE/ACM Trans. Netw., 18(6):1815–1828.
ICISSP 2018 - 4th International Conference on Information Systems Security and Privacy
206
