
Predicting the Perceived Modularity of MOF-based Metamodels
Georg Hinkel
1
and Misha Strittmatter
2
1
Software Engineering Division, FZI Research Center of Information Technologies, Karlsruhe, Germany
2
Software Design & Quality Group, Karlsruhe Institute of Technology, Karlsruhe, Germany
Keywords:
Metamodel, Modularity, Metric.
Abstract:
As model-driven engineering (MDE) gets applied for the development of larger systems, the quality assurance
of model-driven artifacts becomes more important. Here, metamodels are particularly important as many
other artifacts depend on them. However, existing metrics have been rarely validated for metamodels or,
even more, evaluation results disproved a correlation between these existing metrics and perceived metamodel
modularity. In this paper, we present a new entropy-based metric to capture the perception of metamodel
modularity and evaluate the metric in multiple case studies. In the case studies, we correlate the metric results
of 32 metamodels across three different domains with 164 responses of a quality assessment questionnaire
for which we collected responses in two empirical experiments. The results show significant and strong
correlations in all three domains between the metric results and the perceived metamodel modularity.
1 INTRODUCTION
Metamodels are a central artifact of model-driven en-
gineering (Schmidt, 2006) as many other artifacts de-
pend on them. If a metamodel contains design flaws,
then presumably all other artifacts have to compen-
sate for them (Di Ruscio et al., 2012). It is therefore
very important to detect such design flaws as early as
possible to avoid unnecessary development efforts in
dependent artifacts.
In the Neurorobotics-platform developed in the
scope of the Human Brain Project (HBP), these de-
pendent artifacts include not only editors, but also
an entire simulation platform where the connection
between robots and neural networks is described in
models (Hinkel et al., 2015; Hinkel et al., 2016a). As
the HBP is designed for a total duration of ten years,
it is likely that the metamodel will degrade unless ex-
tra effort is spent for its refactorings (Lehman, 1974;
Lehman et al., 1997). For such refactorings, we aim to
measure their success and potentially automate them.
In object-oriented programming, several ap-
proaches exist to detect design flaws, which can be
categorized into patterns and metrics. Patterns are
commonly used, for example to describe and detect
code smells. If a pattern can be found in the code,
there is a high defect probability and the smell may
be avoidable through better design. On the other
hand, metrics have been established to monitor the
complexity of object-oriented design not captured by
smells, such as the depth of inheritance or lines of
code.
Many metamodels nowadays are specified in im-
plementations of the Meta Object Facility (MOF, (Ob-
ject Management Group (OMG), 2015)), especially in
the EMOF specification of this standard and its imple-
mentation Ecore.
In prior work (Hinkel et al., 2016b), we have iden-
tified modularity as a quality attribute of Ecore meta-
models that has a significant influence on the per-
ception of metamodel quality, among correctness and
completeness. While the latter are hard to measure,
metrics exist to measure modularity in object-oriented
design.
Metamodels essentially describe type systems just
as UML class diagrams do. In fact, the differences
between usual class diagrams and formal metamodels
lies mostly in the degree of formalization and how the
resulting models are used. Whereas UML models of
object-oriented design are often used only for docu-
mentation or to generate code skeletons, metamodels
are usually used for a multitude of artifacts such as
editors, analyses and transformations. Like class dia-
grams, metamodels can be structured in packages to
enforce modules, which makes it appealing to apply
class diagram modularity metrics onto metamodels.
Given the similarity of metamodels to object-
oriented design, we have tried to adapt metrics
48
Hinkel, G. and Strittmatter, M.
Predicting the Perceived Modularity of MOF-based Metamodels.
DOI: 10.5220/0006539300480058
In Proceedings of the 6th International Conference on Model-Driven Engineering and Software Development (MODELSWARD 2018), pages 48-58
ISBN: 978-989-758-283-7
Copyright © 2018 by SCITEPRESS – Science and Technology Publications, Lda. All rights reserved

for object-oriented design such as the metrics from
Sarkar (Sarkar et al., 2008). We validated these met-
rics against human perception of metamodel modular-
ity: In absence of an accepted metric for metamodel
modularity, we analyzed to what degree metamodels
with a higher metric score are perceived as more mod-
ular. The rationale here is that if we find a metric that
has a very strong correlation with perceived modu-
larity, then this metric can be used to automate and
objectify the assessment of metamodels.
However, the results for the metrics by Sarkar
(Hinkel and Strittmatter, 2017) were discouraging be-
cause the metric values did not correlate with per-
ceived metamodel modularity. In particular, we could
statistically disprove even a slight positive correlation
between metric values and perceived modularity in
some cases.
If it is not the quality in terms of the Sarkar met-
rics, this raises the question how modelers perceive
the modularity of a metamodel. To answer this, we
concentrated more on the characteristics that are eas-
ier to perceive, tried to bundle these characteristics in
a metric and evaluated the metric in three case stud-
ies. In particular, we aim to quantitatively measure
how classes are distributed to packages, rather than
answering the question whether this distribution is
reasonable.
In the paper, we propose a metric to measure to
which degree classes are contained in different pack-
ages and validate the correlation of this metric to the
perceived metamodel modularity in two experiments
and three domains. We further apply the metric to dif-
ferent versions of existing metamodels in the domain
of software architecture description to check whether
the ranges of metric values obtained in the experi-
ments match the metric values of realistic metamod-
els.
The remainder of this paper is structured as fol-
lows: Section 2 explains our new metric to measure
to what degree a metamodel is modular. Section 3
presents the setup of the empirical experiments that
we use to validate this metric. Section 4 presents the
results from these experiments. Section 5 discusses
threats to validity of the results. Section 6 applies our
proposed metric to existing metamodels. Finally, Sec-
tion 7 discusses related work before Section 8 con-
cludes the paper.
2 THE DEGREE OF
MODULARIZATION
The goal of the proposed metric is to measure the de-
gree to which a metamodel employs a package struc-
ture. From a good package structure, we expect to
know the purpose of a class to a certain degree only
based on the package that contains the class.
Assuming that each class has a unique purpose,
this can be encoded into the question, how much in-
formation we have about a class based only on its
package.
The answer can be given using an entropy, bor-
rowed from stochastics. The entropy H[X] of a dis-
cretely distributed random variable X with probability
mass function P is given by:
H[X] = −
n
∑
i=1
P(x
i
)log
b
P(x
i
) = E[I[X]].
Here, b denotes the base of the used logarithm.
The term −log
b
P(x
i
) is also called the information of
x
i
, expressing informally how special the occurence
of x
i
is. The entropy is a lower bound on encodings,
i.e., the value of X cannot be described with less than
H[X] b-ary numbers. The entropy is 0 if and only if
there is only one event x
i
that always happens (P(x
i
) =
1). However, the entropy of a random variable can be
arbitrarily high, depending on how many events there
are.
Mapping entropies to metamodel metrics, our
events are that a class is encapsulated in a given pack-
age, i.e., x
i
means that a randomly chosen class is con-
tained in package p
i
. Thus,
P(x
i
) =
|C (p
i
)|
|C |
where C (p) denotes the classes in package p and C
denotes the set of all classes.
The entropy of the package pointer is 0 if and only
if all classes reside in the same package. The more
classes are scattered among packages, the higher is
the entropy. It can even be shown that for a fixed num-
ber of packages, the entropy is highest if the classes
are distributed evenly across the packages.
At the same time, the entropy also takes the total
number of classes into account, much better than just
an average number of classes per package. In particu-
lar, creating some packages with few classes does not
help to improve the metric as long as there are still
huge packages left that encapsulate a significant part
of the classes.
However, we still have the problem that the en-
tropy can get arbitrarily high and the developer does
not necessarily have an idea what value is sufficient.
In the spirit of Sarkar et al. (Sarkar et al., 2008),
we would like to obtain a metric with fixed bounds.
Therefore, we scale the entropy with the maximum
entropy that can be achieved with the given number
Predicting the Perceived Modularity of MOF-based Metamodels
49

of classes. This maximum entropy is given if each
class is encapsulated in its own package. The entropy
in this case is exactly log
b
|C |, where again C is the
set of classes.
A further advantage of this approach is that the
base b cancels out, such that we do not even have to
analyze its effects when calculating the metric.
Hence, the degree of modularization (DM) is de-
fined as follows (we suppressed the base b because its
value does not matter):
DM = −
1
log|C |
∑
p∈P
|C(p)|
|C |
log
|C(p)|
|C |
.
For any metamodel, the values of this metric must
range between 0 and 1. The value is 0 if and only if
all classes reside in a single package. The value is 1
if and only if all classes reside in their own packages.
Because the metric divides by the logarithmic number
of all classes, the DM metric formula is only well-
defined for any metamodel that contains at least two
classes. Metamodels with fewer classes are assigned
a DM-metric of 1.
To get a better understanding of the values that the
DM-metric assigns to metamodels, consider a meta-
model with a
k
classes for some a ∈ N
>1
and some
k ∈ N. Let the classes be evenly distributed across a
i
packages for some m ∈ N with m ≤ k. This means,
each package contains a
k−m
classes. In this case, we
have that P(x
i
) = a
−m
for each package. Thus, we
arrive at
DM = −
1
k log a
a
m
∑
i=1
a
−m
(−m)loga =
m
k
.
Thus, if the metamodel with n classes contains
roughly
√
n packages with evenly distributed pack-
ages, this gives a DM value of
1
2
. If the classes are not
evenly distributed across the packages, the DM value
is lower.
In most cases, it is not useful to encapsulate ev-
ery class into its own package. Therefore, the value
range of this metric has to be taken into account care-
fully. Furthermore, the metric does not tell us any-
thing about whether the purpose of the classes in
a package can easily be generalized, i.e., whether
it makes sense to group these classes in a package.
However, the metric may provide hints whether the
package structure should be refined.
3 EXPERIMENT SETUP
To validate the correlation of the DM metric to per-
ceived metamodel modularity, we first used the data
collected from a previous controlled experiment on
metamodel quality perception (Hinkel et al., 2016b).
In this experiment, participants were asked to man-
ually assess the quality of metamodels created by
peers. The material – domain descriptions, assess-
ments and created metamodels – are publicly avail-
able online
1
. Due to space limitations, we therefore
only replicate a very short description of the experi-
ment.
The 24 participants created metamodels for two
domains. Each domain was described in a text and
the participants were asked to design a metamodel
according to it. The participants consisted of profes-
sional researchers as well as students from a practi-
cal course on MDE. They were randomly assigned
to the domains, ensuring a balance between the do-
mains. Each participant was asked to assess the qual-
ity of several metamodels using a questionnaire. We
collected 89 responses, equally distributed among the
domains.
The first domain regards user interfaces of mo-
bile applications. Participants were asked to create
a metamodel that would be able to capture designs
of the user interface of mobile applications so that
these user interface descriptions could later be used
platform-independently. The participants created the
metamodel according to a domain description in nat-
ural language from scratch. We refer to creating the
metamodel of this mobile applications domain as the
Mobiles scenario.
The second domain was business process model-
ing. Here, the participants were given a truncated
metamodel of the Business Process Modeling Lan-
guage and Notation (BPMN) (The Object Manage-
ment Group, 2011) where the packages containing
conversations and collaborations had been removed.
The task for the participants was to reproduce the
missing part of the metamodel according to a textual
description of the requirements for the collaborations
and conversations. We refer to this evolution task as
the BPMN scenario in the remainder of this paper.
To confirm the results in yet another domain, we
also apply the metric to student solutions to a mod-
eling task that had to be done in several editions of a
practical course on model-driven engineering. In this
task, students had to create a metamodel based on a
textual domain description and were allowed to work
in pairs. Over the three years, we have collected 19
metamodels. In the controlled setting, we collected 75
responses evaluating the quality of these metamodels.
The meta-modeling task was creating a meta-
model for component-based software architectures,
inspired by the Palladio Component Model (Becker
1
https://sdqweb.ipd.kit.edu/wiki/Metamodel_Quality
MODELSWARD 2018 - 6th International Conference on Model-Driven Engineering and Software Development
50

et al., 2009). However, in contrast to PCM that also
models the resource demands of service calls, the
domain description only contained modeling entities
to describe component types, the architecture of a
component-based system through instances of these
components and the description of a deployment. Un-
like the original PCM with more than 200 classes, the
resulting metamodels had between 21 and 45 classes.
We refer to this task as the CBSE scenario in the re-
mainder of this paper.
We asked the students of the most recent year to
manually assess the quality of these metamodels, ran-
domly assigning students to metamodels. The manual
assessment was done in a controlled setting and af-
ter the students submitted their own metamodel. We
made sure that nobody assessed their own metamodel
by rolling new assignments until this constraint was
met. However, students were allowed to discuss the
metamodels with peers assigned to review the same
metamodels. Like in the previous experiments, we
used a six-level Likert scale to encode the degree of
modularity from very bad (-5) to very good (5).
To ease the comparison between this third domain
and the other ones, we have used the same question-
naire to collect the metamodel quality assessments
as we used in the original experiment (Hinkel et al.,
2016b).
We correlated the metric results with the manual
modularity assessments and applied a t-test to test
and reject the null-hypothesis that the metric values
are uncorrelated with perceived metamodel modular-
ity. Additionally, we also use the available data to de-
pict the correlations of DM to other quality attributes.
The statistical tests assume a normal distribution. To
reason whether this assumption is reasonable, we plot
the sample distributions against the theoretical quan-
tiles of a normal distribution. If the quantiles are in a
line, the normal distribution assumption is justified.
4 RESULTS
We correlated the manual quality assessments with
the metric results for the metamodels created by the
experiment participants. The discussion of the results
is split into three sections, one for each of the scenar-
ios and a fourth for discussion.
We have plotted the results for the first two sce-
narios in Figure 1. Both graphs show a correlation be-
tween the metric results and the perceived modularity,
though the metric values were generally higher in the
BPMN scenario. This is due to the fact that the par-
ticipants only evaluated the user extension from other
participants, while the remaining metamodel showed
●
●
●
●
●
●
●
●
●
●
●
x
y
0.0 0.1 0.2 0.3 0.4 0.5
DM
−4 −2 0 2 4
Modularity
(a) Mobiles scenario
●
●
●
●
●
●
●
●
●
●
●●
x
y
0.550 0.560 0.570
DM
−4 −2 0 2 4
Modularity
(b) BPMN scenario
Figure 1: Metric results for Degree of Modularization DM
in Mobiles and BPMN scenario.
●
●
●
●
●
●
●●
●
●
●
●
●
●
●
●
●
●
●
x
y
0.0 0.1 0.2 0.3 0.4 0.5
DM
−4 −2 0 2 4
Modularity
Figure 2: Results for the DM metric in the CBSE scenario.
already a good modularization.
Further, we plotted the results for CBSE against
the perceived modularity in Figure 2.
4.1 Mobiles
The assumption of a normal distribution is reasonable
for the modularity as the quantiles appear on a line in
Figure 3b. The QQ-plot for the DM metric appears as
a step-function (cf. Figure 3a), because many meta-
models only received a DM-value of 0, as they did not
use any package structure. Therefore, correlations in
this scenario may not be as reliable as in the other
scenarios.
●●●
●
●
●
●●●●
●
●●
●
●
●●
●
●
●
●●●●
●
●●
●●
●●
●
●
●
●●●●
●
●●
●
●●●●●●●●●●●●●●
●
●●
●
●
●
●●●●
●
● ●
●
●
●
●
●
●
●
●
●
●
●
●
●
●
●
●
●●
●
●
●
●●●●
●
●●
●
−2 −1 0 1 2
0.0 0.4 0.8
Normal QQ−Plot (DM)
Theoretical Quantiles
Sample Quantiles
(a) DM-metric
●
●
●
●
●
●
●
●
●
●
●
−1.5 −0.5 0.5 1.0 1.5
−2 0 2
Normal QQ−Plot (Modularity)
Theoretical Quantiles
Sample Quantiles
(b) Modularity
Figure 3: Normal QQ-Plots in the Mobiles scenario.
The results correlating the metric results against
manually assessed metamodel quality perceptions are
Predicting the Perceived Modularity of MOF-based Metamodels
51

depicted in Table 1. To get a quicker overview, we
have printed strong correlations (|ρ| > 0.5) in bold.
In this domain, many of the resulting metamod-
els consisted of a single package that constantly were
evaluated with a DM of 0. The modularity of these
metamodels is perceived rather differently. We can
see metamodels assessed as having a bad (-3) mod-
ularity and ones that have a good modularity (+3),
where the latter case is rather an exception (cf. Figure
1a). However, all of the metamodels that employ a
package structure all have a good modularity, which
in the end results in quite a good correlation coeffi-
cient of ρ = 0.74.
As we have 14 different metamodels, the t-Test
leads to a p-value of 0.0012. Therefore, we can reject
the null-hypothesis that the values of DM are uncor-
related with perceived metamodel modularity in this
scenario at 99% confidence.
4.2 BPMN
In the BPMN scenario, the quantiles of the DM met-
ric are more in a line, with the exception of two meta-
models that have received the highest modularities,
see Figure 4a. In the QQ-plot of the modularity, the
points are also roughly on a line (cf. Figure 4b).
●
●
●
●
●
●
●
●
●
●
●
●
●
●
−1 0 1
0.550 0.565
Normal QQ−Plot (DM)
Theoretical Quantiles
Sample Quantiles
(a) DM-metric
●
●
●
●
●
●
●
●
●
●
● ●
−1.5 −0.5 0.5 1.5
0 1 2 3
Normal QQ−Plot (Modularity)
Theoretical Quantiles
Sample Quantiles
(b) Modularity
Figure 4: Normal QQ-Plots in the BPMN scenario.
The correlations we observed are depicted in Ta-
ble 2. Despite the participants had only evaluated
the manual extensions, the metric results were taken
from the complete metamodels, also taking into ac-
count the larger part of the metamodel that had not
been changed. While this means that the metric val-
ues are not comparable across scenarios, it does not
have an influence on correlations within the scenario.
Furthermore, we do think that this better represents an
evolution scenario which is more common than creat-
ing a metamodel from scratch.
In the BPMN scenario, we also observe a strong
correlation of DM values to perceived modularity
with a correlation coefficient of 0.68. As the en-
tire metamodel was measured and already the exist-
ing metamodel employed a detailed package struc-
ture, there are no metamodels with a DM value of 0.
Further, the metric values are much closer together,
since the majority of the metamodel is still the same.
However, we can see in Figure 1 that the metamodel
with the highest DM-metric, also has the best per-
ceived modularity.
As we again have 14 different metamodels, this
leads to a p-value of 0.0063 in the t-Test. Thus, we
can again reject the hypothesis that the values of DM
are uncorrelated with perceived metamodel modular-
ity at the 99% confidence level.
4.3 CBSE
In the CBSE scenario, the quantiles of the DM-metric
and for modularity are well on a line, see Figures 5a
and 5b. The only exception is the metamodel that only
used a single package and therefore was perceived as
least modular. However, the remaining data quantiles
fit very well on a line, which is why we rely on this
scenario most.
●
●
●
●
●
●
●
●
●
●
●
●
●
●
●
●
●
●
●
−2 −1 0 1 2
0.0 0.2 0.4
Normal QQ−Plot (DM)
Theoretical Quantiles
Sample Quantiles
(a) DM-metric
●
●
●
●
●
●
●●
●
●
●
●
●
●
●
●
●
●
●
−2 −1 0 1 2
−4 0 4
Normal QQ−Plot (Modularity)
Theoretical Quantiles
Sample Quantiles
(b) Modularity
Figure 5: Normal QQ-Plots in the CBSE scenario.
The observed correlations for DM in the CBSE
scenario are depicted in Table 3. Again, we can see
a strong correlation of DM to modularity, while the
correlation to any of the other quality attributes is not
significant. For modularity, the t-Test to reject the hy-
pothesis that DM is uncorrelated with perceived mod-
ularity can be rejected with a p-value of 0.011, so we
can be sure at least at a 95% confidence level.
This correlation is due to the fact that solutions
that did not divide their classes into packages were
perceived to have a very bad modularity. On the other
hand, we can see that metamodels that did divide their
classes into packages received quite different scores
in the perceived modularity, though they have a simi-
lar DM score.
4.4 Estimated Influence
To reason on the influence of the DM metric, we fitted
a linear regression model. We chose linear regression
because the scatter plots in Figures 1 and 2 indicate
this kind of connection. Because the evaluation of
the perceived quality was only assessed for the user
extension in the BPMN scenario, we only took the
MODELSWARD 2018 - 6th International Conference on Model-Driven Engineering and Software Development
52

Table 1: Correlations of metric results to quality attribute assessments in the Mobiles scenario. Strong correlations (|ρ|> 0.5)
are printed in bold.
Quality
Complexity
Understandability
Conciseness
Modularity
Consistency
Completeness
Correctness
Changability
Instance Creation
Transformation
DM 0.18 -0.08 0.28 0.17 0.74 0.19 0.04 0.03 0.56 0.24 0.57
Table 2: Correlations of metric results to quality attribute assessments in the BPMN scenario. Strong correlations (|ρ| > 0.5)
are printed in bold.
Quality
Complexity
Understandability
Conciseness
Modularity
Consistency
Completeness
Correctness
Changability
Instance Creation
Transformation
DM 0.29 0.26 0.21 0.41 0.68 0.32 0.41 0.35 0.49 0.10 -0.05
Table 3: Correlations of metric results to quality attribute assessments in the CBSE scenario. Strong correlations (|ρ| > 0.5)
are printed in bold.
Quality
Complexity
Understandability
Conciseness
Modularity
Consistency
Completeness
Correctness
Changability
Instance Creation
Transformation
DM 0.26 -0.30 0.21 -0.25 0.52 0.19 0.26 0.08 0.21 0.17 0.12
observations from the other two case studies into ac-
count.
We fitted the following linear model:
Modularity ∼a ·DM + b.
The results for this linear regression model are de-
picted in Table 4.
For this linear model, 3 responses had to be ig-
nored due to missing values. The linear model is sig-
nificant at the 95% confidence level with a p-value of
0.0218. According to the linear regression model, the
DM metric has an estimated influence of 0.56·4.04 =
2.25, which is more than one Likert-level but on the
other hand not much more than that.
On the contrary, the metamodel with the worst
average score of modularity has an assessment of -5
while the metamodel with the best score has an aver-
age modularity of 4.5, making up a total range of 9.5.
Very roughly, the DM metric only measures about
one fourth of the perceived modularity. The residuals
range from -4.48 to 3.52. Thus, the linear model also
suggests that there are other factors to consider and
that the DM metric alone is not a very well predictor
of perceived modularity, though with 95% confidence
a better predictor than no predictor.
To get a better understanding of the influence of
other factors, as a first approach, we have taken the
scenario as another indicator of modularity. Thus, we
assume that there is a characteristic of the modeling
scenario that also has an influence to the perceived
modularity, though we do not know it. This also bal-
ances the difference in the assessments: While the as-
sessment of metamodels in the Mobiles domain was
conducted by a mixed group of students and profes-
sionals, the assessment in the CBSE domain was done
only by students.
Modularity ∼a ·DM + b ·Scenario + c.
For this, we encoded the scenario with a 0 for the
Mobiles scenario and a 1 for the CBSE scenario. The
Predicting the Perceived Modularity of MOF-based Metamodels
53

Table 4: Results of fitting a Linear Regression Model for Modularity ∼ a ·DM + b.
Estimate Std. Error t-Value p-value
Intercept (b) -0.52 0.61 -0.85 0.40
DM (a) 4.04 1.66 2.43 0.0218 *
Table 5: Results of fitting a Linear Regression Model for Modularity ∼ a ·DM + b ·Scenario + c.
Estimate Std. Error t-Value p-value
Intercept (c) -0.23 0.54 -0.43 0.67
DM (a) 8.70 2.14 4.07 3.71 ·10
−4
***
Scenario (b) -2.69 0.90 -2.99 5.83 ·10
−3
**
resulting test results are shown in Table 5.
The linear model is significant with an F-statistic
of 8.272 on 2 and 27 degrees of freedom and a result-
ing p-value of 1.58 ·10
−3
. We face minimum residu-
als of -2.37 and maximum residuals of 3.69 such that
we have to assume that there are other influence fac-
tors.
From the influence factors considered, the results
indicate a very strong influence of the DM metric.
In particular, the linear model suggests that a differ-
ence of 0.23 in the DM metric is equivalent to one of
the Likert levels that we used to encode the perceived
modularity.
On the other hand, the DM metric only ranged
from 0 to 0.56 in the questionnaires taken into consid-
eration. This explains a span of the perceived modu-
larity of 0.56 ·8.70 = 4.84 meanwhile the actual span
is 9.5. Therefore, it is not only the package struc-
ture that was assessed by the study participants but
roughly half of the modularity assessment can be pre-
dicted using the DM metric and the scenario indicator.
4.5 Discussion
Due to the fact that participants of the experiment
had to evaluate the entire metamodel in the Mobiles
and CBSE scenario but only a small part of it in the
BPMN scenario, we performed our correlation anal-
ysis for each scenario separately. The findings may
thus be depending on the domain. In this section, we
try to overcome this problem by discussing how the
results from all scenarios fit together.
The DM metric showed a very strong and signif-
icant correlation with modularity in both scenarios,
unlike previous experiments with adapted versions of
the Sarkar metrics (Hinkel and Strittmatter, 2017).
However, the metric DM alone is not sufficient. We
can see for example in both sides of Figure 1 that
there is still a quite different perception of modularity
among equally modularized metamodels (in terms of
DM). Furthermore, when thinking about auto-tuning,
the DM metric can be easily optimized for by isolat-
ing every class into its own package.
The fact that the results for DM were so good
in comparison to IC (inheritance-based coupling)
and AC (association-based coupling) in earlier work
(Hinkel and Strittmatter, 2017) may result from the
degree of modularization being very easy to perceive.
In the corner cases (when DM is very high over low),
one can directly see that a metamodel employs a mod-
ule structure or not. On the contrary, the couplings
measured by e.g. IC and AC are more subtle. For ex-
ample, the Palladio Component Model (Becker et al.,
2009) contains multiple cycles of inheritance cou-
plings between packages that remained undetected for
a long time, though the model was actively developed.
These are problems that the DM metric simply cannot
detect, as it does not take inheritance or references
into account.
The results from the influence of this metric to the
overall modularity match this observation: While the
analysis indicates that the influence of DM is signifi-
cant when predicting the modularity, we also see that
DM is not enough and has to be combined with other
metrics for an accurate prediction of perceived modu-
larity.
Thus, we see a high potential in combining our
newly introduced DM metric with the coupling met-
rics IC and AC introduced in earlier work (Hinkel and
Strittmatter, 2017). How exactly these metrics should
be combined will be subject of further research. Our
sample size is too low to make a good recommen-
dation. For AC, we propose, supported by the data,
that better results can be achieved by restricting the
associations under review to containments and con-
tainer references or opposite references. However, for
this decision, our study did not consist of sufficiently
many data points so that we must also shift this open
question to future work.
MODELSWARD 2018 - 6th International Conference on Model-Driven Engineering and Software Development
54

5 THREATS TO VALIDITY
The internal threats to validity described in the origi-
nal experiment description (Hinkel et al., 2016b) also
apply to the Mobiles and BPMN scenarios when us-
ing the collected data to validate metamodel metrics.
We do not repeat them here due to space limitations.
As we are performing post-mortem analysis, we can
exclude any subject effect.
In the CBSE scenario metamodels were not cre-
ated in a controlled environment, but uncontrolled as
a homework assignment. However, we think this is
a more realistic case and after all, the CBSE domain
was also slightly more complex than the Mobiles and
BPMN domain. However, we can also exclude a sub-
ject effect as the students did not know the DM-metric
when assessing the metamodels.
We are correlating the metrics results with per-
ceived modularity in order to utilize the wisdom of
our study participants. However, metrics are most
valuable if they find the subtle flaws that humans do
not perceive in order to raise awareness that there
might be something wrong. Furthermore, the expe-
rience of our experiment participants, especially the
students, may be insufficient.
From a statistics point of view, the assumption of
a normal distribution is often a difficult one. The per-
ceived modularity we are working with is a mean per-
ception of a few experiment participants: To keep the
effort of study participants reasonable, every partici-
pant only reviewed between one and two metamodels
in each the Mobiles and BPMN domain or seven meta-
models in the CBSE domain. Therefore, the modular-
ity perception is not necessarily normally distributed.
Although we briefly discussed the assumption of a
normal distribution for each scenario, one may want
to have more evidence or a stricter compliance to a
normal distribution.
The conclusions on correlations are only valid in
the range of metric values that we have observed.
In particular, we do not know whether a DM value
greater than approximately 0.6 would improve the
modularity further. In fact, we doubt that. Especially
the corner case of DM = 1, a metamodel where each
class is separated in its own package, is not a sign of
good modularization. Therefore, we check the val-
ues of DM for realistic metamodels in the following
section.
Lastly, correlation does not imply causality and
thus, we do not know whether the metric is of any
value, if modelers are forced to meet a certain thresh-
old.
6 APPLICATION TO EXISTING
METAMODELS
We applied the DM-metric on different versions of
metamodels for software systems. We automati-
cally obtained versions of these metamodels from on-
line repositories and performed measurement series
for representative versions in order to have a better
overview of the measurement results. The inspected
metamodels are:
• Knowledge Discovery Metamodel (KDM) (Pérez-
Castillo et al., 2011): an OMG standard for
the modernization of legacy systems. We ob-
tained four versions of this metamodel from the
MoDisco plugin (Bruneliere et al., 2010) for the
Eclipse Modeling Framework (EMF).
• Palladio Component Model (PCM) (Reussner
et al., 2016): a metamodel for performance and
reliability predictions of component-based archi-
tectures with the Palladio Simulator. We selected
seven representative versions from all 97 versions
between 2007 and 2012.
• Descartes Metamodel (DMM) (Kounev et al.,
2010): a metamodel for self-aware runtime man-
agement of component systems inspired by PCM.
We inspected one version.
• SOFA 2 (Bureš et al., 2006): a metamodel for
hierarchically composed, dynamic component ar-
chitectures and behaviour specifications. We ob-
tained six versions.
• Kevoree (Fouquet et al., 2014): a metamodel for
the design and implementation of distributed re-
configurable systems with component architec-
ture. We selected seven revisions.
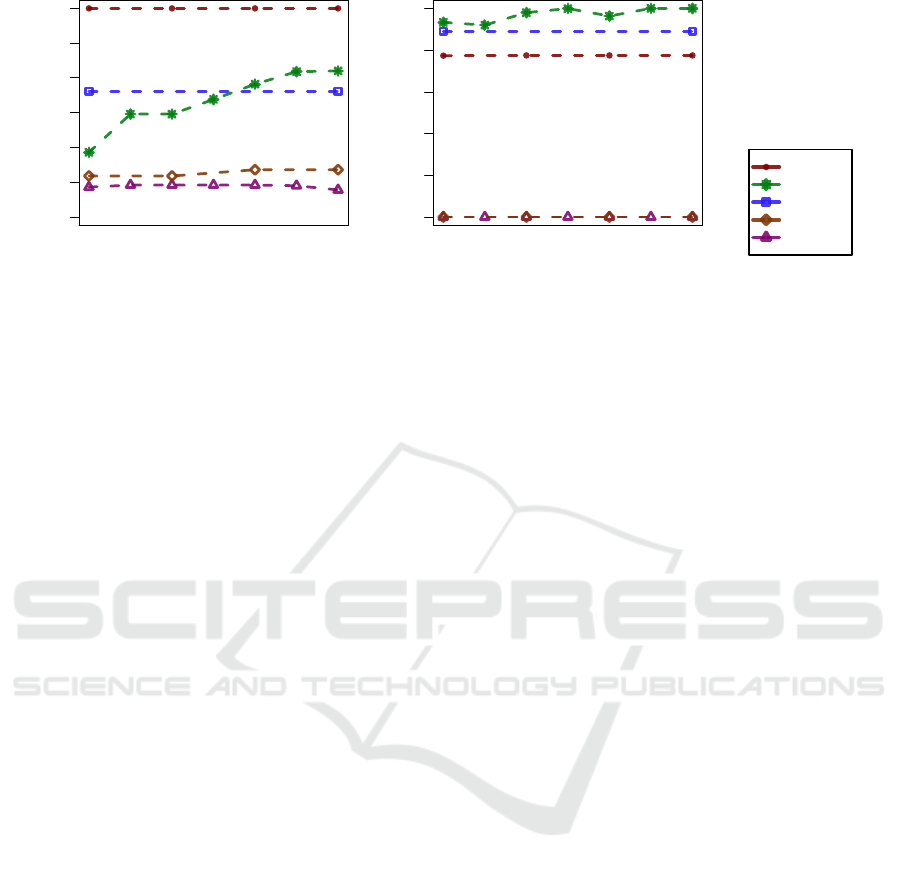
For each metamodel, the measurements of the dif-
ferent versions are plotted in their chronological or-
der. For the PCM, the number of classifiers more than
doubled, while the others remained constant in size.
This is also due to the fact that the versions span over
five years for the PCM and over much shorter periods
of time for all other metamodels.
The graph for the DM metric clearly shows the
lack of any package structure in the Kevoree and
SOFA 2 metamodels. The other metamodels have
roughly similar DM values. For PCM and Descartes,
this is reasonable since Descartes was inspired by
PCM, though adjusted to model the runtime of
component-based systems. The KDM metamodel has
a slightly lower DM value, simply because the 300
classes are distributed only to 12 packages.
In the evolution of PCM, we can also see that the
degree of modularization has roughly stayed the same
Predicting the Perceived Modularity of MOF-based Metamodels
55
0 50 100 200 300
Total Number of Classifiers
Time
0.0 0.1 0.2 0.3 0.4 0.5
Degree of Modularization
Time
KDM
PCM
DMM
SOFA 2
Kevoree
Figure 6: Size metrics results for different versions of component-based metamodels.
during a long evolution process. Therefore, we think
that the observed DM-values of up to 0.5 are realistic.
7 RELATED WORK
Our paper on the usage of Sarkar metrics to evaluate
the modularity of metamodels presents an alternative
approach to obtain a quantitative quality assessment
of metamodels (Hinkel and Strittmatter, 2017). How-
ever, the results were not as good as the DM metric
based on the same experiment data.
Related work in the context of metamodel quality
consists mostly of adoptions of metrics for UML class
diagrams and object-oriented design. However, to the
best of our knowledge, the characterization of meta-
model quality has not yet been approached through
the perception of modeling experts.
Bertoa et al. (Bertoa and Vallecillo, 2010) present
a rich collection of quality attributes for metamodels.
However, as it is not the scope of their work, they
do not give any information how to quantify the at-
tributes.
Ma et al. (Ma et al., 2013) present a quality
model for metamodels. By transferring metrics from
object-oriented models and weighting them, they pro-
vide composite metrics to quantify quality properties.
They calculate these metrics for several versions of
the UML metamodel. However, they do not provide a
correlation between their metrics and quality.
López et al. propose a tool and language to check
for properties of metamodels (López-Fernández et al.,
2014). In their paper, they also provide a catalog
of negative properties, categorized in design flaws,
best practices, naming conventions and metrics. They
check for breaches of fixed thresholds for some met-
rics, but both their catalog and also these thresholds
stem from conventions and experience and are not
empirically validated.
Vépa et al. present a repository for metamodels,
models, and transformations (Vépa et al., 2006). The
authors apply metrics that were originally designed
for class diagrams onto the metamodels of the repos-
itory. They give a rationale on how to relate some of
the metrics to metamodel quality. However, no vali-
dation is given.
Williams et al. applied a variety of size metrics
onto a big collection of metamodels (Williams et al.,
2013). However, they did not draw any conclusions
with regards to quality.
Di Rocco et al. also applied metrics onto a large
set of metamodels (Di Rocco et al., 2014). Besides
size metrics, they also feature the number of isolated
metaclasses and the number of concrete immediately
featureless metaclasses. Further, they searched for
correlations of the metrics among each other. E.g.,
they found that the number of metaclasses with super
class is positively correlated with the number of meta-
classes without features. Based on the characteristics
they draw conclusions about general characteristics of
metamodels. However, to the best of our knowledge,
they did not correlate the metric results to any quality
attributes.
Gomez et al. propose an approach which aims
at evaluating the correctness and expressiveness of a
metamodel (Gómez et al., 2012). A metamodel is
considered correct, if it only allows valid instances.
Expressiveness is the degree to which it is able to ex-
press the instances it is supposed to. Their approach
automatically generates a (preferably small) set of in-
stances to evaluate these two criteria.
Garcia et al. developed a set of domain-specific
metamodel quality metrics for multi-agent systems
modeling languages (García-Magariño et al., 2009).
They propose three metrics: availability, specificity
and expressiveness. These metrics take domain
knowledge into account, e.g., the “number of nec-
essary concepts” or the “number of model elements
necessary for modelling the system of the problem
domain”.
MODELSWARD 2018 - 6th International Conference on Model-Driven Engineering and Software Development
56

Leitner et al. propose complexity metrics for do-
main models of the software product line field as well
as feature models (Leitner et al., 2012). However,
domain models are not as constrained by their meta-
models as it is the case with feature models. The
authors argue, that the complexity of both, feature
and domain models, influences the overall quality of
the model, but especially usability and maintainabil-
ity. They show the applicability of their metrics, but
do not validate the influence between the metrics and
quality.
Vanderfeesten et al. investigated quality and de-
signed metrics for business process models (Vander-
feesten et al., 2007). Some of them can be applied to
metamodels or even graphs in general. The metrics
are validated by assessing the relation between metric
results and error occurrences and manual quality as-
sessments (Mendling and Neumann, 2007; Mendling
et al., 2007; Sánchez-González et al., 2010; Vander-
feesten et al., 2008). For example, their separabil-
ity metric measures the amount of nodes which are
the only connection between two cohesive clusters of
nodes. They find, that size, separability and struc-
turedness are good indicators for errors, as they influ-
ence models complexity and thus understandability.
However, it is subject of further research to investi-
gate how these metrics can be adapted to metamodels.
8 CONCLUSION AND OUTLOOK
The proposed metric DM based on entropies of the
package structure strongly correlates with perceived
metamodel modularity, at least in the domains we
have analyzed. This is good, because this insight
helps to understand how modelers perceive the qual-
ity of metamodels. It is also a bad signal, because ap-
parently, at least the participants of our experiments
did not care about more subtle factors that influence
modularity, such as coupling. We suspect that this
is caused by the tooling, which puts focus on where
classes are placed in the package structure and what
kind of features they have, but puts no emphasis on
where relations point to with regard to the package
structure.
To obtain a meaningful quantitative analysis on
the quality of modularization for a given metamodel,
the DM-metric therefore has to be combined. In par-
ticular, the results from fitting linear regression mod-
els suggest that the DM metric makes up very roughly
a quarter of what is taken into consideration for the
perception of modularity.
The combination of this new metric DM with
slightly altered versions of the inheritance-based and
association-based coupling indices IC and AC we
presented earlier (Hinkel and Strittmatter, 2017) is
promising as these metrics may compensate each oth-
ers weaknesses. Both of these metrics favor different
extremes such that metamodels with a good modular-
ization may be detected, if both metrics are balanced.
Based on these results, we are hoping to con-
firm our results in larger applications. If this can
be done successfully, we are striving to integrate the
automated evaluation of metamodels into the meta-
model design process and into automated refactorings
of metamodels to improve the modularization.
ACKNOWLEDGEMENTS
This research has received funding from the European
Union Horizon 2020 Future and Emerging Technolo-
gies Programme (H2020-EU.1.2.FET) under grant
agreement no. 720270 (Human Brain Project SGA-I)
and the Helmholtz Association of German Research
Centers.
REFERENCES
Becker, S., Koziolek, H., and Reussner, R. (2009). The Pal-
ladio component model for model-driven performance
prediction. Journal of Systems and Software, 82:3–22.
Bertoa, M. F. and Vallecillo, A. (2010). Quality attributes
for software metamodels. In Proceedings of the
13th TOOLS Workshop on Quantitative Approaches
in Object-Oriented Software Engineering (QAOOSE
2010).
Bruneliere, H., Cabot, J., Jouault, F., and Madiot, F. (2010).
Modisco: a generic and extensible framework for
model driven reverse engineering. In Proceedings
of the IEEE/ACM international conference on Auto-
mated software engineering, ASE ’10, pages 173–
174, New York, NY, USA. ACM.
Bureš, T., Hnetynka, P., and Plášil, F. (2006). Sofa 2.0:
Balancing advanced features in a hierarchical compo-
nent model. In Proceedings of the fourth International
Conference on Software Engineering Research, Man-
agement and Applications, pages 40–48. IEEE.
Di Rocco, J., Di Ruscio, D., Iovino, L., and Pierantonio,
A. (2014). Mining metrics for understanding meta-
model characteristics. In Proceedings of the 6th In-
ternational Workshop on Modeling in Software Engi-
neering, MiSE 2014, pages 55–60, New York, NY,
USA. ACM.
Di Ruscio, D., Iovino, L., and Pierantonio, A. (2012). Evo-
lutionary togetherness: how to manage coupled evo-
lution in metamodeling ecosystems. In International
Conference on Graph Transformation, pages 20–37.
Springer.
Predicting the Perceived Modularity of MOF-based Metamodels
57

Fouquet, F., Nain, G., Morin, B., Daubert, E., Barais, O.,
Plouzeau, N., and Jézéquel, J.-M. (2014). Kevoree
Modeling Framework (KMF): Efficient modeling
techniques for runtime use. Technical report, SnT-
University of Luxembourg.
García-Magariño, I., Gómez-Sanz, J., and Fuentes-
Fernández, R. (2009). An evaluation framework for
mas modeling languages based on metamodel metrics.
Agent-Oriented Software Engineering IX, pages 101–
115.
Gómez, J. J. C., Baudry, B., and Sahraoui, H. (2012).
Searching the boundaries of a modeling space to test
metamodels. Software Testing, Verification, and Vali-
dation, 2008 International Conference on, 0:131–140.
Hinkel, G., Groenda, H., Krach, S., Vannucci, L., Den-
ninger, O., Cauli, N., Ulbrich, S., Roennau, A.,
Falotico, E., Gewaltig, M.-O., Knoll, A., Dillmann,
R., Laschi, C., and Reussner, R. (2016a). A Frame-
work for Coupled Simulations of Robots and Spiking
Neuronal Networks. Journal of Intelligent & Robotics
Systems.
Hinkel, G., Groenda, H., Vannucci, L., Denninger, O.,
Cauli, N., and Ulbrich, S. (2015). A Domain-Specific
Language (DSL) for Integrating Neuronal Networks
in Robot Control. In 2015 Joint MORSE/VAO Work-
shop on Model-Driven Robot Software Engineering
and View-based Software-Engineering.
Hinkel, G., Kramer, M., Burger, E., Strittmatter, M., and
Happe, L. (2016b). An Empirical Study on the Per-
ception of Metamodel Quality. In Proceedings of
the 4th International Conference on Model-driven
Engineering and Software Development (MODEL-
SWARD). Scitepress.
Hinkel, G. and Strittmatter, M. (2017). On Using Sarkar
Metrics to Evaluate the Modularity of Metamodels.
In Proceedings of the 5th International Conference
on Model-Driven Engineering and Software Develop-
ment.
Kounev, S., Brosig, F., Huber, N., and Reussner, R. (2010).
Towards self-aware performance and resource man-
agement in modern service-oriented systems. In Pro-
ceedings of the IEEE International Conference on
Services Computing (SCC), pages 621–624. IEEE.
Lehman, M., Ramil, J., Wernick, P., Perry, D., and Turski,
W. (1997). Metrics and laws of software evolution-the
nineties view. In Software Metrics Symposium, 1997.
Proceedings., Fourth International, pages 20–32.
Lehman, M. M. (1974). Programs, cities, students: Limits
to growth? (Inaugural lecture - Imperial College of
Science and Technology ; 1974). Imperial College of
Science and Technology, University of London.
Leitner, A., Weiß, R., and Kreiner, C. (2012). Analyzing
the complexity of domain model representations. In
Proceedings of the 19th International Conference and
Workshops on Engineering of Computer Based Sys-
tems (ECBS), pages 242–248.
López-Fernández, J. J., Guerra, E., and de Lara, J. (2014).
Assessing the quality of meta-models. In Proceedings
of the 11th Workshop on Model Driven Engineering,
Verification and Validation (MoDeVVa), page 3.
Ma, Z., He, X., and Liu, C. (2013). Assessing the qual-
ity of metamodels. Frontiers of Computer Science,
7(4):558–570.
Mendling, J. and Neumann, G. (2007). Error metrics for
business process models. In Proceedings of the 19th
International Conference on Advanced Information
Systems Engineering, pages 53–56.
Mendling, J., Neumann, G., and Van Der Aalst, W. (2007).
Understanding the occurrence of errors in process
models based on metrics. In On the Move to Meaning-
ful Internet Systems 2007: CoopIS, DOA, ODBASE,
GADA, and IS, pages 113–130. Springer.
Object Management Group (OMG) (2015). MOF 2.5 Core
Specification (formal/2015-06-05).
Pérez-Castillo, R., De Guzman, I., and Piattini, M. (2011).
Knowledge discovery metamodel-iso/iec 19506: A
standard to modernize legacy systems. Computer
Standards & Interfaces, 33(6):519–532.
Reussner, R. H., Becker, S., Happe, J., Heinrich, R., Kozi-
olek, A., Koziolek, H., Kramer, M., and Krogmann,
K. (2016). Modeling and Simulating Software Archi-
tectures – The Palladio Approach. MIT Press, Cam-
bridge, MA.
Sánchez-González, L., García, F., Mendling, J., Ruiz, F.,
and Piattini, M. (2010). Prediction of business process
model quality based on structural metrics. In Concep-
tual Modeling–ER 2010, pages 458–463. Springer.
Sarkar, S., Kak, A. C., and Rama, G. M. (2008). Metrics
for measuring the quality of modularization of large-
scale object-oriented software. Software Engineering,
IEEE Transactions on, 34(5):700–720.
Schmidt, D. C. (2006). Model-driven engineering. IEEE
Computer, 39(2):25.
The Object Management Group (2011). Business process
model and notation 2.0. http://www.bpmn.org/.
Vanderfeesten, I., Cardoso, J., Mendling, J., Reijers, H. A.,
and van der Aalst, W. (2007). Quality metrics for busi-
ness process models. BPM and Workflow handbook,
144.
Vanderfeesten, I., Reijers, H. A., Mendling, J., van der
Aalst, W. M., and Cardoso, J. (2008). On a quest for
good process models: the cross-connectivity metric.
In Advanced Information Systems Engineering, pages
480–494. Springer.
Vépa, E., Bézivin, J., Brunelière, H., and Jouault, F. (2006).
Measuring model repositories. In Proceedings of the
1st Workshop on Model Size Metrics.
Williams, J. R., Zolotas, A., Matragkas, N. D., Rose, L. M.,
Kolovos, D. S., Paige, R. F., and Polack, F. A. (2013).
What do metamodels really look like? In Proceedings
of the first international Workshop on Experiences and
Empirical Studies in Software Modelling (EESSMod),
pages 55–60.
MODELSWARD 2018 - 6th International Conference on Model-Driven Engineering and Software Development
58
