
Biological Network Modelling and Pathway Analysis
Ansam Al-Sabti
1
, Mohamed Zaibi
2
and Sabah Jassim
1
1
Department of Applied Computing, The University of Buckingham, Buckingham, U.K.
2
Buckingham Institute for Translational Medicine, The University of Buckingham, Buckingham, U.K.
{ansam.al-sabti, sabah.jassim, mohamed.zaibi}@buckingham.ac.uk
Keywords: Biological Network, Diabetes Mellitus, Dijkstras Algorithm.
Abstract: The search for disease-specific biomarkers for diagnosis, illness monitoring, therapy evaluation, and,
prognosis prediction is one of the major challenges in biomedical research. It has long been that diseases are
rarely caused by abnormality in a single protein, gene or cell. But by disorder of different processes
manifested by intracellular network of interactions between the molecular components in such biological
systems.
Despite the popularity of biological network analysis methods and increasing use for identifying genes or of
genes) that contribute to diseases and other biological processes, important topological and network
information are hardly used in ranking/assessing the relevance of the pathways. Often, gene expression
values and confidence score/strength of interactions are not considered when scoring/ranking the resulting
pathways. The research presented in this paper focuses on two different, but closely related areas in
Bioinformatics: developing new approaches for biological network analysis, and improving the
identification of biomarker discovery for disease classification. The inclusion of topological weight and
expression level in the calculation of pathways score is expected to facilitate the identification of the
pathways that most relevant to pathophysiological processes.
1 RESEARCH PROBLEM
Biological network analysis methods have been
incorporated in a number of proprietary and open-
source analysis tools, such as GeneNet, and
SBEToolbox, in order to link diseases to
abnormalities in pathways of proteins and genes
(Barab si et al., 2011). However, most adopted
biological network analysis methods did not take
into account the gene expression values but give
increased relevance to the number of differentially
expressed genes on the pathways, (see (Garmhausen
et al., 2015)). Moreover, proteins interaction
confidence scores that reflect the reliability/strength
of the interaction are ignored.
This problem is therefore concerned with
modelling and effectively using readily available
biological network information such as nodes fold
change values, edges confidence score, and node
degree (number of edges each node has) within a
computationally viable framework that facilitates the
efficient identification and analysis of essential
biological processes such as disease diagnosis.
2 OUTLINE OF OBJECTIVE
Mathematically, molecular interaction networks can
be represented as graphs with molecules as nodes
and interactions between the molecules as the edges.
We aim to investigate the use of graph algorithms to
search large-scale molecular network and reveal
some significant small sub-networks that are highly
expressed under a specific phenotype. Eventually,
machine learning could provide mechanisms to
identify some disease relevant clusters in interaction
network. The main short-term objectives of the
research reported in this project relate to three key
components:
Investigating and developing new
mathematical tools to improve the analysis of
high throughput Omics data with focus on
molecular interaction networks.
Investigating a range of scoring schemes for
identifying significant biologically relevant
pathways, subnetworks, and clusters.
Testing the performance and effectiveness of
our analysis approaches on more than one
database.
16
Al-Sabti, A., Zaibi, M. and Jassim, S.
Biological Network Modelling and Pathway Analysis.
In Doctoral Consortium (DCBIOSTEC 2017), pages 16-25

3 BIOLOGICAL NETWORKS
ANALYSIS MATERIALS AND
CHALLENGES
Over the last two decades, a great deal of effort has
been made to archive existing biological knowledge
in public databases, and provide tools to access,
retrieve, visualize the corresponding biologically
relevant knowledge. Indeed, a number of research
studies have shown that integrating high-throughput
Omics data with prior biological knowledge
(Network database) tend to be more informative and
give more meaningful analysis of the complex data.
The details of all materials that can be used in
biological network analysis is given in this section.
3.1 High-throughput Omics Data
Due to the feasibility of accessing and handling gene
expression data generated from microarrays, we will
use them in this analysis and to test our proposed
approaches. However, the same principles can be
applied on other type of transcriptional data such as
RNA-Seq or other molecular data such as proteins.
Gene expression datasets can be accessed and
downloaded from public databases such as GEO or
Array Express for microarray data.
3.2 Network Databases
Initially, we will focus on protein-protein interaction
network (PPI). Later on, the project can be expanded
to cover other types of networks. Due to the variety
of molecular interaction resources, we are planning
to use the PSICQUIC registry service, which enables
us to access and integrate networks from different
databases. This can be done programmatically using
web services provided by some programming
environment (e.g. perl) or via some tools such as
Cytoscope.
Most of the available protein protein interaction
(PPI) databases such as IntAct, MINT, and
BioGRID use a molecular interaction (MI) scoring
system which presents a normalized score (S
MI
)
calculating composite score for the interaction based
on three different factors can be listed as
experimental detection methods (m), the number of
publications (p), and interaction types (t). This score
is taking value between 0 and 1, and it reflects the
reliability of the specific interaction.
(1)
where:
Weight factor
Publication Score
Method Score
Type Score
For example the database with a score of >0.6 is
considered as high-confidence while 0.45-0.6 is
considered as medium confidence in the IntAct
database, but the users have the option to choice
their own threshold to filter the data when they are
using the search tool.
3.3 Challenges
Although biological networks can be represented as
graphs, different groups of network have different
characteristics. For example, graphs can be either
directed (e.g. gene-regulatory network, signalling
transduction network, and metabolic network) or
undirected (e.g. protein-protein interaction network)
depending on the nature of interactions between the
molecules. Biological networks should be handled
carefully and the main challenges can be
summarised as follows:
1. The complexity of molecular interaction
networks provides a big challenge to any
analysis approach due to different node sizes
and to complex graphical elements.
2. Some molecules such as proteins can be
involved in different cellular functions.
Therefore, traditional clustering methods
may not be appropriate in the PPI networks
because of overlapping clusters should be
identified with these kinds of networks.
3. Changes in mRNA levels may not reflect the
corresponding changes in protein levels
because of the protein degradation or
changing in translation.
4. It is very crucial to validate the outcome of
our analysis, which can be seen as another
source of challenge as it requires sometimes
further experiments in follow-up studies.
One of the major restriction in the improvement of
biological network methods is the limitation of
objective criteria to evaluate the quality of the
results. Our resolution is to choose a dataset series
that the molecular basis of pathogenesis is well-
established in that a powerful and testable outcome
providing.
Biological Network Modelling and Pathway Analysis
17

4 STATE OF THE ART
The high dimensionality and heterogeneity of
largescale Omics studies (genomics, transcriptomics,
proteomics, and metabolomics) are the most
researched challenging tasks in biomedical science.
Data complexities along with other issues such as
the high gene-to-sample ratio in transcriptomics
studies make biological network/data analysis a
daunting task.
Computational biomedical science has become
one of the most attractive research areas for
multidisciplinary teams of mathematicians,
computer scientists and biomedical scientists, to
develop aiding tools that help gain better
understanding of such complex data. A wide range
of studies has emerged gradually for identifying
genes or pathways (groups of genes) that contribute
to diseases and other biological processes; we follow
them by giving this matter a close attention and
studied.
Traditional analysis begins with the preproces-
sing of intensity values of raw images captured from
microarray experiments to extract expression values
for a set of probes, performing quality control,
filtering and normalizing gene expression data. This
is followed by conducting statistical tests for each
gene, comparing expression levels in different
groups. Finally, genes are sorted in ascending or
descending order of their p-values or fold change.
The most significant genes are then subjected to
clinical conditions or experimental validation and/or
used to generate biological hypotheses (Wang et al.,
2005; Van’t Veer et al., 2002). The outcome of this
process, known as molecular biomarkers discovery,
offers limited insight due to the fact that genes act in
consistent groups rather than alone.
Consequently, the attention shifted toward the
identification of a group of genes that interact
directly or indirectly in a pathway form with a focus
on the topology or the structural information
representing interactions between these genes. For
example, the number of connected genes and their
position to assess their association with complex
diseases and to provide more efficient and accurate
means for biomarker detection. A number of
pathway-based models have been developed over
the last several years, some of these methods focus
on the topology only in ranking pathways (Vert and
Kanehisa, 2003; Gao and Wang, 2007). While,
others combine the measurements of expression
changes among groups of genes, involved in
common pathways, with topology information
(Tarca et al., 2009).
Ibrahim et al. (2012) used fold-change and
topology information to identify a new logical
meaning of enriching pathway data. It integrates all
expressed genes with biological pathways to be
ranked using Z-score measurements that combine
the total number of expressed genes identified by the
microarray with the total number of genes that
exceed the fold change and p-value thresholds.
Selecting gene groups from highly scored pathways
are then used as biomarkers for disease conditions.
This Pathway Enrichment and Gene Network
Analysis (PEGNA) scheme and its MATLAB
implemented tool is an effective approach to
pathway-based analysis, which is the initial
motivation for our work.
Since the greatest number of human genes has
not been linked to a particular pathway and the easy
access to large protein networks, pathway-based
analysis has been extended to biological network
analysis in order to perform meaningful insight into
underlying biological processes and biomarker
discovery (Chuang et al., 2007). Recent
investigations developed a number of novel
modelling techniques as well as several MATLAB
and Java tools for analysing biological networks.
Konganti et al. (2013) proposed SBEToolbox
(Systems Biology and Evolution Toolbox), which is
a MATLAB toolbox for biological network analysis
that incorporates a wide range of user-controlled
functions. The input/output into/from this tool is
represented in four different formats: MAT,
tabdelimited, Pajeck, and SIF-file. The SBEToolbox
offers a collection of network visualization schemes
in different layouts such as Tree Ring and Circle,
and calculates a variety of centralities and
topological metrics like closeness centrality and
betweenness centrality. In addition, network’s graph
can be exported to external programs such as Pajek
and Cytoscape for further interpretation and
analysis. It adopts three different strategies for
clustering nodes into connected sub-networks:
ClusterOne, MCL, and MCODE (for more details
see (Konganti et al., 2013)). Notably, representing
the network interactions information as a sparse
adjacency matrix reduces the efficiency of this
method.
Taylor et al. (2015) have presented GeneNet
toolbox in MATLAB that provides functions that
enable users to assess connectivity among sets of
genes (seed-genes) within a biological network of
their choice. GeneNet offers two methods to
determine significant connection between selected
genes: Seed Randomization (SR) and Network
Permutation (NP). The seed genes should have
DCBIOSTEC 2017 - Doctoral Consortium on Biomedical Engineering Systems and Technologies
18
common attributes for example in a PPI, such as the
number of edges each node has, while the NP
scheme keeps the seed-genes same and permute the
network edges many times, however the network
must have sufficient number of permutations (As
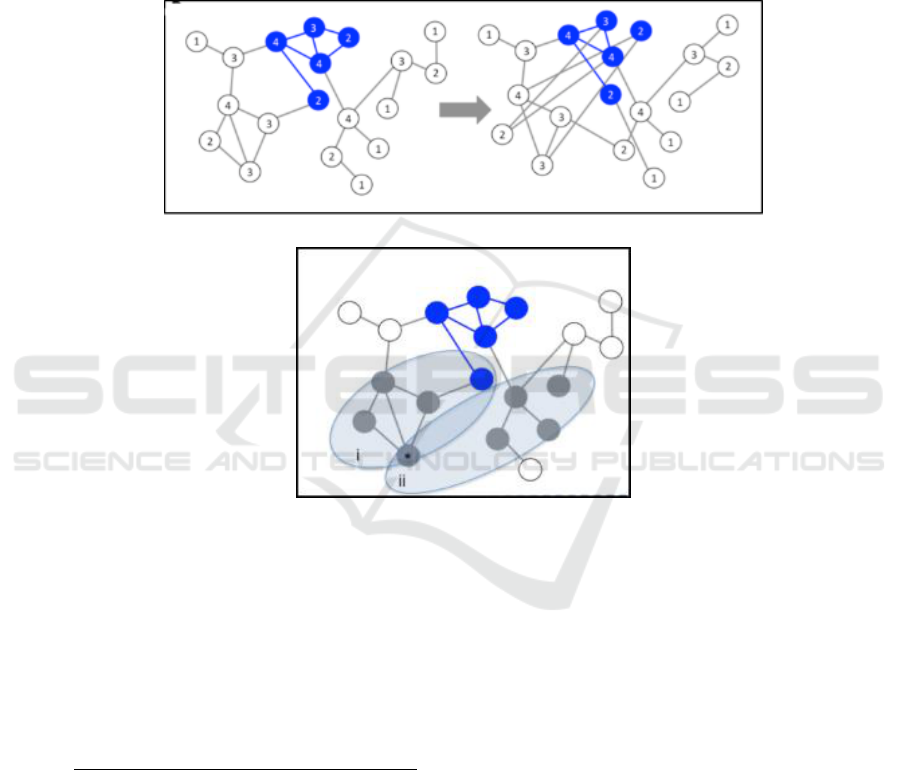
shown in Fig 1). An empirical P-value can be
calculated by comparing the connectivity of direct
seed to the random gene-sets connectivity in SR or
the connectivity of direct seed in real network to the
connectivity of permuted networks in NP.
Garmhausen et al. (2015) proposed a recursive
method for implementing Cytoscape plug-in called
viPEr (Virtual pathway explorer), restricted by the
maximum number of nodes and the numerical values
of the nodes (log2fold). It is used to create a focus
sub-network by integrating a list of significant genes
with the PPI of a specific organism. This plugin
offer 3 options:
Network permutation
Seed randomisation
Figure 1: The two main methods implemented in GeneNet Toolbox (this figure is adapted from Taylor et al. (2015)).
A to B: Finds all paths of length N between
two selected nodes. The search is stopped
when the maximum number of steps is
exceeded or the target node is reached, then
a path is stored and scored using formula 2.
The sub-network is created from all the
nodes in stored paths
(2)
Note that the gene expression value is
ignored so no difference between highly
expressed and not so highly expressed
genes as long as they pass a threshold.
Connecting in Batch: Finds all paths of
length N between two groups of nodes, by
calculating all paths between all members
of a starter list and a target list by using the
(A to B) search.
Environment Search: Creates a sub-
network of all outgoing length N paths
from a given node. Pathways that have two
consecutive nodes are not differentially
expressed, will be discounted.
This plugin has achieved some success in exploring
enrichment sub-networks by allowing for one
unregulated node in the resulting paths, the outcome
may restrict the accuracy of the results.
Notably, the research in the field of biological
systems is not restricted to develop some software
tools for visualizing and analysing biological
networks, several efforts have been carried out to
extract a rich information from these interactions
networks While some traditional methods ignored
non-differentially expressed genes (NDEGs), Zhang
Biological Network Modelling and Pathway Analysis
19

et al. (2014) developed a mathematical model to
identify edge biomarker based on differentially
correlated expression between two genes, which is
measured by Pearson correlation coefficient, and
demonstrated that the NGEDs can contribute to
classifying different phenotypes samples.
Genes are first sorted by the descending order of
their standard deviation values (SD) and excluding
20%, the lowest SD genes in normal or disease
groups. The P-values are calculated for the filtered
genes and genes with P-value >0.6 are chosen as
statistically non-differentially expressed genes. Then
the Pearsons correlation coefficient (PCC) are
computed for all possible pairs of NDEGs in normal
and diseased samples; the pairs of genes which have
are selected as differently correlated
gene pairs (DCPs). Each DCP pair of genes are then
transformed to two coupled edge features for the
normal and the diseased groups to be analysed by
machine Learning. The Fishers discriminant score is
used to rank the edge features decreasingly and get
the top score edge, then the wrapper method applied
to select the edge-biomarkers from the chosen set to
improve the prediction.
A key limitation of correlation networks research
is that edges are constructed using expression
correlation, with no background network informa-
tion, i.e. edges represent potential coexpression or
functional association among molecules rather than
physical interaction.
This is similar to the weighted correlation
network analysis (WGCNA) or functional
interaction with STRING database.
In this paper, we propose an expansion of the
approach developed by Garmhausen et al. (2015),
discussed above, by incorporating the actual gene
expression values as well as interaction information.
5 MICROARRAY DATA
PREPROCESSING AND
ANALYSIS
In this section, we present a brief overview of DNA
microarray technology with focus on the basic
principles of microarray techniques. We illustrate
the preprocessing of microarray raw data in order to
produce reliable gene expressions, for the diabetes
mellitus disorder as a case study. We shall
demonstrate our analytical approach by first
importing PPI network from public database, input
the network as a MATLAB variable, and using an
appropriate network search algorithm to search for
significant pathways, then ranking these pathways
by a new innovative score formula that reflects our
approach.
5.1 Microarray Technology
The second half of the 1990s had witnessed the
appearance of the novel technology of DNA
microarray. Microarray is defined as thousands of
spots each representing an identified sequenced
genes in a regular arrangement printed on a chip
made of glass or silicon at fixed grids.
Depending on the length of printed DNA
fragments, the technique used to spot the DNA on
the slide/chip and also the generated images.
Microarrays come in two commercial types that are
cDNA and Oligonucleotide arrays; cDNA is a
complementary DNA spot on a glass surface by
using highspeed robot. While, Oligonucleotide is a
short DNA oligonucleotides; represent single or
family of gene are spotted onto a solid support using
photolithographic masks and photo labile protecting
groups. For more details, the reader is referred to
(Pollack, 2007; Singh and Kumar, 2013).
A microarray technology can be divided into
three main steps: sample preparation, probes
labelling and hybridization and finally, image
scanning and data analysis. For our research we
focus on the last two steps when fluorescence
intensities are collected to produce two independent
tagged image file format (TIFF) for each channel.
The quantity of each transcript represented on the
chip can be calculated by measuring the intensity of
the spot on the image.
5.1.1 Case Study
Diabetes mellitus (DM) is a common serious
metabolic disease that results from different risk
factors such as a genetic predisposition, inheritance
environment interaction along with other sedentary
lifestyle and obesity. Increased hunger, and
increased thirst, lipids, impaired carbohydrates,
protein metabolism, high blood sugar that either
result of insulin action or insufficient insulin
production or both are the most important symptoms
of diabetes mellitus. There are two major types of
diabetes, insulindependent diabetes mellitus (type 1)
caused by pancreas failure to produce sufficient
insulin, and noninsulin-dependent diabetes mellitus
(type 2) that starts with insulin resistance when body
cells fail to respond to insulin properly (Ozougwu et
al., 2013; Wu et al.,2014; Lind et al., 2015). Our
objective is to analyse the molecular mechanism and
DCBIOSTEC 2017 - Doctoral Consortium on Biomedical Engineering Systems and Technologies
20
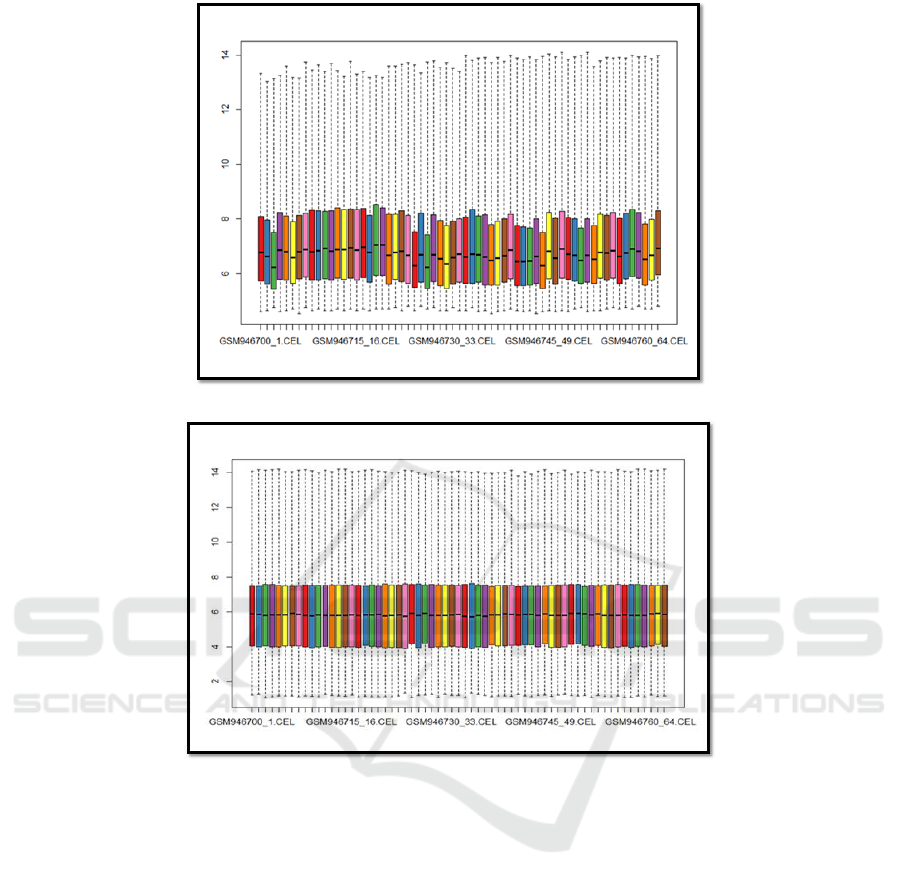
Unnormalised intensity values
Normalised intensity values
Figure 2: The effects of the RMA normalisation.
identify some biomarkers for type 2 diabetes
mellitus (T2DM) using a dataset created by Taneera
et al. (2012) who compared gene expression levels
in mRNA isolated from human pancreatic islets
taken from 63 donors (9 with type 2 diabetes
(T2DM) and 54 non-diabetic). The data were
hybridised to Robust Multi-array Analysis (RMA)
and Affymetrix Human Gene 1.0 ST to normalise
the expression values before uploading to the Gene
Expression Omnibus (http://www.ncbi.nlm.nih.gov/
geo/query/acc.cgi?acc=GSE38642). Notably, this
data has been used in other articles for different
purposes. For example Cui et al. (2016) used
expression profile of GSE38642 microarray to
analyse the pathogenesis of T2DM through
constructed differential expression network of
T2DM signature genes. These genes have been
screened by Affy package (R/Bioconductor) of R
language into three steps background adjustment,
quantile normalization and finally summarization,
and logarithmic transformation. Differentially
expressed genes (DEGs) analysis were applied using
Multiple Linear Regression Limma, with a threshold
of P<0.001 which identified 59 up- and 88 down-
regulated genes (total 147 DEGs).
We used the Affy package (R/Bioconductor) of
the R language to download the transcription profile
GSE38642 from GEO. Then the raw data (CEL
files) produced by the Affymetrix software and
contain an estimated intensity values of the probe
were preprocessed in three steps: (1) Remove
background effects to adjust observed intensities and
remove possible noise from the optical detection
system; (2) Normalize intensity values across the 63
arrays that may be caused by variations related to
laboratory conditions and hybridization reactions;
Biological Network Modelling and Pathway Analysis
21
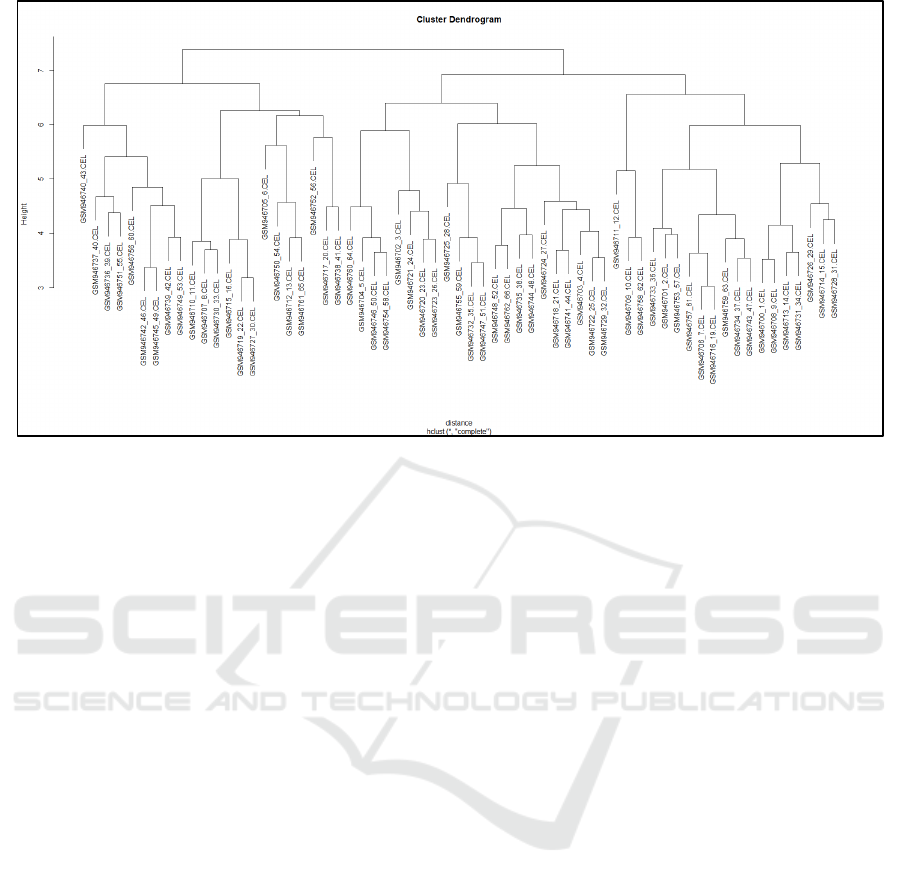
Figure 3: The relationships between the samples.
and (3) Summarize the normalized intensities into
one quantity that estimates the rate of the
proportional amount to the RNA transcript. All steps
used the oligo::rma package, and figure 2 shows the
output.
The intensities from all chips have brought into
similar distribution characteristics. The samples
were hierarchically clustered by tissue type and the
relationships between the clusters are shown in
figure 3. Prior to the differential gene expression
analysing, we used the nsFilter to remove
uninformative data, such as low intensity, empty and
bad quality spots as well as genes that have a low
variance or uniformly expressed. This resulted in the
removal of 16161 probe sets. A design matrix was
reconstructed with each row and each column
corresponding to an array and a coefficient that used
to describe the mRNA sources in the experiment
respectively. The expression data were fitted to the
multiple linear regression model which specified by
the design matrix using lmFit() in Limma package,
and Empirical Bayes statistical methods (eBayes ())
were applied for DEGs analysis. Then, a matrix with
gene level has obtained from a matrix with probe
level based on annotation files. The biomaRt
package have been used to map Ensembl Gene and
Uniprot Swissprot accessions to the 7572 differen-
tially expressed genes symbols that we assessed their
significance.
6 METHODOLOGY
Having reviewed above the recent biological
network analysis methods, our approach attempts to
achieve computational efficiency and address the
challenges raised above by appropriate incorporation
of nodes fold change values, edges confidence score,
and nodes degrees. The PPI network was obtained
from the open-access IntAct, MINT, Mentha, and
HPRD databases to provide molecular interaction
data with rich annotation. These databases use
UniProt as its main identifier type. The Cytoscape
Plugin BridgeDB have been used to map the listed
target proteins (UniProt ids) to Entrez IDs. The fold
change values from the microarray experiment are
assigned to the network nodes to be incorporated
into our new pathway scoring formula introduced
later. Then, the network is downloaded by using
Cytoscape in XML file format, and the information
were read into MATLAB. After removing
redundancies, a total of 339016 unique PPI pairs
have saved along with their confidence scores as
MAT-file. The file consists of two cell string vectors
stored all the edges and nodes information in the
network respectively. For efficiency, the adjacency
list were used to represent the interactions
information as a two-dimensional array, one for each
node label and another contains the labels of the
other nodes, which is connected to it by an edge, see
Figure 4.
DCBIOSTEC 2017 - Doctoral Consortium on Biomedical Engineering Systems and Technologies
22
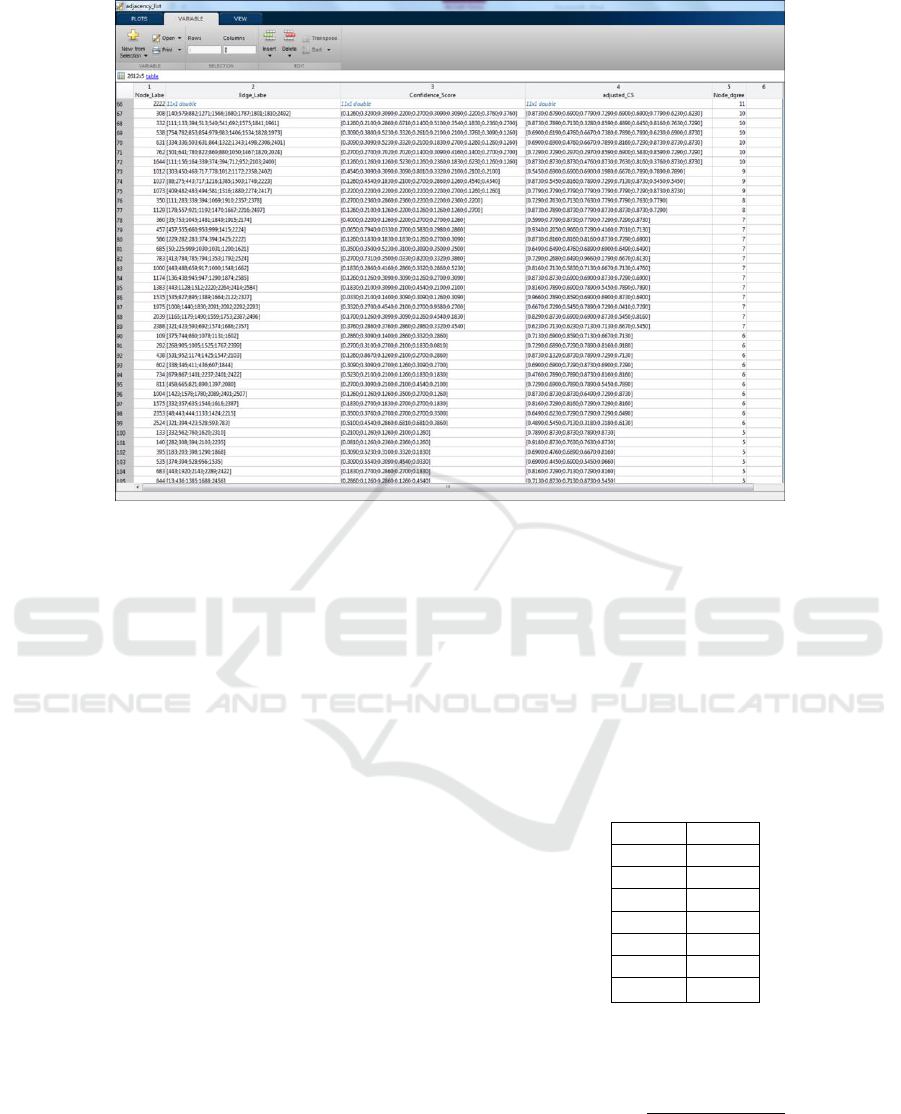
Figure 4: The network representation.
Next, we exploited Graph Theory to identify
certain clusters from the big network. For that
reason, we implemented one of a well-known
network searching technique known as the Dijkstras
algorithm. The Dijkstras algorithm recursively scans
all nodes in a network starting from a special node,
called the root, and creates a spanning tree of a
connected subnetwork consisting of all shortest
paths from the root. The link-distance of the path
refers to the total of costs labelling its edges. In our
case the root is chosen to be the highest degree node
ni which forms the initial tree with no edges. At each
subsequent step, the algorithm searches for a node
that can connect to the root, so far constructed tree
as long as the cost of connecting it creates the
shortest path and does not create acycle. Once such a
node is found it will be added to the current tree
together with its connecting edge. The search stops
when all the nodes of the specific subnetwork have
been connected to the tree. (For more details see
(Newman, 2010)).
Since, Dijkstras algorithm has taken the smallest
edge weight into account during its search for the
shortest paths across a subnetwork. We used the
edges confidence score after adjusting the values
according the formula 3:
(3)
where Max(CS) is the maximum confidence
score over all the network. To ensure selecting the
high confidence interaction between the proteins,
once the all shortest paths tree is constructed we
revert to the original edge confidence scores. As we
are interested in investigating the topological
relationships between the proteins and counting the
number of differential expression genes. We created
a score for each node by classifying their fold
change values known as Score* which can be
defined as follow:
Table 1: Fold change classification.
FC
Score*
0.6-0.8
1
0.8-1.0
2
1-1.2
3
1.2-1.4
4
1.4-1.6
5
1.6-1.8
6
….
...
Finally, we count the number of nodes on the
Dijkstra shortest paths and calculate their confidence
score by the following formula:
(4)
After running the Dijkstras algorithm we reveal all
outgoing paths of length N, from the selected node,
scored in three different categories: path length, path
confidence score, and the score calculated by
formula 4. By combining the path confidence scores
Biological Network Modelling and Pathway Analysis
23

and path score listed above in a weighted sum and
taking into account the path length, we can easily
filter those pathways to get the most significant and
highly scored ones. Next we plan to merge the top
scoring pathways in order to identify biomarkers that
are strongly correlated with diabetes mellitus type 2.
Finally, we should assess effectiveness of those
biomarkers, by measuring sensitivity and classify
accuracy criteria, we intend to use cross validation
and Support Vector Machine methods for that
purpose. In addition we will investigate the
outcomes by literature mining in order to prove their
relevance to the studied phenotype.
7 EXPECTED OUTCOME
The most important applications for biological
network modelling and pathway analysis are
biomarkers identification. In comparison to
traditional biomarkers discovery approaches which
handle genes/proteins individually. We argue that
integrating molecular data with prior biological
knowledge (i.e. pathways, Gene ontology (GO),
biological networks) will improve our understanding
of the underlying disease and provide us with more
accurate biomarkers for disease classification.
Moreover, grouping genes into clusters based on
similarity of their expression profiles can help
annotate or predict the function of some unknown
genes or proteins with unknown functions.
8 STAGE OF THE RESEARCH
At present, we have developed a new approach to
reveal some sub-networks and scoring them by own
formula. This is part of our attempt to identify some
biomarkers for diabetes mellitus type 2. After
assessing its success, we will implement this
approach to different public datasets. Furthermore,
we will seek to further tune our scoring system and
implement a tool to analyse biological networks to
overcome the limitations of existing analysis tools
through considering a number of factors such as
edges confidence score, nodes fold change values
and nodes degree. The implementation should
enable biomedical researchers to:
Import and merge molecular interaction
networks from different repositories.
Upload a list of genes/proteins with their
expression/fold change values and map
them onto the large merged network.
Use the proposed analysis approaches
according to own requirements and
assess their outcome in different textual
and visual manners.
The next immediate work will be to test the
perform-ance of our approach with the case study as
detailed at the end of the methodology section. We
shall also go beyond the case study by constructing a
correlation network for a PCR data conducted in
Buckingham Institute for Translational Medicine to
examine the effectof interleukin-1β (IL-1β) on the
expression of 84 cytokine and chemokine genes. In
this experiment, Alomar et al. (2015) focused on
measuring the effect of interleukin-1b on each single
gene and ignored the relation between them which
may lead to inhibited or exhibited the expression of
some those genes. We are interested in identifying a
subset of differentially correlated molecular pairs,
known as edge-biomarkers, and hope to propose a
new approach to representing edges between those
genes using Pearson correlation coefficient and one
of machine learning technique for feature selection.
ACKNOWLEDGMENTS
Ansam Al-Sabti was funded by a Ministry of Higher
Education and Scientific Research (MOHESR) of
Iraq studentship (number S1028), to whom we are
grateful. The authors are also grateful to Dr Maysson
Al-Haj Ibrahim for her support and mentorship at
the early stages of this project.
REFERENCES
Barab si, A.-L., Gulbahce, N., Loscalzo, J., 2011.
Network medicine: a network-based approach to
human disease. Nature Reviews Genetics 12 (1), 56–
68.
Chuang, H.-Y., Lee, E., Liu, Y.-T., Lee, D., Ideker, T.,
2007. Network-based classification of breast cancer
metastasis. Molecular systems biology 3 (1), 140.
Cui, Y., Chen, W., Chi, J., Wang, L., 2016. Differential
expression network analysis for diabetes mellitus type
2 based on expressed level of islet cells. In: Annales
d’endocrinologie. Vol. 77. Elsevier, pp. 22-29.
Gao, S., Wang, X., 2007. Tappa: topological analysis of
pathway phenotype association. Bioinformatics 23
(22), 3100–3102.
Garmhausen, M., Hofmann, F., Senderov, V., Thomas,
M., Kandel, B. A., Habermann, B. H., 2015. Virtual
pathway explorer (viper) and pathway enrichment
analysis tool (peanut): creating and analysing focus
DCBIOSTEC 2017 - Doctoral Consortium on Biomedical Engineering Systems and Technologies
24

networks to identify cross talk between molecules and
pathways. BMC genomics 16 (1), 790.
Ibrahim, M. A.-H., Jassim, S., Cawthorne, M. A.,
Langlands, K., 2012. A topology-based score for
pathway enrichment. Journal of Computational
Biology 19 (5), 563– 573.
Konganti, K., Wang, G., Yang, E., Cai, J. J., 2013.
Sbetoolbox: a matlab toolbox for biological network
analysis. Evolutionary Bioinformatics 9, 355.
Lind, M., Hirsch, I. B., Tuomilehto, J., Dahlqvist, S.,
Ahr n, B., Torffvit, O., Attvall, S., Ekelund, M.,
Filipsson, K., Tengmark, B.-O., et al., 2015. Lirag-
lutide in people treated for type 2 diabetes with
multiple daily insulin injections: randomised clinical
trial (mdi liraglutide trial).
Newman, M., 2010. Networks: an introduction. Oxford
university press.
Ozougwu, J., Obimba, K., Belonwu, C., Unakal-amba, C.,
2013. The pathogenesis and pathophysiology of type 1
and type 2 diabetes mellitus. Journal of Physiology
and Pathophysiolo-gy 4 (4), 46–57.
Pollack, J. R., 2007. A perspective on dna microarrays in
pathology research and practice. The American journal
of pathology 171 (2), 375–385.
Singh, A., Kumar, N., 2013. A review on dna microarray
technology. International Journal of Current Research
and Review 5 (22), 1.
Taneera, J., Lang, S., Sharma, A., Fadista, J., Zhou, Y.,
Ahlqvist, E., Jonsson, A., Lyssenko, V., Vikman, P.,
Hansson, O., et al., 2012. A systems genetics approach
identifies genes and pathways for type 2 diabetes in
human islets. Cell metabolism 16 (1), 122–134.
Tarca, A. L., Draghici, S., Khatri, P., Hassan, S. S., Mittal,
P., Kim, J.-s., Kim, C. J., Kusanovic, J. P., Romero,
R., 2009. A novel signaling pathway impact analysis.
Bioinformatics 25 (1), 75–82.
Taylor, A., Steinberg, J., Andrews, T. S., Webber, C.,
2015. Genenet toolbox for matlab: a flexible platform
for the analysis of gene connectivity in biological
networks. Bioinformatics 31 (3), 442–444.
Van’t Veer, L. J., Dai, H., Van De Vijver, M. J., He, Y.
D., Hart, A. A., Mao, M., Peterse, H. L., van der
Kooy,K., Marton, M. J., Witteveen, A. T., et al., 2002.
Gene expression profiling predicts clinical outcome of
breast cancer. nature 415 (6871), 530–536.
Vert, J. P., Kanehisa, M., 2003. Extracting active
pathways from gene expression data. Bioinfor-matics
19 (suppl 2), ii238–ii244.
Wang, Y., Klijn, J. G., Zhang, Y., Sieuwerts, A. M., Look,
M. P., Yang, F., Talantov, D., Timmermans, M.,
Meijervan Gelder, M. E., Yu, J., et al., 2005. Gene-
expression profiles to predict distant metastasis of
lymph-nodenegative primary breast cancer. The
Lancet 365 (9460), 671–679.
Wu, Y., Ding, Y., Tanaka, Y., Zhang, W., 2014. Risk
factors contributing to type 2 diabetes and recent
advances in the treatment and prevention. International
journal of medical sciences 11 (11), 1185.
Zhang, W., Zeng, T., Chen, L., 2014. Edgemarker:
identifying differentially correlated molecule pairs as
edgebiomarkers. Journal of theoretical biology 362,
35–43.
Biological Network Modelling and Pathway Analysis
25
