
Regulatory T cell Development in the Human Thymus
A Comprehensive Approach Combining Genome-wide Analysis and Single-cell
Protein Expression by Computational Flow Cytometry
Yumie Tokunaga, Helena Nunes-Cabaço, Ana Serra-Caetano, Henrique Machado,
Catarina Godinho-Santos and Ana E. Sousa
Instituto de Medicina Molecular, Faculdade de Medicina, Universidade de Lisboa, Lisboa, Portugal
yumie.tokunaga@medicina.ulisboa.pt
1 RESEARCH PROBLEM
The immune responses need to be tightly controlled
to avoid harmful effects. T cells are key players to
orchestrate these immune processes. There is one T
cell subset named regulatory T cells (Treg) devoted
to suppress immune responses, which is defined by
the expression of the transcription factor forkhead
box P3 (FOXP3). Tregs can develop either in the
thymus, the organ where T cells are produced, or be
generated during immune responses.
Thymic Tregs are considered particularly
important to ensure self-tolerance and prevent
autoimmunity. There are very few data regarding the
factors that determine the Treg lineage commitment
in the human thymus, as well as those that contribute
to their maintenance after leaving the thymus as
naïve Tregs. Naïve Tregs are known to continuously
replenish the memory fully suppressor Treg pool,
but the mechanisms involved in their maintenance
throughout life are largely unknown. Our main
objective is to investigate these processes by using
next-generation sequencing (NGS) and
computational flow-cytometry approaches.
The currently available NGS data from human
thymocytes are very limited. Additionally, flow-
cytometry analysis has been mainly done based on a
sequential gating strategy, which only focus on cell
populations identified by pre-defined cellular
markers. An unbiased approach will be more
effective for exploring unknown developmental
stages. Importantly, flow-cytometry generates multi-
parameter protein expression profiles at the single-
cell level. Applying computational analysis to these
single-cell high dimensional data will provide
relevant new relevant insights.
This study is expected to significantly improve
our understanding of human Treg development and
homeostasis, with implications for tolerance
induction and autoimmune diseases.
2 OUTLINE OF OBJECTIVES
The main objective of this project is to investigate
factors controlling regulatory T cell development in
the human thymus and the homeostasis of naïve
Tregs utilizing unbiased computational flow
cytometry analysis and NGS approaches.
We aim to generate data that will help answering
the following questions:
1. At which stage of T cell development can Treg
commitment occur in the human thymu?.
2. Which pathways play a critical role in Treg
lineage specification?
3. Which are the best epigenetic markers
associated with human Treg lineage stability?
4. Which mechanisms are involved in Treg
maturation both in the thymus and after thymus
egress as circulating naïve Tregs?
5. Which factors contribute to the maintenance of
circulating naïve Tregs, and what is the relative
contribution of homeostatic cytokines and of self-
peptides-MHC signaling?
The availability of whole-transcriptome data
from human thymocytes is currently limited.
We plan to characterize the transcriptome of
purified thymocyte populations along human T cell
development using NGS.
As a strategy to select the best markers to define
the populations to sort for the NGS studies, we will
use unbiased approaches for multicolor flow-
cytometry analysis that allow the analysis of the
continuous maturation process.
In order to unravel the biological factors of cell
fate stability we will also perform DNA methylation
studies. Given the putative role of non-coding
RNAs, samples will be collected to allow small
RNA-seq studies in the populations that we will
identify to be of particular relevance to investigate
Treg commitment.
The ultimate goal is to generate an integrated
model of human Treg development upon validation
Tokunaga, Y., Nunes-Cabaço, H., Serra-Caetano, A., Machado, H., Godinho-Santos, C. and Sousa, A.
Regulatory T cell Development in the Human Thymus - A Comprehensive Approach Combining Genome-wide Analysis and Single-cell Protein Expression by Computational Flow Cytometry.
In Doctoral Consortium (DCBIOSTEC 2017), pages 3-10
3

of the identified key molecules/pathways. These
studies will be combined with the evaluation of the
peripheral naïve T cell compartments.
3 STATE OF THE ART
Multipotent progenitors migrate from the bone
marrow to the thymus, where they generate T cells.
After commitment to the T cell lineage, triple
negative cells (CD3-CD4-CD8-) develop into
immature CD4 single positive (SP) cells, and
subsequently acquire CD8 becoming double positive
cells (DP) (Spits, 2002). During the DP stage there
is a progressive increase in CD3/T cell receptor
(TCR) expression. TCR recognition of self-peptides-
MHC is important for surviving (positive selection).
On the other hand, the cells with high TCR affinity
for self-antigen are eliminated (negative selection),
although the clearance of auto-reactive cells is not
complete (Starr, Jameson and Hogquist, 2003).
Finally they differentiate into CD4SP or CD8SP and
they mature in the thymic medulla before thymus
egress and incorporation in the naïve T cell pool.
Treg population is a subset defined by the
expression of the transcription factor FOXP3 that is
considered to be a main player in self-tolerance
(Hori, Nomura and Sakaguchi, 2003). Tregs
suppress many immune cells (Pandiyan et al, 2007;
Iikuni et al, 2009; Gotot et al, 2012; Ralainirina et al,
2007;Liu et al, 2009). There is currently intense
investigation to explore their function in innovative
clinical therapies for autoimmune diseases (Miyara,
Ito and Sakaguchi, 2014; Katzmann and Abbas,
2015; Spence et al, 2015), as well as in
transplantation (Tang and Bluestone, 2013) and
oncology (Wang, 2006).
Tregs are known to develop in the thymus or to
be generated during immune responses in the
periphery (Ito et al, 2008). There are no surface
markers to distinguish these two populations
(Povoleri et al, 2013). However, their TCR
repertoire appears to be distinct (Relland et al,
2012). Thymic Tregs are enriched in self-reactive
TCRs (Wong et al, 2007), but can also significantly
recognize broad microflora-derived antigens (Cebula
et al, 2013). Moreover, thymic Treg feature
epigenetic markers that are associated with a higher
phenotypical stability and function than peripheral
derived Treg (Ohkura et al, 2012). Therefore, thymic
Tregs are considered to be particularly dominant to
ensure self-tolerance and to prevent autoimmunity.
Regarding the thymic Treg development,
previous work has shown that both TCR stimulation
and cytokines, namely IL-2 and IL-15, are required
in the process (Caramalho et al, 2015a). IL-2 is also
known to regulate circulating Treg homeostasis (Yu
et al, 2009; Attridge et al, 2012). Recently, our lab
has showed that IL-7 also plays a determinant role in
naïve Treg maintenance (Silva et al, 2016).
However, it remains to be determined at which
stage cell differentiation fate toward Treg lineage
occurs, and which factors are implicated in these
processes in the human thymus (Caramalho et al,
2015b). Also, many questions remain unclear
regarding the mechanisms of their maintenance after
leaving the thymus and being incorporated in the
naïve Treg pool (Silva et al, 2016).
FOXP3 is considered the best available marker
to define this population, and, therefore, the
clarification of the mechanisms that regulate FOXP3
expression, including epigenetic control, is an
important research area (Kitagawa, Ohkura and
Sakaguchi, 2015). However, Tregs can develop in
mice without functional FOXP3 (Lin et al, 2007),
and other data support that the commitment to the
Treg lineage is independent of FOXP3 expression
(Wang, 2006). Our lab and others revealed that
FOXP3 is already expressed in early stages of T cell
development (Nunes-Cabaço et al, 2011), much
before the SP stage and migration to the thymic
medulla (Caramalho et al, 2015b). These results
emphasize the lack of knowledge regarding the
importance of FOXP3 in the Treg lineage
specification in the human thymus.
We hypothesize that other factors have a critical
role in triggering thymic Treg differentiation.
Furthermore, most of the available data are from
mouse thymus, and human studies are of utmost
importance given the known significant differences
between T cell development and homeostasis in the
two species (Caramalho et al, 2015b).
This study is expected to significantly improve
our understanding of human Treg development and
to identify new targets for the development of
immune-based therapies, useful not only for
autoimmune diseases, but also for other clinical
settings such as cancer, allergy and persistent
infections.
Regarding methodological aspects, single cell
analysis is of utmost importance to investigate
heterogeneous cell populations. Flow cytometry is a
potent technology to generate high dimensional data
of protein expression at single-cell level. Nowadays,
computational flow cytometry analysis tools have
been developed using many algorithms similar to
those used by other big data analysis for
visualization, classification and clustering (Saeys,
DCBIOSTEC 2017 - Doctoral Consortium on Biomedical Engineering Systems and Technologies
4

Gassen and Lambrecht, 2016). These techniques
allow a more clear separation of cell subpopulations
without the conventional use of biased sequential
gating approaches.
Although NGS is a high potential technology for
comprehensive analysis such as genome wide study,
there are very limited data regarding human
thymocytes and Tregs. This method enables to
predict genes or genome regions that have potential
to affect the function in genome-wide level (Wang,
Gerstein and Snyder, 2009; Nagalakshmi, Waern
and Snyder, 2010).
Those unbiased approaches will be of particular
relevance to investigate the process of Treg
commitment.
4 METHODOLOGY
The overall aim is to investigate human T cell
development, with a particular focus on Tregs.
Our laboratory has been generating a significant
amount of multicolor flow-cytometry data using
human thymic samples (Caramalho et al, 2015b;
Nunes-Cabaço et al, 2011; Mota et al, 2014). We
will take advantage of new software for analysis of
these data (Infinicyt software, Cytognos, Salamanca,
Spain), which will allow a better definition of
maturation curves of human thymocytes. This will
facilitate the identification of the best markers to be
used to define the thymocyte populations of interest
in our study. Moreover, we will use other
computational approach with R program for
investigation of the thymocyte cell populations from
a broad viewpoint.
Additionally, we plan to do an in silico analysis
of the public next generation sequencing (NGS) and
microarray datasets of thymocytes, although most
transcriptome analysis data were generated from
mouse samples, to make full use of the available
data to plan our NGS studies.
We will do whole transcriptome analysis of
human thymocyte populations to identify different
expressed genes and splicing variants by high depth
sequence data. Lineage cell commitment will be
further investigated using epigenetic studies
(Tarakhovsky, 2010; Cedar and Bergman, 2011).
Ultimately, we will validate the identified factors
and pathways using in-vitro assays, which have been
extensively used in our laboratory (Caramalho et al,
2015a; Silva et al, 2016; Nunes-Cabaço et al, 2011;
Mota et al, 2014). The comparison between
conventional and putative Treg populations will help
clarify the critical pathways for the specification and
maintenance of the Treg lineage.
It has been suggested that naïve T cells complete
their maturation process after thymus egress
(Boursalian et al, 2004). Therefore, we will also
compare mature single-positive thymocytes with
naïve T cells from peripheral blood of healthy
adults. These comparisons are expected to provide a
maturation profile from the T cell progenitors to
fully-mature naïve T cells.
Overall, according to our best knowledge, we
will generate the first comprehensive NGS data
regarding T cell development in the human thymus
as well as of thymic Treg lineage specification.
4.1 Human Samples and Ethical
Aspects
Thymic specimens are obtained from thymectomy
during pediatric corrective cardiac surgery
(newborns to 4-year old) at Santa Cruz Hospital,
after parents’ informed consent. Thymic tissue is
collected by clinical indication, and would be
otherwise discarded. Children with diseases
potentially involving the immune system such as
DiGeorge and Down syndromes are excluded.
The cord blood is obtained through a protocol
with the Obstetrician Department of the Centro
Hospitalar Lisboa Norte (CHLN), and the peripheral
blood from volunteer healthy donors after written
informed consent.
All samples were anonymized before use.
The study was approved by the Ethical Broads of
the Faculty of Medicine of Lisbon, of CHLN, and of
Santa Cruz Hospitals.
4.2 Flow Cytometry Analysis
Thymocyte and circulating T cell suspensions are
prepared and stained as previously described (Silva
et al, 2016; Nunes-Cabaço et al, 2011), using a
broad panel of markers to investigate the possible
maturation curves by multi-color flow-cytometry.
The analysis will be performed using the
software Infinicyt (Cytognos, Salamanca, Spain),
SPADE, tSNE, flowSOM and other algorithms. We
expect to identify the appropriate cell populations to
be used in the NGS studies.
Regulatory T cell Development in the Human Thymus - A Comprehensive Approach Combining Genome-wide Analysis and Single-cell
Protein Expression by Computational Flow Cytometry
5

4.3 Reanalyze the Microarray and
NGS Data of Public Databases
Related to T cell Development and
Tregs
We will reanalyze the whole transcriptome data of
microarray and NGS, including mice, in the public
databases (Shumway, Cochrane and Sugawara,
2009).
From public database such as GEO, ImmGen,
and ENCODE, we will collect the datasets of RNA-
seq data by NGS of murine thymocyte, microarray
data of human thymocyte and cord blood, and
reanalyze them to gather all the information
available. Also we will use histone modification data
of human thymocyte from Roadmap epigenome
project (Roadmap Epigenomics Consortium et al
2015), and integrate the gene expression data and
epigenetics data.
4.4 Cell Sorting
The identified cell populations, including both
putative Tregs and conventional T cells, will be sort-
purified by flow cytometry using FACSAria (BD
Bioscience).
4.5 Generation of NGS Data
We will extract RNA and DNA from the sorted
cells, and use next generation sequencer for RNA-
seq and small RNA-seq, as well as for the epigenetic
studies to be defined according to the preliminary
data obtained.
We plan to have at least three replicates of
each condition to strengthen the statistical analysis.
4.6 Bioinformatics Analysis
For the whole transcriptome analysis, the output data
from NGS will be processed using bioinformatics
tools.
The RNA sequencing reads will be check for
their qualities and filtered by quality check tools
such as FastQC. After that, they will be aligned to
the human genome to calculate the transcript
expression values by bioinformatics tools, such as
TopHat and Cufflinks, or discover the alternative
splicing transcripts by MISO. On the other hand,
small RNA-seq data will be aligned to the known
small RNAs from database using miRtools, or we
will predict novel small RNAs and their binding
target genes using Mirdeep2.
Regarding the epigenetic studies, we will decide
accordingly to the preliminary data obtained if it is
worth to perform a whole-based approach using BS-
seq or a more strategy focused on target regions of
interest. BS-seq is an approach to determine the
methylation site in genome wide level by bisulfite
treatment of DNA. In the BS-seq, the data is aligned
to the human genome by mapping tools and
methylated genome regions are detected by tools
such as Bismark and BSMAP. Additionally, we will
consider other genome-wide approaches to
investigate DNA methylation, as well as possibility
of including histone modification studies using
Chip-seq for revealing epigenetic regulation.
Data will be processed after establishing pipeline
optimized parameters of each bioinformatics tool.
We expect that integration of the results of
transcriptome and methylation or histone
modification data will identify several candidate
genes or genome regions.
4.7 Integrated in Silico Analysis
We will combine the results of whole transcriptome
and methylation/histone modification analysis, as
well as small RNA data, and screen for the more
influential factors from the possible candidates using
the relevant algorithms (Conesa et al, 2016). We will
compare results and predict the function of the
differential expressed transcripts or genome regions
and their impact on the biological mechanisms. With
these kinds of NGS data, we will combine the results
and identify the influential factors for Treg
development and homeostasis.
4.8 Validation Experiments
Finally, we will select the more relevant factors
likely to be involved in T cell/ Treg development
and naïve T cell/Treg homeostasis, and will validate
their expression by PCR and their function using the
appropriate in-vitro assays.
We will take full profit of the methodologies to
investigate Treg development and function
previously optimized in our laboratory (Caramalho
et al, 2015a; Silva et al, 2016; Nunes-Cabaço et al,
2011; Mota et al, 2014). In addition to the
investigation of the impact of TCR signaling and
cytokines, we will manipulate other possible
pathways that will be inferred from our data.
DCBIOSTEC 2017 - Doctoral Consortium on Biomedical Engineering Systems and Technologies
6
4.9 Human Treg Development Model
The combination of the flow cytometry and NGS
data will allow us to generate an integrated proposal
for Treg development in the human thymus that we
will test using mathematical modeling and system
immunology.
5 EXPECTED OUTCOME
We expect to identify the Treg subpopulations
including developmental stages by using
computational flowcytometry data analysis.
Additionally the combination of the flow cytometry
and NGS data will allow us to generate an integrated
proposal for Treg development in the human thymus
that we will test using mathematical modeling and
system immunology. These will improve our
knowledge of the commitment and maintenance of
Treg lineage.
6 STAGE OF THE RESEARCH
To investigate Treg differentiation process and
identify the cell populations for the NGS studies, we
used Infinicyt, flowSOM and SPADE to analyze
human thymus flow cytometry data.
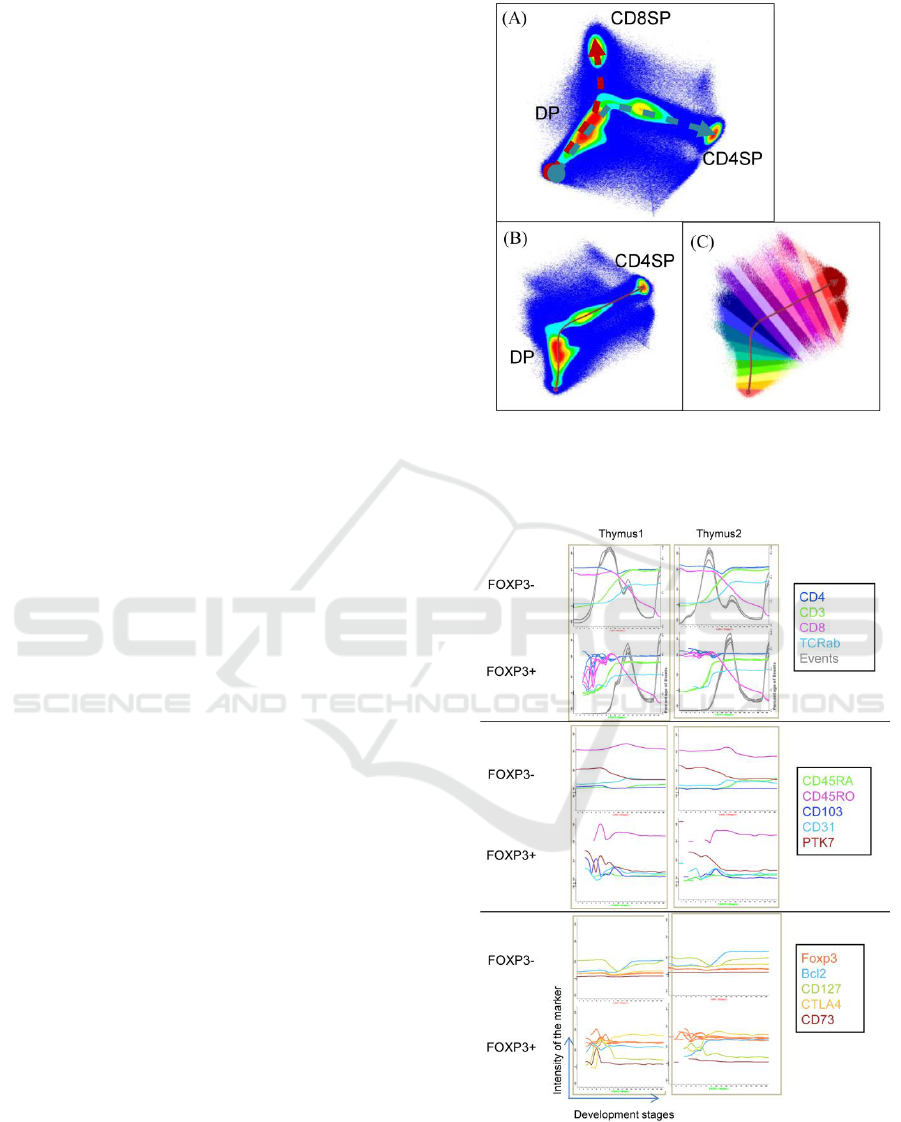
Firstly, we explored the Infinicyt software to
define cell maturation stages. In APS (Automatic
Population Separator), which is based on Principal
component analysis, the result build by the levels of
expression of CD3, CD4 and CD8 showed the two
maturation paths toward to CD4SP and CD8SP cells
(Figure 1).
Then we chose the one toward CD4SP, and
validated the maturation process using other well-
known developmental markers. This result suggests
that this APS build based on CD3, CD4 and CD8
enables the drawing of the maturation path.
Next, we gated in total FOXP3+ thymocytes and
FOXP3- thymocytes, and generated APS for
creating the respective maturation curves with these
populations.
The comparison of FOXP3+ and FOXP3-
thymocytes revealed differences along the
developmental stages regarding the expression level
of several markers (Figure 2), providing us with a
new tool to investigate these processes.
On the other hands FlowSOM and SPADE
allowed us to build spanning trees and the possibility
Figure 1: Maturation path toward to CD4SP and CD8SP
cells (A) and illustrative automatic distribution of the 20
stages of the CD4SP maturation path after excluding
CD8SP from the analysis (B, C).
Figure 2: Expression of different markers along the stages
of the maturation curve analysis of FOXP3+ cells and
FOXP3- cells. We draw the maturation path toward to
CD4SP in infinicyt both FOXP3- and FOXP3+ cells, and
the marker expression levels in each development stage
are calculated.
Regulatory T cell Development in the Human Thymus - A Comprehensive Approach Combining Genome-wide Analysis and Single-cell
Protein Expression by Computational Flow Cytometry
7

to analyze the branching of differentiation between
Treg and conventional T cell.
We were able to characterize each node
according to the levels of expression of the cellular
markers used (Figure 3).
This result suggests that not only cellular
markers but also Forward Scatter (FSC) and Side
Scatter (SSC) levels influence to the cell
population’s characterization. Therefore the physical
cellular size and complexity would be also important
to find the subpopulations in thymocytes.
Our strategy is to identify the cell populations of
Treg by spanning trees such as FlowSOM, and
analyze continuous maturation process by
maturation curves such as Infinicyt. We are
currently optimizing the best combinations of
markers to use in new flow cytometry tubes to fully
explore these tools.
Figure 3: Representative example of a spanning tree
generated using FlowSOM to analyze flow cytometry data
from total thymocytes isolated from human thymus. The
size of the circles corresponds to the number of events.
Each color identifies one marker and the height
corresponds to its level of expression.
Regarding RNA-seq analysis, we are using the
available human thymocyte data to build the analysis
pipeline and optimize it to identify different
transcriptome expression profiles, including splicing
variants between thymocyte cell populations of
interest.
Additionally, we picked up microarray data from
public database related to T cell development and
Treg for reanalysis. The comparison of the gene
expression profiles between thymocyte
developmental stages showed different expressed
genes related to ncRNA regulation, TCR signaling
and cytokine signaling pathways.
Also we used Treg cord blood and peripheral
blood data for comparing mature and immature Treg
gene expression profiles. In this case, the identified
different expressed genes were related to
mitochondrion, hemopoiesis, regulation of cell
death, zinc-finger.
We plan to further explore the role of these
pathways in the T cell and Treg development
processes.
REFERENCES
Attridge, K. et al., 2012. IL-21 inhibits T cell IL-2
production and impairs Treg homeostasis. Blood,
119(20), pp.4656–4664.
Boursalian, T.E. et al., 2004. Continued maturation of
thymic emigrants in the periphery. Nat Immunol, 5(4),
pp.418–425. Available at: http://dx.doi.org/10.1038/
ni1049.
Caramalho, Í. et al., 2015b. Regulatory T-Cell
Development in the Human Thymus. Frontiers in
immunology, 6. Available at: http://www.ncbi.nlm.
nih.gov/pubmed/26284077.
Caramalho, I. et al., 2015a. Human regulatory T-cell
development is dictated by Interleukin-2 and-15
expressed in a non-overlapping pattern in the thymus.
Journal of autoimmunity, 56, pp.98–110. Available at:
http://www.sciencedirect.com/science/article/pii/S089
6841114001668.
Cebula, A. et al., 2013. Thymus-derived regulatory T cells
contribute to tolerance to commensal microbiota.
Nature, 497(7448), pp.258–62. Available at:
http://www.pubmedcentral.nih.gov/articlerender.fcgi?a
rtid=3711137&tool=pmcentrez&rendertype=abstract.
Cedar, H. & Bergman, Y., 2011. Epigenetics of
haematopoietic cell development. Nature reviews.
Immunology, 11(7), pp.478–88. Available at:
http://www.ncbi.nlm.nih.gov/pubmed/21660052.
Conesa, A. et al., 2016. A survey of best practices for
RNA-seq data analysis. Genome Biology, 17(1), p.13.
Available at: http://genomebiology.com/2016/17/1/13.
Gotot, J. et al., 2012. Regulatory T cells use programmed
death 1 ligands to directly suppress autoreactive B
cells in vivo. Proceedings of the National Academy of
Sciences, 109(26), pp.10468–10473.
Hori, S., Nomura, T. & Sakaguchi, S., 2003. Control of
regulatory T cell development by the transcription
factor Foxp3. Science, 299(5609), pp.1057–1061.
Available at: http://eutils.ncbi.nlm.nih.gov/entrez/
eutils/elink.fcgi?dbfrom=pubmed&id=12522256&ret
mode=ref&cmd=prlinks%5Cnpapers3://publication/do
i/10.1126/science.1079490.
Iikuni, N. et al., 2009. Cutting edge: Regulatory T cells
directly suppress B cells in systemic lupus
erythematosus. Journal of immunology, 183(3),
pp.1518–22. Available at: http://www.pubmedcentral.
DCBIOSTEC 2017 - Doctoral Consortium on Biomedical Engineering Systems and Technologies
8

nih.gov/articlerender.fcgi?artid=2730469&tool=pmce
ntrez&rendertype=abstract.
Ito, T. et al., 2008. Two functional subsets of FOXP3+
regulatory T cells in human thymus and periphery.
Immunity, 28(6), pp.870–80. Available at:
http://www.pubmedcentral.nih.gov/articlerender.fcgi?a
rtid=2709453&tool=pmcentrez&rendertype=abstract.
Kitagawa, Y., Ohkura, N. & Sakaguchi, S., 2015.
Epigenetic control of thymic Treg-cell development.
European Journal of Immunology, 45(1), pp.11–16.
Klatzmann, D. & Abbas, A.K., 2015. The promise of low-
dose interleukin-2 therapy for autoimmune and
inflammatory diseases. Nature reviews. Immunology,
15(5), pp.283–94. Available at: http://
www.nature.com.gate1.inist.fr/nri/journal/v15/n5/full/
nri3823.html.
Lin, W. et al., 2007. Regulatory T cell development in the
absence of functional Foxp3. Nature immunology,
8(4), pp.359–368.
Liu, Z. et al., 2009. Treg suppress CTL responses upon
immunization with HSP gp96. European Journal of
Immunology, 39(11), pp.3110–3120.
Miyara, M., Ito, Y. & Sakaguchi, S., 2014. TREG-cell
therapies for autoimmune rheumatic diseases. Nature
reviews. Rheumatology, 10(9), pp.543–51. Available
at: http://www.ncbi.nlm.nih.gov/pubmed/24980140.
Mota, C. et al., 2014. Delta-like 1-Mediated Notch
Signaling Enhances the In Vitro Conversion of Human
Memory CD4 T Cells into FOXP3-Expressing
Regulatory T Cells. The Journal of Immunology,
193(12), pp.5854–62. Available at: http://
www.jimmunol.org/content/193/12/5854.full.
Nagalakshmi, U., Waern, K. & Snyder, M., 2010. RNA-
seq: A method for comprehensive transcriptome
analysis. Current Protocols in Molecular Biology,
(SUPPL. 89).
Nunes-Cabaço, H. et al., 2011. Differentiation of human
thymic regulatory T cells at the double positive stage.
European journal of immunology, 41, pp.3604–3614.
Available at: http://onlinelibrary.wiley.com/doi/
10.1002/eji.201141614/full.
Ohkura, N. et al., 2012. T Cell Receptor Stimulation-
Induced Epigenetic Changes and Foxp3 Expression
Are Independent and Complementary Events Required
for Treg Cell Development. Immunity, 37(5), pp.785–
799.
Pandiyan, P. et al., 2007. CD4+CD25+Foxp3+ regulatory
T cells induce cytokine deprivation-mediated
apoptosis of effector CD4+ T cells. Nature
immunology, 8(12), pp.1353–1362.
Povoleri, G.A.M. et al., 2013. Thymic versus induced
regulatory T cells-who regulates the regulators?
Frontiers in Immunology, 4(JUN), pp.1–22.
Ralainirina, N. et al., 2007. Control of NK cell functions
by CD4+CD25+ regulatory T cells. J Leukoc Biol,
81(1), pp.144–153. Available at: http://
www.jleukbio.org/cgi/content/abstract/81/1/144%5Cn
http://www.jleukbio.org/cgi/reprint/81/1/144.pdf.
Relland, L.M. et al., 2012. The TCR repertoires of
regulatory and conventional T cells specific for the
same foreign antigen are distinct. Journal of
immunology, 189, pp.3566–74. Available at:
http://www.pubmedcentral.nih.gov/articlerender.fcgi?a
rtid=3538134&tool=pmcentrez&rendertype=abstract.
Roadmap Epigenomics Consortium, et al., 2015.
Integrative analysis of 111 reference human
epigenomes. Nature, 518(7539), pp.317–330.
Available at:
http://www.ncbi.nlm.nih.gov/pubmed/25693563.
Saeys, Y., Gassen, S. Van & Lambrecht, B.N., 2016.
Computational flow cytometry: helping to make sense
of high-dimensional immunology data. Nature
Reviews Immunology. Available at: http://
www.nature.com/doifinder/10.1038/nri.2016.56.
Shumway, M., Cochrane, G. & Sugawara, H., 2009.
Archiving next generation sequencing data. Nucleic
Acids Research, 38(SUPPL.1), pp.2009–2010.
Silva, S.L. et al., 2016. Human naive regulatory T-cells
feature high steady-state turnover and are maintained
by IL-7. Oncotarget.
Spence, A. et al., 2015. Targeting Treg signaling for the
treatment of autoimmune diseases. Current Opinion in
Immunology, 37, pp.11–20.
Spits, H., 2002. Development of αβ t cells in the human
thymus. Nature Reviews Immunology, 2(10), pp.760–
772. Available at: http://www.nature.com/doifinder/
10.1038/nri913.
Starr, T.K., Jameson, S.C. & Hogquist, K.A., 2003.
Positive and negative selection of T cells. Annu Rev
Immunol, 21, pp.139–176. Available at: http://
www.ncbi.nlm.nih.gov/entrez/query.fcgi?cmd=Retriev
e&db=PubMed&dopt=Citation&list_uids=12414722.
Tang, Q. & Bluestone, J.A., 2013. Regulatory T-cell
therapy in transplantation: Moving to the clinic. Cold
Spring Harbor Perspectives in Medicine, 3(11).
Tarakhovsky, A., 2010. Tools and landscapes of
epigenetics. Nature immunology, 11(7), pp.565–568.
Available at: http://dx.doi.org/10.1038/ni0710-565.
Wang, R.-F., 2006. Regulatory T cells and toll-like
receptors in cancer therapy. Cancer research, 66(10),
pp.4987–90. Available at: http://www.ncbi.nlm.
nih.gov/ pubmed/16707417.
Wang, Z., Gerstein, M. & Snyder, M., 2009. RNA-Seq: a
revolutionary tool for transcriptomics. Nature reviews.
Genetics, 10(1), pp.57–63. Available at: http://
www.ncbi.nlm.nih.gov/pubmed/19015660.
Wong, J. et al., 2007. Adaptation of TCR repertoires to
self-peptides in regulatory and nonregulatory CD4+ T
cells. Journal of immunology, 178(11), pp.7032–7041.
Available at: papers2://publication/uuid/C9A56955-
F35C-4DA9-BAE2-4C050A1104EC.
Yu, A. et al., 2009. A Low Interleukin-2 Receptor
Signaling Threshold Supports the Development and
Homeostasis of T Regulatory Cells. Immunity, 30(2),
pp.204–217. Available at: http://dx.doi.org/10.1016/
j.immuni.2008.11.014.
Regulatory T cell Development in the Human Thymus - A Comprehensive Approach Combining Genome-wide Analysis and Single-cell
Protein Expression by Computational Flow Cytometry
9

APPENDIX
Funding from the European Union's Horizon 2020
research and innovation programme under the Marie
Skłodowska-Curie grant agreement No.: 675395
DCBIOSTEC 2017 - Doctoral Consortium on Biomedical Engineering Systems and Technologies
10
