
PerDMCS: Weighted Fusion of PPG Signal Features for Robust and
Efficient Diabetes Mellitus Classification
V. Ramu Reddy
1
, Anirban Dutta Choudhury
2
, Srinivasan Jayaraman
1
, Naveen Kumar Thokala
1
,
Parijat Deshpande
3
and Venkatesh Kaliaperumal
4
1
TCS Research & Innovation Lab, Bangalore, India
2
TCS Research & Innovation Lab, Kolkata, India
3
TRDDC, Pune, India
4
Institute of Ayurveda and Integrative Medicine, School of Health Sciences, Transdisciplinary University, Bangalore, India
Keywords:
Pervasive Healthcare, Type 2, Diabetes Mellitus, Classification, Heart Rate Variability, Fusion, Photoplethys-
mogram, Pulse Oximeter, Morphological.
Abstract:
Non-invasive detection of Diabetes Mellitus (DM) has attracted a lot of interest in the recent years in pervasive
health care. In this paper, we explore features related to heart rate variability (HRV) and signal pattern of the
waveform from photoplethysmogram (PPG) signal for classifying DM (Type 2). HRV features includes time-
domain (F
1
), frequency domain (F
2
), non-linear features (F
3
) where as waveform features (F
4
) are one set of
features such as height, width, slope and durations of pulse. The study was carried out on 50 healthy subjects
and 50 DM patients. Support Vector Machines (SVM) are used to capture the discriminative information
between the above mentioned healthy and DM categories, from the proposed features. The SVM models
are developed separately using different sets of features F
1
, F
2
, F
3
,and F
4
, respectively. The classification
performance of the developed SVM models using time-domain, frequency domain, non-linear and waveform
features is observed to be 73%, 78%, 80% and 77%. The performance of the system using combination of
all features is 82%. In this work, the performance of the DM classification system by combining the above
mentioned feature sets with different percentage of discriminate features from each set is also examined.
Furthermore weight based fusion is performed using confidence values obtained from each model to find the
optimal set of features from each set with optimal weights for each set. The best performance accuracy of
89% is obtained by scores fusion where combinations of mixture of 90% features from the feature sets F
1
and
F
2
and mixture of 100% features from the feature sets F
3
and F
4
, with fusion optimal weights of 0.3 and 0.7,
respectively.
1 INTRODUCTION
Diabetes is a malfunction of glucose-insulin regula-
tory system that leads to onset of various complica-
tions. It has been recognized as fourth leading cause
of death in developed countries (Tabish, 2007). From
the recorded data in health centres worldwide it is
predicted that it is reaching epidemic proportions in
many developing and newly industrialized nations. In
terms of diabetic population, the top three countries
in the world are China, India and USA (Collabora-
tion et al., 2016). In India it has shot up from 11.9
million in 1980 to 64.5 million in 2014. Interna-
tional Diabetes Federation (IDF), has raised a serious
alarm for India by saying that nearly 52% of Indians
are not aware that they are suffering from high blood
sugar and it is expected to cross 100 million mark
by 2030
1
. Risk of cardiovascular disease (CVD) is
two or four times greater for diabetic individuals than
normal ones and there is a trend in increased risk of
cardiac mortality
2
However, till date there is limited
medical equipment and awareness of the severity of
this disease largely aggravated due to prevalence of
bad diet, no physical exercise, abnormal body weight,
and use of tobacco. Furthermore, the symptoms of
cardiac patients and diabetes patients are similar due
1
http://ccebdm.org/news.php
2
www.world-heart-feaderation.org/cardiovascular-disease-
risk-factors/diabetes/
Reddy V., Dutta Choudhury A., Jayaraman S., Kumar Thokala N., Deshpande P. and Kaliaperumal V.
PerDMCS: Weighted Fusion of PPG Signal Features for Robust and Efficient Diabetes Mellitus Classification.
DOI: 10.5220/0006297205530560
Copyright
c
2017 by SCITEPRESS – Science and Technology Publications, Lda. All rights reserved

to change in the arterial stiffness and hence likely
to be mis-classified. The symptoms of this disease
are high blood sugar include frequent urination, in-
creased thirst, and increased hunger. If left untreated
it results in long-term complications include heart dis-
ease, stroke, chronic kidney failure, foot ulcers, and
damage to the eyes.
These problems are addressed by few existing so-
lutions; such as C-peptide test, fasting plasma glucose
test, GAD antibodies test, Hba1c test, oral glucose
tolerance test, type-2 diabetes indication test (Asso-
ciation et al., 2015). It should be noted that most of
the above-mentioned technique are either invasive or
minimal invasive (finger prick) in nature. This study
aims to identify the individual’s diabetic status by as-
sessing the vascular pulse function and other vital fea-
tures by using the non-invasive PPG signal. In ad-
dendum, continuous monitoring of diabetes patients
can aid in assisting the short and long-term compli-
cation risks as well. Hence, there is an inherent de-
mand to explore the feasibility for the continuous,
non-invasive monitoring and estimation of the type
2 diabetes. In (Schroeder et al., 2005), (Seyd et al.,
2012) researchers had explored diabetes detection us-
ing HRV features from the time domain, in (Elgendi,
2012) Mohamed has explored PPG features and its
applications where as Rohan et al has identified HRV
and pulse waveform features for identifying coronary
artery disease (Banerjee et al., 2016).
Non-invasive, quick, easy, low cost and on time
recognizingdiabetes with simple method and portable
technology for the primary care and community-
based clinical settings is the main goal of researchers
in this area. The pulse plethysmogram technology
has been used in a wide range of commercially avail-
able medical devices for measuring oxygen satura-
tion, blood pressure and cardiac output (Allen, 2007).
Due to change in glucose level, the amount of blood
volume in the finger changes, this variation can be
measured by PPG. When a fixed source of infrared
radiation is used, the variation of blood volume act
as a phototransistor and the receive signal is changed.
This is why we use the PPG signal for identifying the
diabetic subjects. In this work a low-cost FDA ap-
proved pulse oximeter is used to collect vital physio-
logical signal such as PPG signal from finger. Heart
rate variability (HRV) features from the time domain
along with some useful features related to shape of the
pulse (morphological information) are extracted from
PPG to discriminate healthy and diabetic subjects. In
addition to the above features we have also explored
other HRV features extracted from the frequency do-
main, non-linear and poincare features. Our data-
driven approach enables visualization of PPG signals
and captures specific features such as heart rate vari-
ability (HRV) and features related to shape of the
pulse from PPG signal related to change in blood flow
which in turn caused due to change arterial stiffness
due to diabetes. We have developed pervasive dia-
betes mellitus classification system (PerDMCS) and
has achieved an accuracy of 82%, sesitivity 84% and
specificity 90% using above mentioned features. Fur-
ther weight based fusion technique is proposed for
more robust detection of diabetes. Field data shows
this method works properly and achieved an improved
accuracy of 89% with sensitivity and specificity of
90% and 88%, respectively.
2 DIABETES MELLITUS
DATASET
In this study, we have collected data from 50 con-
firmed diabetic patients and 50 healthy subjects. Di-
abetic subjects were aged between 34 ± 10 years
where as healthy subjects were aged between 41 ±
13. The subjects are selected from IAIMS Research
Center located in Bangalore, India. Experimentalpro-
tocol has been approved by the hospital ethical com-
mittee. PPG data were collected from right hand
index finger of each subject for 5 minutes using a
USB based commercial pulse oximeter (Contec CMS
50D+
3
) at 60 Hz.
3 PRE-PROCESSING
The collected PPG data is fed as an input to the pre-
processing block to obtain accurate RR intervals as
an output. This is achieved by following the sequence
of steps like baseline removal, peak detection and re-
moval of outliers obtained due to motion artifacts.
The signals obtained across each stage are also de-
picted in Fig. 1, where Fig. 1(a) represents raw PPG
signal obtained during data collection and Fig. 1(b) is
the corresponding PPG signal obtained after baseline
drift removal followed by peak detection. The region
where erroneous peak is obtained due to motion arti-
fact is marked with an elliptical region in Fig. 1(b).
Subsequently, peaks are calculated to obtain the RR
intervals and the outliers of RR intervals are then re-
moved. The steps involved in pre-processingstage are
briefly discussed as follows:
• Baseline Removal: The baseline removal on the
PPG signal is carried out using beads technique
(Ning et al., 2014).
3
http://www.contecmed.com/
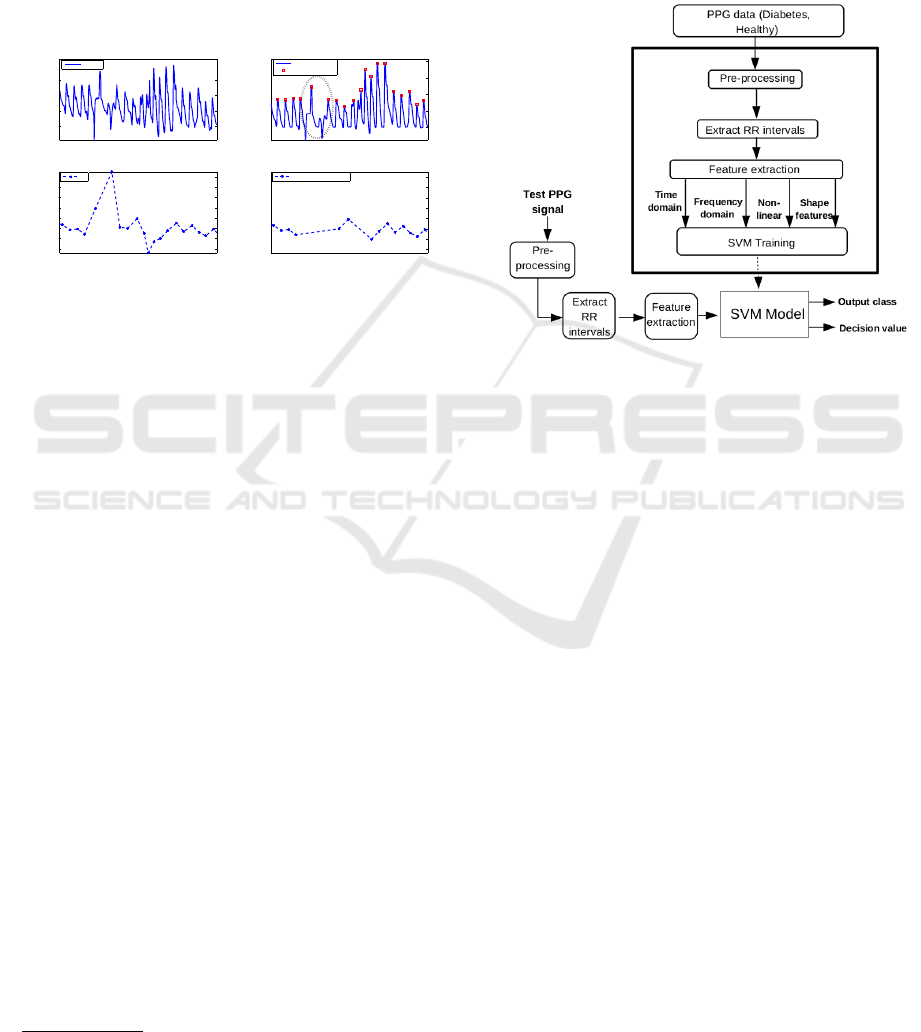
• Peak Detection: The peak detection is carried out
on the baseline removal of PPG signal using peak
detection algorithm.
• Outlier Removal: After peak detection, RR in-
tervals are computed from peak to peak intervals.
The outlier RR intervals resulted due to motion ar-
tifacts are removed using the percentage filter. As
mentioned in
4
if the percentage change of suc-
ceeding RR interval from the preceding RR inter-
val is greater than 20% can be treated as an outlier.
00:00:00 00:00:20
20
40
60
80
Time (hh:mm:ss)
Amp. (mV)
00:00:00 00:00:20
0
20
40
60
80
Time (hh:mm:ss)
Amp. (mV)
00:00:00 00:00:20
0.6
0.8
1
1.2
1.4
1.6
1.8
2
Time (hh:mm:ss)
RR (s)
00:00:00 00:00:20
0.6
0.8
1
1.2
1.4
1.6
1.8
2
Time (hh:mm:ss)
RR (s)
Drift removal PPG
Peaks
raw PPG
RR
RR after Outlier removal
(a)
(c)
(d)
Figure 1: (a) Raw PPG signal, (b) Baseline drift PPG signal
(c) RR intervals and (d) RR intervals after Outlier removal.
After preprocessing different features were ex-
tracted as shown in Table 1.
4 NUMERICAL RESULTS
In this work, Support Vector Machines (SVM) are ex-
plored to discriminate the diabetic and healthy sub-
jects. SVM classification is an example of super-
vised learning. SVMs are useful due to their wide
applicability for classification tasks in many signal
processing applications such as emotion recognition
(Koolagudi et al., 2010), crowd noise and activ-
ity classifications (Reddy et al., 2013) (Reddy and
Chattopadhyay, 2014), and physiological signal based
CAD detection (Banerjee et al., 2016). A classifi-
cation task usually involves training and testing data
which consist of some data instances. In the training
set, each instance contains one target class label and
many attributes. The main goal of SVM for classifi-
cation problem is to produce a model which predicts
target class label of data instances in the testing set,
given only the attributes. The SVM model was de-
veloped as-one against-rest principle by using feature
vectors derived from the intended class as positive ex-
amples and the feature vectors derived from the other
class as negative examples.
Radial Basis Function (RBF) is used in this work.
This is because RBF, unlike linear kernel can handle
4
http://circ.ahajournals.org/content/93/5/1043
the case where the relationship between the class la-
bels and attributes is non-linear. Another advantage
of RBF kernel is its universal approximation prop-
erties. Also, it offers good generalization as well
as good performance in solving practical problems
(Reddy et al., 2014). The basic architecture of dia-
betes mellitus classification system using SVMs with
above mentioned features is shown in Fig. 2.
Figure 2: Architecture of Pervasive Diabetes Mellitus Clas-
sification System (PerDMCS).
In this study, 100 subjects of data is used out of
which 50 subjects are healthy and 50 are diabetic. We
have used 5-fold validation technique where 4 folds
are used for training and remaining fold is used for
testing.
In this work, we first analyzed the capability of
individual feature sets F
1
, F
2
, F
3
and F
4
for discrimi-
nating the diabetes and healthy. Five DMCS systems
are developed, which are summarized as follows:
1. PerDMCS-1: Pervasive diabetes mellitus classifi-
cation system using F
1
features.
2. PerDMCS-2: Pervasive diabetes mellitus classifi-
cation system using F
2
features.
3. PerDMCS-3: Pervasive diabetes mellitus classifi-
cation system using F
3
features.
4. PerDMCS-4: Pervasive diabetes mellitus classifi-
cation system using F
4
features.
5. PerDMCS-5: Pervasive diabetes mellitus classifi-
cation system using combination of all features.
Performance of the pervasive DMCSs using the
features discussed earlier, is represented in the form
of a consolidated confusion matrix as shown in Table
2. The diagonal elements of the confusion matrix rep-
resent the correct classification performance of class.
Non-diagonal elements indicate the performance of

Table 1: List of Features.
Name Description
DM Range
mean± std
Non DM Range
mean± std
Time Domain Features (F
1
)
meanNN mean values of NN intervals (ms) 787 ± 133 735 ± 111
medianNN median values of NN intervals (ms) 787 ± 134 735 ± 114
SDNN standard deviation of NN intervals (ms) 26.58 ± 14.13 41.85 ± 18.45
RMSSD root mean square of successive 27.89 ± 15.27 34.81 ± 16.75
NN differences (ms)
NN50 total # of of successive NN 4.52 ± 6.9 9.14 ± 9.62
intervals differing by ≥ 50 ms
pNN50 percentage of successive NN 0.07 ± 0.1 0.12 ± 0.13
intervals differing by ≥ 50 ms
HRVti Ratio of number of all NN 3.39 ± 1.32 4.89 ± 1.71
intervals to maximum number
Frequency domain Features (F
2
) (Welch, 1967)(Billman, 2007)
aVLF raw area of VLF (0-0.04 Hz) band (ms
2
) 100 ± 42 294 ± 97
aLF raw area of LF (0.04-0.15 Hz) band (ms
2
) 134 ± 25 351 ± 39
aHF raw area of HF (0.15-0.5 Hz)band (ms
2
) 143 ± 29 284 ± 92
aTotal total raw area of VLF, LF and HF bands 892 ± 116 2062 ± 177
LFHF ratio of LF and HF areas 1.49 ± 1.79 2.1 ± 1.83
nLF normalized LF area w.r.t to LF+HF 0.15 ± 0.08 0.2 ± 0.08
nHF normalized HF area w.r.t to LF+HF 0.15 ± 0.08 0.14 ± 0.07
%VLF relative VLF area w.r.t to total area 12.04 ± 7.34 12.59 ± 7.89
% LF relative LF area w.r.t to total area 13.15 ± 7.08 18.03 ± 7.6
% HF relative HF area w.r.t to total area 13.79 ± 7.99 12.66 ± 7.01
peakVLF freq. of highest power in VLF band 0.02 ± 0.02 0.02 ± 0.02
peakLF freq. of highest power in LF band 0.02 ± 0.03 0.03 ± 0.03
peakHF freq. of highest power in HF band 0.14 ± 0.08 0.09 ± 0.08
Non-linear Features (F
3
)
pSD1 Poincar´e SD i.e., standard deviation of points 19.86 ± 10.89 24.77 ± 11.93
perpendicular to the axis of line-of-identity
pSD2 Poincar´e SD i.e., standard deviation of points 31.43 ± 17.66 53.31 ± 24.19
along the axis of line-of-identity
sampEN sample entropy estimates 1.57 ± 0.45 2.04 ± 0.48
1.4 ± 0.42 1.73 ± 0.46
1.33 ± 0.42 1.66 ± 0.5
alpha detrended fluctuation analysis i.e., slope of 0.4 ± 0.31 0.5 ± 0.31
log-log plot of integrated RR vs window size 0.84 ± 0.26 0.98 ± 0.23
0.81 ± 0.28 1.04 ± 0.27
0.43 ± 0.29 0.44 ± 0.3
0.89 ± 0.7 0.85 ± 0.68
0.34 ± 0.88 0.65 ± 0.86
Waveform Features (F
3
)
meanFS mean value of falling slopes 0.03 ± 0.01 0.03 ± 0.01
meanRS mean value of rising slopes 0.07 ± 0.02 0.09 ± 0.02
meanPWp75 mean value of pulse widths at 75% 0.18 ± 0.02 0.15 ± 0.03
meanPWp50 mean value of pulse widths at 50% 0.29 ± 0.04 0.27 ± 0.06
meanPWp25 mean value of pulse widths at 25% 0.46 ± 0.06 0.45 ± 0.07
meanCT mean value of crest times 0.21 ± 0.03 0.17 ± 0.03
meanDT mean values of diastolic times 0.58 ± 0.11 0.56 ± 0.1
meanPH mean values of pulse heights 50.46 ± 9.5 52.91 ± 7.65
meanPI mean values of pulse intervals 0.79 ± 0.13 0.73 ± 0.11

misclassification. Columns 3-4 indicate the perfor-
mance of the PerDMCS systems. Other performance
measurements like true positive, false positive, true
negative, false negative, precision, recall, sensitivity ,
specificity and overall model accuracy are presented
in Table 3.
Analysis: From Tables 2 and 3, it is observed
that feature sets F
1
, F
2
, F
3
, and F
4
have discrimina-
tory information related to diabetes. It is also ob-
served that the diabetes is well discriminated com-
pared to healthier subjects using shape related fea-
tures i.e., F
4
, whereas using non-linear information
i.e. F
3
, classification of healthier shows better per-
formance compared to diabetes. From this we can
hypothesize that both F
3
and F
4
are complementary
in nature, and if integrated can lead into better clas-
sification. Though combination of all features (i.e.
PerDMCS-5) yields the best model accuracy, one can
observe that PerDMCS-3 outperforms PerDMCS-5 in
some of the performance measurements (True Posi-
tive, True Negative, Precision and Specificity). This
is due to the inclusion of unimportant features from
F
1
and F
2
. Results indicate that there is a scope of
minute features selection from individual feature sets.
Hence for improving performance of the entire sys-
tem, different fusion technologies are explored.
5 WEIGHTED FUSION:
PROPOSED METHOD
5.1 Features Fusion
In this study, the fusion at feature level is performed
by concatenation of the different percentage of dis-
criminative features from each set i.e., F
1
to F
4
. The
concatenation process of features is carried out as fol-
lows.
1. The features are ranked using correlation of fea-
tures and labels (Hall, 2000).
2. Different percentage of features are selected from
ranked features. In this work, we have explored
top 50% features to 100% with increments of 10%
i.e., 6 variations such as 50%, 60% 70%, 80%,
90% and 100% most discriminative features.
3. Finally we have concatenated different percentage
of features from each set to build the PerDMCS
model.
Different technologies of features level fusion are
employed e.g. different percentages from each do-
main separately (One vs One vs One vs One), differ-
ent percentage from the combinations of two feature
Table 2: Performance of pervasive diabetes mellitus classi-
fication systems developed using different features. The en-
tries in the table indicate the subjects of classification. Act:
Actual, Pred: Predicted.
PerDMCS
P
P
P
P
P
P
Pred.
Act.
Diabetic Healthy
PerDMCS Diabetic 34 11
1 Healthy 16 39
PerDMCS Diabetic 37 9
2 Healthy 13 41
PerDMCS Diabetic 38 8
3 Healthy 12 42
PerDMCS Diabetic 40 13
4 Healthy 10 37
PerDMCS Diabetic 42 10
5 Healthy 8 40
sets and different percentages from each of the rest
(Two vs One vs One) etc. The comparisons of differ-
ent feature level fusions are presented in 3.
As shown in 3(a), 24 (out of 1296) feature com-
binations result in accuracy of 83%. In Fig. 3(b), it
can be observed that the model accuracy is improved
slightly i.e., 2% for some different feature combina-
tions compared to combination of all individual fea-
tures as shown in Table 3. Here, 8 feature combina-
tions results in high accuracy of 84% and which is
1% improvement compared to the earlier combina-
tion. The best model accuracy remains similar 84%
(for the combination of 50% features from F
3
and
90% features from (F
2
+ F
4
) as shown in Fig. 3(c)).
In Fig. 3(d), the best model accuracy is 83% for the
combination of 50% features from (F
1
+ F
4
) and 80%
features from (F
2
+ F
3
). However, the average accu-
racy is slightly less than the best combinations of Two
vs One vs One and Two vs One fusions. Fig. 3(e)
shows that the maximum accuracy achieved in this
fusion approach is 81% and it marks a clear degra-
dation in performance compared to the combinations
mentioned above. Here, among all 144 combinations,
8 feature combinations results in 81% accuracy.
5.2 Scores Fusion
Score level fusion is performed by summing the
weighted confidence scores (evidences) derived from
the different PerDMCSs. The weighing rule for com-
bining the confidence scores of individual modalities
is as follows:
C =
1
m
m
∑
i=1
w
i
c
i
(1)

Table 3: Objective parameters of different PerDMCSs.
Performance Measurements PerDMCS-1 PerDMCS-2 PerDMCS-3 PerDMCS-4 PerDMCS-5
True Positive 34 37 38 40 42
False Positive 11 9 8 13 10
False Negative 16 13 12 10 8
True Negative 39 41 42 37 40
Precision 0.76 0.80 0.83 0.75 0.81
Sensitivity 0.68 0.74 0.76 0.80 0.84
Specificity 0.78 0.82 0.84 0.74 0.80
Model Accuracy 0.73 0.78 0.80 0.77 0.82
where C is the weighted confidence score, w
i
and c
i
are weight and confidence score of the i
th
modality,
and m indicates number of modalities used for com-
bining the scores. In this work, we have combined dif-
ferent modalities as described in section VI-A, such as
two modalities (Two vs One, Two vs Two and Three
vs One), three modalities (Two vs One vs One) and
four modalities (One vs One vs One vs One).
In our study, for two modality systems one of the
weights (w
i
) is varied in steps of 0.1 from 0 to 1, and
the other weight is determined using the formula: w
j
= 1- w
i
such that total weight w
i
+ w
j
= 1. Hence, we
get 11 combinations of weighing factors. Similarly,
for three modality systems two of the weights (w
i
and
w
j
) are varied in steps of 0.1 from 0 to 1 and the other
weight is determined using the formula: w
k
= 1- w
i
-
w
j
such that total weight w
i
+ w
j
+ w
k
= 1 and w
k
≥ 0.
Hence, we get 60 combinations of weighting factors.
For four modality systems three of the weights (w
i
, w
j
and w
k
) are varied in steps of 0.1 from 0 to 1 and the
other weight is determined using the formula: w
l
=
1- w
i
-w
j
-w
k
such that total weight w
i
+ w
j
+ w
k
+ w
l
= 1 and w
l
≥ 0. The classification performance of
the combined system for various combinations of the
weighting factors are as follows.
5.2.1 One vs One vs One vs One
It is observed that out of 313632 fusion of score com-
binations only 12 instances found to produce high-
est accuracy of 85%. The accuracy of fusion based
models at score level is performed slightly better than
the models obtained by simple feature level combina-
tions.
5.2.2 Two vs One vs One
It is observed that out of 77760 fusion of score com-
binations only 3 instances found to produce highest
accuracy of 85%. The accuracy of fusion based mod-
els at score level is performed slightly better than
the models obtained by simple feature level combi-
nations.
5.2.3 Two vs One
It is observed that out of 4752 fusion of score com-
binations only 20 instances found to produce highest
accuracy of 84%. The accuracy of fusion based mod-
els at score level is not improved compared to the ac-
curacy obtained by simple feature level combinations.
5.2.4 Two vs Two
It is observed that out of 1188 fusion of score com-
binations only 2 instances found to produce highest
accuracy of 89%. The accuracy of fusion based mod-
els at score level is performed better than the models
obtained by simple feature level combinations.
5.2.5 Three vs One
It is observed that out of 1584 fusion of score com-
binations only 14 instances found to produce highest
accuracy of 82%. The accuracy of fusion based mod-
els at score level is performed slightly better i.e.1%
than the models obtained by simple feature level com-
binations. However, still the accuracy is very low
compared to other feature level and score level fusion
models.
From the results it is found that the fusion of
scores performed better than the models simple fea-
ture level fusion. Among all the models the highest
accuracy is obtained for score level fusion of Two vs
Two combinations. The best accuracy is observed
to be 89% for the feature combinations of mixture
of 90% features from the feature sets F
1
and F
2
and
mixture of 100% features from the feature sets F
3
and
F
4
, with optimal weights of 0.3 and 0.7, respectively.
Similarly, another best combination is observed to be
for the feature combinations of mixture of 100% fea-
tures from the feature sets F
1
and F
2
and mixture of
200 400 600 800 1000 1200
78
79
80
81
82
83
Feature Combinations One Vs One Vs One Vs One
Accuracy (%)
(a) One vs One vs One vs One
200 400 600 800 1000 1200
75
76
77
78
79
80
81
82
83
84
Feature Combinations Two vs One vs One
Accuracy (%)
(b) Two vs One vs One
50 100 150 200 250 300 350 400
74
76
78
80
82
84
Feature combinations Two vs One
Accuracy (%)
(c) Two vs One
10 20 30 40 50 60 70 80 90 100
77
78
79
80
81
82
83
Feature combinations Two vs Two
Accuracy (%)
(d) Two vs Two
20 40 60 80 100 120 140
74
75
76
77
78
79
80
81
Feature combinations Three vs One
Accuracy (%)
(e) Three vs One
Figure 3: Accuracy of Feature Fusions.
100% features from the feature sets F
3
and F
4
, with
optimal weights of 0.2 and 0.8, respectively.
It is noted that the best combination in feature
level fusion at Two vs Two level showed the best
accuracy of 83% for the combination of mixture of
0
50
100
150
200
250
0
5
10
15
70
75
80
85
# of weight combinations
# of instances with High Accuracy
Accuracy (%)
Maximum
Accuracy= 85%
(a) One vs One vs One vs One
0
10
20
30
40
50
60
1
2
3
65
70
75
80
85
# of weight combinations
# of instances with high accuracy
Accuracy (%)
Maximum
Accuracy= 85%
(b) Two vs One vs One
0
2
4
6
8
10
12
0
5
10
15
20
70
75
80
85
# of weight combinations
# of instances with High Accuracy
Accuracy (%)
Maximum
Accuracy= 85%
(c) Two vs One
0
2
4
6
8
10
12
1
2
75
80
85
90
# of weight combinations
# of instances with High Accuracy
Accuracy (%)
Maximum
Accuracy= 89%
(d) Two vs Two
0
2
4
6
8
10
12
0
5
10
15
76
77
78
79
80
81
82
# of weight combinations
# of instances with High Accuracy
Accuracy (%)
Maximum
Accuracy =82%
(e) Three vs One
Figure 4: Accuracy of Score Fusion.
50% features from the feature sets F
1
and F
4
and mix-
ture of 80% features from the feature sets F
2
and F
3
.
However, in score level fusion it is not improved. In
score level fusion it picked the different set of fea-

ture combinations and the performance of the system
improved from 83% at feature level to 89% at score
level. It can be seen that the best feature combina-
tion observed in score level fusion exhibits 81% ac-
curacy in feature level fusion from the Fig. 3(d) with
equal weights i.e. 0.5 and 0.5 (6th combination across
# of weight combination). This indicates that fusion
is able to combine the complementary nature of ev-
idence obtained from different sets of features. The
performance measures for the best combination is ob-
served to be same and given in Table 4. From the re-
sults, it is observed that the score based fusion based
PerDMCS system is outperformed compared to indi-
vidual system performances (Table 2).
Table 4: Performance of best pervasive diabetes mellitus
classification systems developed using fusion technique.
The entries in the table indicate the subjects of classifica-
tion.
❵
❵
❵
❵
❵
❵
❵
❵
❵
❵
Predicted
Actual
Diabetic Healthy
Diabetic 45 6
Healthy 5 44
6 SUMMARY
In this work, HRV features related to time domain,
frequency domain and non-linear and shape (morpho-
logical) related features extracted from PPG signal
are used to discriminate between diabetic and healthy.
SVMs are used as classification models for develop-
ing different PerDMCS systems. The performance of
the PerDMCS systems developed by individual fea-
tures are improved by exploring fusion techniques, by
combining different percentage of discriminate fea-
tures from different combinations of feature sets and
scores of the individual systems and different combi-
nation systems as well. An improvement in classifi-
cation performance of the system is observed at score
level fusion with average classification performance
of 89%. This is attributed to the complementary na-
ture of evidence present in the features.
ACKNOWLEDGEMENTS
We are immensely grateful to the subjects for spend-
ing their valuable time and providing the data for this
study. We are thankful to IAIMS Research Center.
Further, we express our gratitude towards Dr. Arpan
Pal and Dr. Balamurali P. for their guidance and sup-
port.
REFERENCES
Allen, J. (2007). Photoplethysmography and its application
in clinical physiological measurement. Physiological
measurement, 28(3):R1.
Association, A. D. et al. (2015). 2. classification and di-
agnosis of diabetes. Diabetes care, 38(Supplement
1):S8–S16.
Banerjee, R., Vempada, R., Mandana, K., Choudhury,
A. D., and Pal, A. (2016). Identifying coronary artery
disease from photoplethysmogram. In Int. Joint Conf.
on Pervasive and Ubiquitous Computing: Adjunct,
pages 1084–1088. ACM.
Billman, G. E. (2007). The lf/hf ratio does not accurately
measure cardiac sympatho-vagal balance. Heart Rate
Variability: Clinical Applications and Interaction be-
tween HRV and Heart Rate, page 54.
Collaboration, N. R. F. et al. (2016). Worldwide trends
in diabetes since 1980: a pooled analysis of 751
population-based studies with 4· 4 million partici-
pants. The Lancet, 387(10027):1513–1530.
Elgendi, M. (2012). On the analysis of fingertip photo-
plethysmogram signals. Current cardiology reviews,
8(1):14–25.
Hall, M. A. (2000). Correlation-based feature selection of
discrete and numeric class machine learning.
Koolagudi, S.G., Reddy, V. R., and Rao, K. S. (2010). Emo-
tion recognition from speech signal using epoch pa-
rameters. In Proc. of SPCOM, pages 1–5, India.
Ning, X., Selesnick, I. W., and Duval, L. (2014). Chro-
matogram baseline estimation and denoising using
sparsity (beads). Chemometrics and Intelligent Lab-
oratory Systems, 139:156–167.
Reddy, V. R., Chakravarty, K., and Aniruddha, S. (2014).
Person identification in natural static postures using
kinect. In ECCV, pages 793–808. Springer.
Reddy, V. R. and Chattopadhyay, T. (2014). Human activ-
ity recognition from kinect captured data using stick
model. In HCI. Adv. Interaction Modalities and Tech-
niques, pages 305–315. Springer.
Reddy, V. R., Sinha, A., and Seshadri, G. (2013). Fusion
of spectral and time domain features for crowd noise
classification system. In Intelligent Systems Design
and Applications, pages 1–6. IEEE.
Schroeder, E. B., Chambless, L. E., Liao, D., Prineas, R. J.,
Evans, G. W., Rosamond, W. D., and Heiss, G. (2005).
Diabetes, glucose, insulin, and heart rate variability
the atherosclerosis risk in communities (aric) study.
Diabetes care, 28(3):668–674.
Seyd, A., Joseph, P. K., and Jacob, J. (2012). Automated di-
agnosis of diabetes using heart rate variability signals.
Journal of medical systems, 36(3):1935–1941.
Tabish, S. A. (2007). Is diabetes becoming the biggest epi-
demic of the twenty-first century? International Jour-
nal of health sciences, 1(2):V.
Welch, P. D. (1967). The use of fast fourier transform
for the estimation of power spectra: A method based
on time averaging over short, modified periodograms.
IEEE Transactions on audio and electroacoustics,
15(2):70–73.
