
A Statistical Analysis for the Evaluation of the Use of Wearable and
Wireless Sensors for Fall Risk Reduction
Giovanna Sannino, Ivanoe De Falco and Giuseppe De Pietro
Institute on High-Performance Computing and Networking (ICAR), National Research Council of Italy (CNR), Naples, Italy
Keywords:
Falling Risk, Physical Activity, Body Mass Index, Statistical Analysis, Correlation, Wearable Sensors, Mobile
Devices.
Abstract:
The aim of this study is to investigate the correlation between, on the one hand, personal and life-style indi-
cators and, on the other hand, the risk of falling. As indicators we consider here for each subject age, body
mass index, and information about physical activity habits, while a subject’s risk of falling is estimated by
the Mini-BES test score. Three different groups of subjects are taken into account, namely healthy, suffering
from metabolic diseases and suffering from cardiovascular diseases. Firstly, we aim at finding explicit linear
correlations for any pair of parameters. Secondly, we wish to pay attention to whether or not these correlations
change as the health state of the subjects does. The final goal is to move the first steps towards the design of
a system composed by wearable sensors, a mobile device, and an app that would be able to help people in
improving their life-style so as to decrease their falling risk.
1 INTRODUCTION
Falls have been shown to result in increased morbidity
and are considered the cause of the yearly loss of more
than 17 million years worldwide that are spent in dis-
ability (World Health Organization . Ageing and Life
Course Unit, 2008). Many studies have been dedi-
cated to fall detection, as e.g. (Sannino et al., 2015).
Identifying individuals with a high fall risk is often a
significant part of prevention programs. The assess-
ment of the risk of falling is a major and effective
prevention tool that allows identifying intrinsic and
extrinsic risk factors. These latter help determine the
most suitable interventions, thus reducing, or in some
cases even eliminating, falls.
The goal of this study is threefold.
Firstly, we aim to carry out a statistical analysis
to inquire into the existence of clear correlations be-
tween, on the one hand, some of the most widely
considered body parameters, as age and Body Mass
Index, and physical activity tests, and, on the other
hand, the risk of falling, represented through the score
of the Mini-Balance Evaluation Systems (Mini-BES)
test (Franchignoni et al., 2010).
Secondly, we wish to diversify our statistical anal-
ysis, so as investigate whether or not these correla-
tions change when healthy or unhealthy subjects are
considered. We wish to take into account here two
different wide classes of diseases. The first class con-
tains metabolic problems such as hypo- and hyper-
thyroidism, hypo- and hyper-glycemia, and so on.
Approximately 34% of the worlds adult population
has the cluster of risk factors that is metabolic syn-
drome (Mozumdar and Liguori, 2011). The second
class, instead, makes reference to diabetes, hypo- and
hyper-tension, vascular and heart-related problems.
Cardiovascular diseases (CVD) are responsible for
30% of all deaths (17.5 million) (World Health Or-
ganization and others, 2005).
Thirdly, we wish to move the first steps towards
the opening of a path to the use of wearable sensors
and mobile devices for the on-line monitoring and the
real-time evaluation of a subject’s falling risk through
the consideration of the above found relationships.
This latter goal would make fall risk assessment
much easier, because subjects would not need to un-
dergo the classical Mini-BES test, rather they could
estimate it at home in their everyday life by simply us-
ing a small set of wearable sensors. Namely, a sensor
could estimate the Body Mass Index (BMI), whereas
a second could keep track of the subject’s physical ac-
tivity. Based on the measured data, an app on the sub-
ject’s mobile device could act as a kind of an advisor,
by providing them with a view of their general health
state, and with useful suggestions as well. Moreover,
subjects with a potentially moderate-to-high falling
Sannino G., De Falco I. and De Pietro G.
A Statistical Analysis for the Evaluation of the Use of Wearable and Wireless Sensors for Fall Risk Reduction.
DOI: 10.5220/0006295805080516
Copyright
c
2017 by SCITEPRESS – Science and Technology Publications, Lda. All rights reserved

risk assessment would be adviced to meet a doctor so
as to possibly undergo a real test. This approach could
lead to easily performing a kind of a ’mass screening’
with reference to the risk of falling. To fulfill the two
first above statistical goals, in this paper we will make
use of a set of personal and life-style information con-
tained in a real-world database making reference to to
the risk of falling. Then, we will describe the body
system we propose, based on some wearable senors,
a mobile device, and an app.
This paper is organized as follows. Section 2 re-
ports on the related work on finding correlations be-
tween personal parameters and falling risk. Informa-
tion about the database is provided in Section 3. The
statistical analysis is shown and discussed in Section
4. In Section 5 some considerations are given on the
use of the results of the statistical analysis for the de-
sign of a monitoring system based on wearable sen-
sors. Finally, our conclusions and future works follow
in Section 6.
2 RELATED WORKS
One of the first papers trying to find correlations be-
tween personal parameters and falling risk was (Gard-
ner et al., 2000). In it, the objective was to assess
the effectiveness of exercise programs in preventing
falls (and/or lowering the risk of falls and fall related
injuries) in older people. Their conclusion was that
exercise is effective in lowering falls risk in selected
groups and should form part of falls prevention pro-
grams.
In (Hue et al., 2007) the aim of the study was to
determine the contribution of body weight to predict
balance stability. Their experiments suggest that body
weight may be an important risk factor for falling.
In (Faulkner et al., 2009) the authors examined
potential independent effects of lifestyle on fall risk.
Not smoking and going outdoors frequently or in-
frequently were independently associated with more
falls, indicating lifestyle-related behavioral and envi-
ronmental risk factors are important causes of falls in
older women.
Although not directly tied to fall risk, the paper
(Shekharappa et al., 2011) dealt with similar ideas, in
fact the aim was to find a correlation between body
mass index and cardiovascular parameters in obese
and non-obese in different age groups. The results
showed a statistically significant increase in heart rate,
systolic blood pressure and diastolic blood pressure in
obese subjects when compared to non-obese in all age
group. Moreover, there was a positive correlation be-
tween body mass index and heart rate, systolic blood
pressure, diastolic blood pressure, mean blood pres-
sure and pulse blood pressure.
The relationship between Body Mass Index and
stability has been investigated in (Ku et al., 2012).
Namely, the aims of that study was to examine the
impact of BMI and gender on static postural control.
Their conclusion was that BMI do have an impact on
postural control during both bipedic stance and uni-
pedic stance.
The effect of the type, level and amount of phys-
ical activity in falls and fall-related injuries was ex-
amined in (Pereira et al., 2014). Their conclusions
were that being active, especially sufficiently active,
reduces fall-related injuries by decreasing falls and by
safeguarding against severe injuries when falls occur.
A study was conducted in (Shahudin et al., 2016)
to investigate the effects of age on physical activ-
ity level, strength and balance towards fall risk index
(FRI) among women, as well as identifying the main
contributing factors towards FRI test performance.
That study suggested that women aged 20–73 years
were found to associate their FRIs mostly with age,
followed by strength, balance, and lastly, physical ac-
tivity.
3 THE DATABASE
To carry out our investigation, we have taken
advantage of the Human Balance Evaluation
database, collected at the Biomechanics and
Motor Control Laboratory (BMCLab) of the
Federal University of ABC, Sao Paulo, Brazil
(http://demotu.org/datasets/balance/), and freely
available in PhysioNet (Goldberger et al., 2000).
This database was collected while performing sta-
bilography tests over a set of subjects. Each of those
subjects had to perform standing tasks under four dif-
ferent conditions: by keeping their eyes opened or
closed, and while standing on a rigid surface or on an
unstable one. Each condition was tested three times,
with the order of the conditions being randomized
among subjects. A total of 1930 trials performed by
164 different subjects are given in this database. Each
1 minute recording is sampled at 100Hz and low pass
filtered at 10Hz.
Moreover, and most importantly to us, the fol-
lowing qualitative tests were employed on each
subject, and the replies/outcomes recorded in the
database: Short Falls Efficacy Scale International
(FES-I) (Kempen et al., 2008) (seven questions plus
the score), the Short version of the International Phys-
ical Activity Questionnaire (IPAQ) (Craig et al., 2003)
(eight questions plus the score), Trail Making Test

(four pieces of information), Mini Balance Evalua-
tion Systems (Mini-BES) Tests (Franchignoni et al.,
2010) (fourteen values plus the score). Furthermore,
the subjects were also interviewed about some of their
socio-cultural, demographic, and health information,
including their age, medications, and illnesses.
Consequently, each database item contains 63 at-
tributes. The database, apart from the raw data record-
ings, also includes a BDSinfo file that contains meta-
data describing the conditions of the stabilography tri-
als, the information from the anamnesis, and the re-
sults of the qualitative evaluations. Because, as stated
above, a subject has 12 files for the force platform
data, there are 12 rows for each subject in this file.
In these 12 rows, the only column that has rows with
different values is the column identifying the trial (the
file name). The content of all the other columns are
simply repeated over the 12 rows. As result, the
BDSdata file has the header plus 1930 rows and 64
columns. The complete list of the attributes can be
found in (Santos and Duarte, 2016).
Starting from this database, we have conducted an
analysis phase by creating a new database composed
by 6 items for each of the 164 subjects. The parame-
ters taken into account in our study are:
• x
1
: age group
• x
2
: Body Mass Index (BMI)
• x
3
: IPAQ 1: minutes per week of vigorous physi-
cal activity according to the short IPAQ question-
naire
• x
4
: IPAQ 2: minutes per week of moderate physi-
cal activity according to the short IPAQ question-
naire
• x
5
: IPAQ 3: minutes per week of low physical
activity according to the short IPAQ questionnaire
• x
6
: the total score of the Mini-BES test
In the short IPAQ questionnaire used to create
the Human Balance Evaluation database, the vigorous
physical activities are defined as: heavy lifting, dig-
ging, aerobics, or fast bicycling. The moderate ones,
instead are considered as: carrying light loads, bicy-
cling at a regular pace, or doubles tennis. Finally, the
low physical activities include: walking at work and
at home, walking to travel from place to place, and
any other walking that is done solely for recreation,
sport, exercise or leisure.
As concerns the value for IPAQ
1 for a sub-
ject in our database, this is computed starting from
the subject’s answers to short IPAQ questions 1a
(days per week of high-level physical activity) and 1b
(hours per day of high-level physical activity through:
IPAQ 1 = IPAQ 1a · IPAQ 1b. The same mechanism
holds true for the computation of IPAQ 2 and IPAQ 3.
The value of the score for the Mini-BES test is
computed through the answers of the subject to 14
questions, each of which can be assigned a value
equal to 0, 1, or 2, the higher the better. Therefore,
the value of the Mini-BES test score can range within
0 and 28, where a higher value means that the subject
has a lower falling risk.
Moreover, we have divided the subjects in the
database into three groups:
• healthy: they are the subjects with no disease at
all. This has resulted in a number of 56 individu-
als;
• metabolic diseases: this group contains all the in-
dividuals who declared problems related to hyper
- or hypo-thyroidism, hyper- or hypo-glicemia,
and so on. This group contains 32 subjects;
• cardiovascular diseases: this group is composed
by all the individuals with hyper- or hypo-tension,
cardiovascular problems, or diabetes. There are
41 people in this group.
It should be pointed out that we excluded from the
groups 48 subjects who were not healthy, yet they
suffered from diseases other than those reported in
the above two groups. As examples, some of them
suffered from melanoma, breast cancer, hepatitis,
Parkinson, arthrosis, asthma, dermatitis, rhinitis, gas-
tritis, kidney stones, sickle cell anemia,tendinitis, and
so on. Moreover, there are 13 people in the database
who suffer from both endocrinological and cardio-
vascular diseases. These have been assigned to both
groups.
4 STATISTICAL ANALYSIS
For each of the three groups of subjects described in
the previous section we have performed a correlation
analysis among the chosen database parameters. By
doing so, we have been able to obtain the correlation
value for each pair of parameters. Let’s recall here
that a correlation value between two parameters is in
the range [-1.0, 1.0], where positive values represent
direct correlations and negative values inverse corre-
lations, and the higher the absolute value the stronger
the correlation.
Moreover, for each of these pairs we have created
a figure, in which we report the raw data, and have
computed and drawn the best line for the linear re-
gression that best fits the data, and have also reported
the related R-squared (R
2
) value. R-squared is a sta-
tistical measure of how close the data are to the fit-
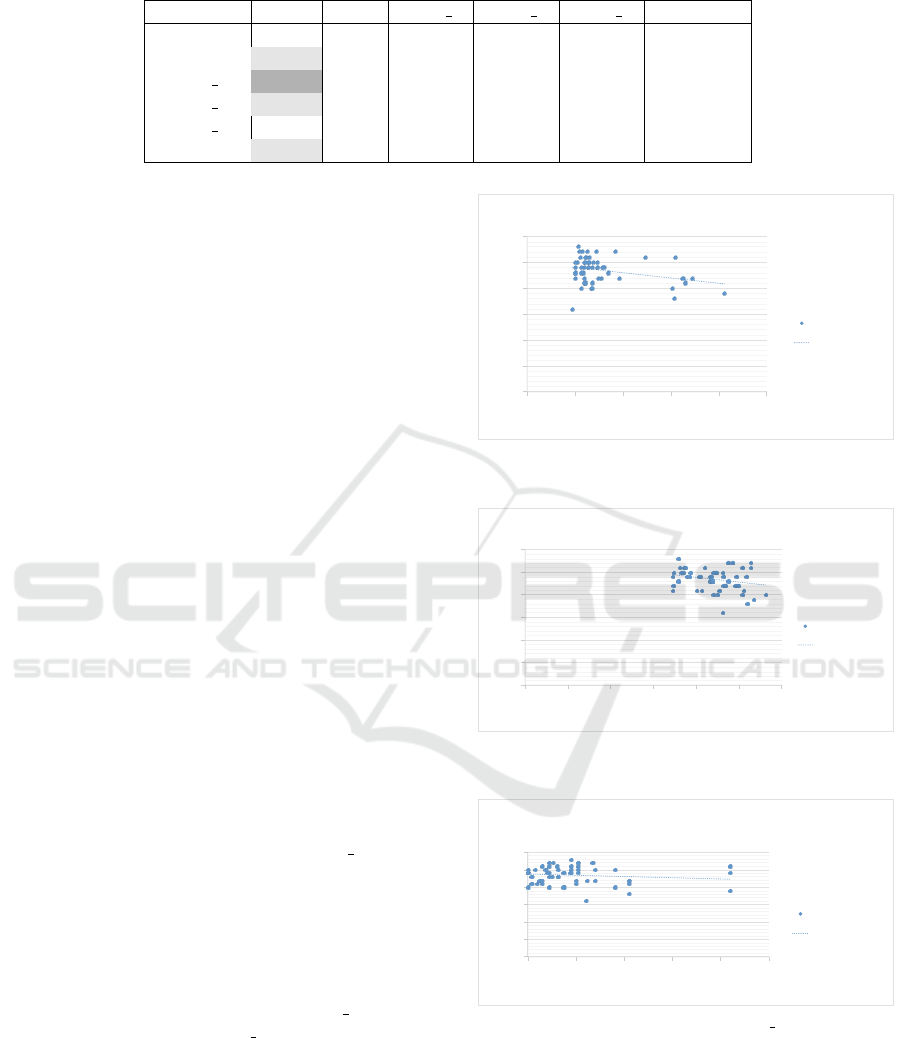
Table 1: Correlation values between pairs of parameters for healthy subjects.
age BMI IPAQ 1 IPAQ 2 IPAQ 3 Mini-BES
age 1.00
BMI 0.45 1.00
IPAQ 1 0.56 0.29 1.00
IPAQ 2 0.30 -0.08 0.20 1.00
IPAQ 3 -0.05 -0.02 -0.06 0.21 1.00
Mini-BES -0.30 -0.24 -0.14 -0.06 0.05 1.00
ted regression line. A value of 0 for R
2
indicates that
the model explains none of the variability of the re-
sponse data around its mean, whereas an R
2
of 1 in-
dicates that the regression line perfectly fits the data.
These regression lines and their R
2
values are very
useful because from them fruitful information can be
obtained. In the next three subsections all these find-
ings are shown for the three groups, respectively.
4.1 Healthy Subjects
Table 1 reports the correlation values for all of the
considered parameters.
In it the generic cell (i, j) contains the correlation
value between the pair of parameters i and j. Very
high values (≥ 0.50) and very low ones (≤ −0.50) are
shown in dark grey. Moderate values, lying in [-0.49,
0.30] and [0.30, 0.49], are highlighted in light grey.
All the pairs in which the Mini-BES test score appears
have been considered for further analysis. For each
of them the corresponding figures are shown, which
contain information about the linear regression too.
A first remark that can be made concerns the pairs
of parameters for which the correlation values are
high or moderate, i.e. those for which the values in
the tables are shown in dark grey or light grey, re-
spectively.
As concerns the healthy subjects, the only strong
correlation is between the age and the IPAQ 1, i.e. the
vigorous activity, and it a positive correlation. Basi-
cally, this says that as long as healthy people get old,
they go on exercising vigorously. Also quite high is
the moderate direct correlation between age and BMI,
meaning that the older a healthy subject, the more
obese she/he is. Moreover, a moderate direct cor-
relation is shown between age and IPAQ 2, similar
to that between age and IPAQ 1, but with reference
to moderate physical activities. Furthermore, a mod-
erate inverse correlation exists also between age and
Mini-BES. This suggests that for healthy subjects the
higher the age the lower the value of the Mini-BES
test score, hence the more probable the subject will
be prone to falls.
Fig. 1 shows that this group is mainly composed
by young adults. In fact the average age is 31.32 years
y"="$0,051x"+"25,043"
R²"="0,08925"
0"
5"
10"
15"
20"
25"
30"
0,00" 20,00" 40,00" 60,00" 80,00" 100,00"
miniBES"Test"value"
Age"
Age"$"miniBestTEST"correlaFon"
in"Healthy"Subjects"
Best_T"
Linear"(Best_T)"
Figure 1: Analysis of parameters age and Mini-BES Test
score for healthy subjects.
!"#"$%&'(()*"+"',&(-'"
./"#"%&%0,-1"
%"
0"
(%"
(0"
'%"
'0"
-%"
%" 0" (%" (0" '%" '0" -%"
2343567"89:;"<=>?9"
5@A"<=>?9"
5@A"$"234359:;8678"BCDD9>=EC4"
34"F9=>;G!"7?HI9B;:"
59:;J8"
K349=D"L59:;J8M"
Figure 2: Analysis of parameters BMI and Mini-BES Test
score for healthy subjects.
y"="$0,0018x"+"23,786"
R²"="0,01825"
0"
5"
10"
15"
20"
25"
30"
0" 200" 400" 600" 800" 1000"
miniBES"Test"value"
minutes"of"acDvity"in"a"week"
IPAQ1"$"miniBESTest"CorrelaDon"
in"Healthy"Subjets"
Best_T"
Linear"(Best_T)"
Figure 3: Analysis of parameters IPAQ 1 and Mini-BES
Test score for healthy subjects.
±14.90. Moreover, the average value for the Mini-
BES test score is 23.44 ± 2.54, which is quite a high
value suggesting that healthy people have a scarce fall
risk.
A closer examination of Figures 1, 2, 3, 4, and 5
provides more precise information about the relation-
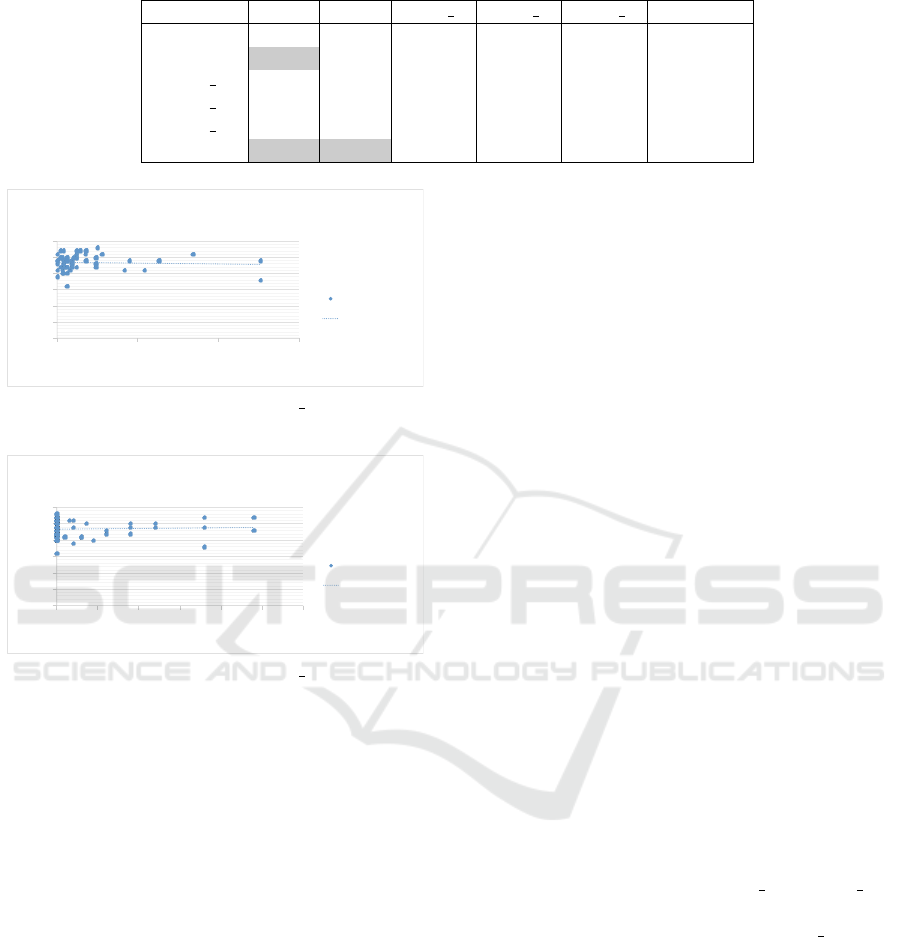
Table 2: Correlation values between pairs of parameters for metabolic subjects.
age BMI IPAQ 1 IPAQ 2 IPAQ 3 Mini-BES
age 1.00
BMI 0.52 1.00
IPAQ 1 0.04 -0.17 1.00
IPAQ 2 0.13 0.08 0.09 1.00
IPAQ 3 0.08 0.26 -0.01 0.03 1.00
Mini-BES -0.78 -0.54 -0.06 -0.03 -0.25 1.00
!"#"$%&%%%'(")"*+&'+,"
-."#"%&%%+/0"
%"
'"
/%"
/'"
*%"
*'"
+%"
%" '%%" /%%%" /'%%"
1232456"789:";<=>8"
123>:89"?@"<ABC2:!"23"<"D88E"
FGHI*"$"1232456789:"J?KK8=<B?3"
23"L8<=:M!"6>NO8A:9"
489:P7"
Q238<K"R489:P7S"
Figure 4: Analysis of parameters IPAQ 2 and Mini-BES
Test score for healthy subjects.
!"#"$%$$&'(")"&*%*+&"
,-"#"$%$$&+*"
$"
."
'$"
'."
&$"
&."
*$"
$" .$" '$$" '.$" &$$" &.$" *$$"
/010234"5678"9:;<6"
/01<867"=>":?@A08!"01":"B66C"
DEFG*"H"/010234"5678"I=JJ6;:@=1"
01"K6:;8L!"4<MN6?87"
2678O5"
P016:J"Q2678O5R"
Figure 5: Analysis of parameters IPAQ 3 and Mini-BES
Test score for healthy subjects.
ship between the Mini-BES test score and each of the
other parameters considered in this study. Namely,
the precise form of their relationship, under a linear
hypothesis, is shown.
The slope of the line drawn in each figure provides
intuitive visual understanding of the relationship: a
down-bound line means an inverse linear relationship,
an up-bound one a direct dependence, and the more
inclined the line the higher the amount of this rela-
tionship. Consequently, lines that are almost horizon-
tal imply a substantial independence between the two
parameters. As an example, this is the case shown in
Fig. 5.
4.2 Subjects with Metabolic Diseases
Table 2 reports the correlation values for all of the
considered parameters.
As it has been for the healthy group, here too the
generic cell (i, j) contains the correlation value be-
tween the pair of parameters i and j. The same con-
vention used for that group applies also in this case to
highlight some specific cells in the table. Similarly to
the previous case, here too all the pairs in which the
Mini-BES test score appears have been considered for
further analysis. For each of them the corresponding
figures are shown, which contain information about
the linear regression too.
As far as the metabolic patients are taken into
account, three parameter pairs have high correlation
values, namely age-BMI, age-Mini-BES, and BMI-
MiniBES. The first is a direct correlation, meaning
that as the age increases so does BMI, as it is quite
frequent in humans, be they healthy or suffering from
some disease. Of higher interest for our purposes
are the other two correlations. Age and Mini-BES
test score are strongly and inversely correlated, which
means that as the age of these diseased subjects in-
creases the Mini-BES test score decreases, so older
subjects suffering from metabolic diseases are more
prone to falls. Moreover, also BMI and Mini-BES test
score are strongly and inversely correlated, meaning
that the more obese a metabolic subject, the higher
probability she/he has of falling.
In this case, as Fig. 6 reveals, the age of this group
is quite higher than that for healthy subjects. In fact,
the average is 62.80 years ±17.91. The average value
for the Mini-BES test score for these subjects, instead,
is 19.67 ± 4.10, i.e. about four points worse that that
for healthy people.
By looking at Figures 6, 7, 8, 9, and 10, it can
be visually understood that for people suffering from
metabolic diseases changes in IPAQ
2 and IPAQ 3 al-
most do not affect the Mini-BES test score, while the
opposite is true for the age, BMI, and IPAQ 1. In par-
ticular, the R
2
value for the correlation between age
and Mini-BES test score is equal to 0.60908, so we
are confident that the regression line well fits the data.
4.3 Subjects with Cardiovascular
Diseases
Table 3 reports the correlation values for all of the
considered parameters.
Also for this group, the generic cell (i, j) in the
table reports the correlation value between the pair
of parameters i and j. The cells in this table have
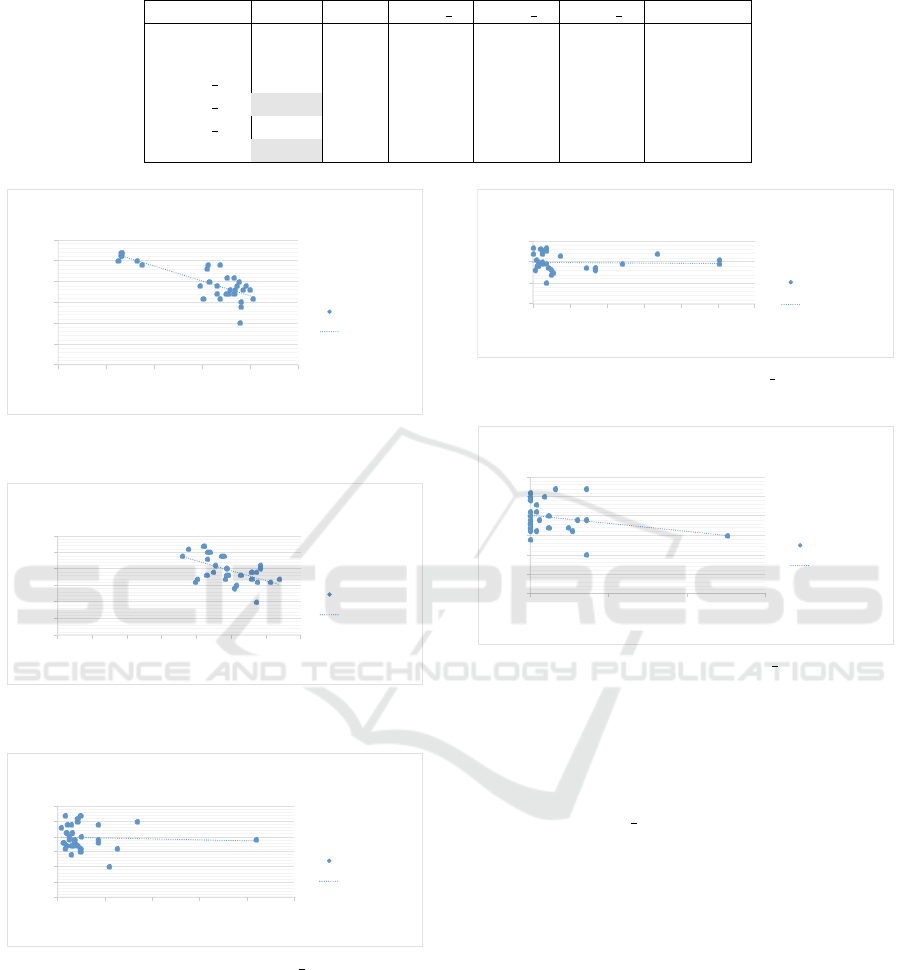
Table 3: Correlation values between pairs of parameters for cardiovascular subjects.
age BMI IPAQ 1 IPAQ 2 IPAQ 3 Mini-BES
age 1.00
BMI -0.08 1.00
IPAQ 1 -0.10 -0.29 1.00
IPAQ 2 -0.34 -0.18 0.15 1.00
IPAQ 3 -0.08 0.17 -0.03 0.03 1.00
Mini-BES -0.39 0.01 -0.07 0.17 0.22 1.00
y"="$0,1787x"+"30,899"
R²"="0,60908"
0"
5"
10"
15"
20"
25"
30"
0" 20" 40" 60" 80" 100"
miniBES"Test"value"
Age"
Age"$"miniBestTEST"correlaGon"
in"PaGents"with"Metabolic"diseases"
Best_T"
Linear"(Best_T)"
Figure 6: Analysis of parameters age and Mini-BES Test
score for metabolic subjects.
y"="$0,6008x"+"34,465"
R²"="0,29433"
0"
5"
10"
15"
20"
25"
30"
0" 5" 10" 15" 20" 25" 30" 35"
miniBES"Test"value"
BMI"value"
BMI"$"miniBestTEST"correlaFon"
in"PaFents"with"Metabolic"diseases"
Best_T"
Linear"(Best_T)"
Figure 7: Analysis of parameters BMI and Mini-BES Test
score for metabolic subjects.
y"="$0,0006x"+"19,852"
R²"="0,00324"
0"
5"
10"
15"
20"
25"
30"
0" 500" 1000" 1500" 2000" 2500"
miniBES"Test"Value"
minutes"of"acDvity"in"a"week"
IPAQ1$"miniBestTEST"correlaDon"
in"PaDents"with"Metabolic"diseases"
Best_T"
Linear"(Best_T)"
Figure 8: Analysis of parameters IPAQ 1 and Mini-BES
Test score for metabolic subjects.
been highlighted by using the same convention as
done for the two previous groups. Similarly to the
two above described cases, also for this group all the
pairs in which the Mini-BES test score appears have
been considered for further analysis. For each of them
the corresponding figures are shown, which contain
information about the linear regression too.
Finally, when the cardiovascular subjects are con-
sidered, no correlation can be defined as strong, the
!"#"$%&%%%'(")"*+&,-."
/0"#"%&%%%+1"
%"
*%"
'%"
2%"
%" 3%%" *%%%" *3%%" '%%%" '3%%" 2%%%"
4565789":;<=">?@A;"
456A=;<"BC"?DEF5=!"56"?"G;;H"
IJKL'$"45657;<=:89:"DBMM;@?EB6"
56"J?E;6=<"G5=N"O;=?PB@5D"Q5<;?<;<"
7;<=R:"
S56;?M"T7;<=R:U"
Figure 9: Analysis of parameters IPAQ 2 and Mini-BES
Test score for metabolic subjects.
y"="$0,0041x"+"20,189"
R²"="0,06131"
0"
5"
10"
15"
20"
25"
30"
0" 500" 1000" 1500"
miniBES"Test"Value"
minutes"of"acDvity"in"a"week"
IPAQ3$"miniBestTEST"correlaDon"
in"PaDents"with"Metabolic"diseases"
Best_T"
Linear"(Best_T)"
Figure 10: Analysis of parameters IPAQ 3 and Mini-BES
Test score for metabolic subjects.
highest one being a moderate inverse correlation be-
tween age and Mini-BES test score. This is quite sim-
ilar to that already seen for the metabolic subjects, al-
though with a lower tie between the two parameters.
Also, age and IPAQ 2 show a moderate inverse corre-
lation, that is the opposite as that for healthy subjects:
healthy people tend to exercise when they get older,
whereas cardiovascular ones tend to not work out.
Also for the cardiovascular subjects, as it was for
the metabolic ones, the average age is quite higher
than that for the healthy subjects. In fact, as shown in
Fig. 11, it is equal to 72.27 ±6.61, which is higher
than that of metabolic people too. As for the average
score of the Mini-BES test for this group, it results to
be equal to 18.02 ± 3.81, i.e. even worse that that of
the metabolic subjects.
For this group the Figures 11, 12, 13, 14, and 15
do not show any particularly strong correlation, nor
do they report any sufficiently high value for R
2
, apart
from, possibly, the case of age and Mini-Best test
score.
In conclusion, the main result from this statisti-
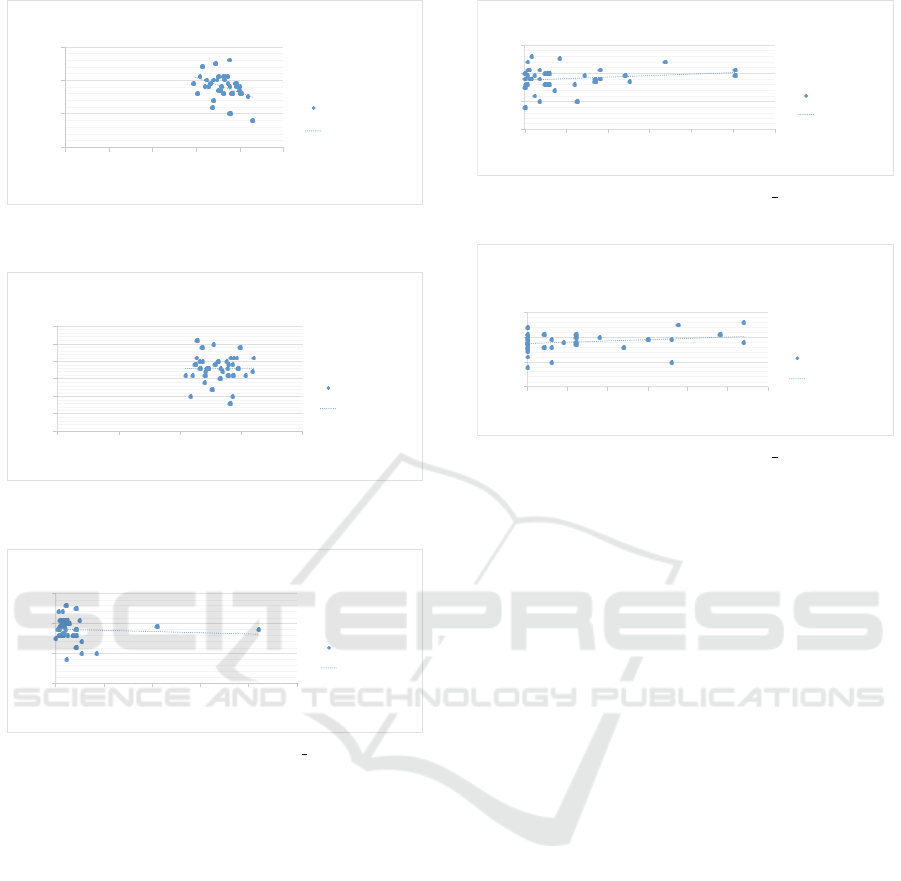
y"="$0,2227x"+"34,116"
R²"="0,14905"
0"
10"
20"
30"
0" 20" 40" 60" 80" 100"
miniBES"Test"value"
Age"
Age"$"miniBestTEST"correlaGon""
in"Cardiac"PaGents"
Best_T"
Linear"(Best_T)"
Figure 11: Analysis of parameters age and Mini-BES Test
score for cardiovascular subjects.
!"#"$%$$&'(")"*&%+,*"
-."#",%/01$2"
$"
2"
*$"
*2"
/$"
/2"
,$"
$" *$" /$" ,$" '$"
3454607"89:;"<=>?9"
6@A"<=>?9"
6@A"1"345469:;8078"BCDD9>=EC5"
45"F=DG4=B"H=E95;:"
69:;I8"
J459=D"K69:;I8L"
Figure 12: Analysis of parameters BMI and Mini-BES Test
score for cardiovascular subjects.
!"#"$%&%%%'(")"*+&*,,"
-."#"%&%%//0"
%"
*%"
1%"
0%"
%" *%%%" 1%%%" 0%%%" '%%%" /%%%"
2343567"89:;"<=>?9"
234?;9:"@A"=BC<3;!"D9E"F99G"
HIJK*"$"234359:;8678"B@EE9>=C@4""
34"L=EM3=B"I=C94;:"
59:;N8"
O349=E"P59:;N8Q"
Figure 13: Analysis of parameters IPAQ 1 and Mini-BES
Test score for cardiovascular subjects.
cal analysis is that, when a subject suffers from a
metabolic disease, she/he has a probability of falling
that is higher than that of an equally aged cardiovas-
cular subject, and much higher than that of a healthy
peer.
5 USE OF THE STATISTICAL
ANALYSIS RESULTS IN A
MONITORING SENSOR-BASED
SYSTEM
The statistical analysis made in this preliminary study
has shown that, even though moderate, a correlation
exists between the risk of falling (the mini-BES test
score) and the personal and lifestyle indicators.
These results mean that it is imaginable to real-
ize a monitoring system in order to give specific rec-
!"#"$%$$&&'"("&)%*&+"
,-"#"$%$.$/)"
$"
&$"
0$"
.$"
$" *$$" &$$$" &*$$" 0$$$" 0*$$" .$$$"
1232456"789:";<=>8"
123>:89"?@"<AB;2:!"C8D"E88F"
GHIJ0"K"1232489:7567"A?DD8=<B?3""
23"L<DM2<A"H<B83:9"
489:N7"
O238<D"P489:N7Q"
Figure 14: Analysis of parameters IPAQ 2 and Mini-BES
Test score for cardiovascular subjects.
!"#"$%$$&'(")"*+%,,-"
./"#"$%$&$'-"
$"
*$"
'$"
-$"
$" *$$" '$$" -$$" ,$$" &$$" 0$$"
1232456"789:";<=>8"
123>:89"?@"<AB;2:!"C8D"E88F"
GHIJ-"K"1232489:7567"A?DD8=<B?3""
23"L<DM2<A"H<B83:9"
"
489:N7"
O238<D"P489:N7Q"
Figure 15: Analysis of parameters IPAQ 3 and Mini-BES
Test score for cardiovascular subjects.
ommendations about the diet and the amount and the
type of physical activity so as to improve the subject
well-being with respect to the risk of falling.
Nowadays, mobile devices, such as smartphones
or tablets, wearable devices, such as smartwatches or
bands, and wireless healthcare devices, such as smart
digital scales, are widely used and it is demonstrated
that they are valid tools to monitor body and life-
styles parameters. For these reasons, thanks to these
devices, it is possible to collect in real time data about,
for example, the weight of a subject or the type and
the amount of activity performed during a day or a
week.
This collected information could be analyzed in
real time on a mobile device in order to give a prompt
feedback to the subject about her/his risk of falling
and in order to guide the subject to develop new habits
to reduce the estimated risk of falling.
As an example, for the subjects with metabolic
disease the statistical analysis has shown that there is
a strong and inverse correlation between the BMI and
the Mini-BES test score, so a wearable sensor-based
monitoring system could give specific recommenda-
tions in order to not only reduce the obesity, but also
to reduce the risk of falling knowing that more obese
a metabolic subject, the higher probability she/he has
of falling.
Within our laboratory, several mobile applica-
tions have been implemented aimed to monitor dif-
ferent kinds of healthcare parameters, as for example
(Forastiere et al., 2016; Sannino and De Pietro, 2014).
The correlation results found in this study for healthy
subjects and cardiac subjects will be easily added into

them respectively.
Unfortunately, there is no unique app with the pos-
sibility to have a specific knowledge base for each
subject in order to suggest different recommendations
for the three different groups of subjects.
For this reason, a new mobile health application
is under development in order to take into account
the different results obtained for the different classes
of people examined, e.g. healthy subjects, subjects
with metabolic diseases or subjects with cardiac dis-
eases. The app will be able to monitor body indica-
tors, physiological data, and physical activity infor-
mation by using wearable sensors, be they or not com-
pliant to the Continua Alliance guidelines (Carroll
et al., 2007). Of course, some of these sensors will be
used for long periods, as e.g. those for physical activ-
ity monitoring, therefore they are affected by the typ-
ical problems related to battery charge. Other types
of sensors, instead, will be employed more rarely, as
for example smart digital scales that are typically used
just once in a day.
6 CONCLUSIONS AND FUTURE
WORK
In this paper the correlation between personal and
life-style indicators and the risk of falling has been
investigated.
As indicators we have considered here for each
subject age, body mass index, and information about
physical activity habits, while a subject’s risk of
falling has been estimated by the Mini-BES test
score. Three different groups of subjects have been
taken into account, namely healthy, suffering from
metabolic diseases and suffering from cardiovascular
diseases.
Firstly, explicit linear correlations have been
found for any pair of parameters. Secondly, atten-
tion has been paid to whether or not these correlations
change as the health state of the subjects does.
Finally, some first steps have been moved towards
a system, composed by wearable sensors, a mobile
device, and an app, that would be able to help people
in improving their life-style so as to decrease falling
risk.
In the near future we aim at implementing the
sensor-based system.
Moreover, due to the fact that the data set from
Physionet used in this paper looks highly clustered
with little outliers, e.g. most healthy patients are
around 20 years old, we plan to start a cooperation
phase with the University of Naples ”Federico II” in
which they will provide us with some volunteers with
different ages in order to better balance the database.
Within this cooperation we will supply the system
to the volunteers, so as to test its effectiveness and
usefulness.
ACKNOWLEDGEMENTS
This work has been supported by the project
“eHealthNet: Ecosistema software per la Sanit
`
a Elet-
tronica” (PON03PE 00128 1) financed within the
P.O.N. “Research and Competitiveness” call of the
Italian Ministry for University and Research.
REFERENCES
Carroll, R., Cnossen, R., Schnell, M., and Simons, D.
(2007). Continua: An interoperable personal health-
care ecosystem. IEEE Pervasive Computing, 6(4):90–
94.
Craig, C. L., Marshall, A. L., Sjstrm, M., Bauman, A. E.,
Booth, M. L., Ainsworth, B. E., Pratt, M., Ekelund,
U., Yngve, A., Sallis, J. F., and Oja, P. (2003). In-
ternational physical activity questionnaire: 12-country
reliability and validity. Medicine and science in sports
and exercise, 35(8):13811395.
Faulkner, K. A., Cauley, J. A., Studenski, S. A., Landsittel,
D. P., Cummings, S. R., Ensrud, K. E., Donaldson, M.,
Nevitt, M., of Osteoporotic Fractures Research Group,
S., et al. (2009). Lifestyle predicts falls independent
of physical risk factors. Osteoporosis international,
20(12):2025–2034.
Forastiere, M., De Pietro, G., and Sannino, G. (2016). An
mhealth application for a personalized monitoring of
ones own wellness: Design and development. In Inno-
vation in Medicine and Healthcare 2016, pages 269–
278. Springer.
Franchignoni, F., Horak, F., Godi, M., Nardone, A., and
Giordano, A. (2010). Using psychometric techniques
to improve the balance evaluation systems test: the
mini-bestest. Journal of Rehabilitation Medicine,
42(4):323–331.
Gardner, M. M., Robertson, M. C., and Campbell, A. J.
(2000). Exercise in preventing falls and fall related
injuries in older people: a review of randomised con-
trolled trials. British journal of sports medicine,
34(1):7–17.
Goldberger, A. L., Amaral, L. A., Glass, L., Hausdorff,
J. M., Ivanov, P. C., Mark, R. G., Mietus, J. E., Moody,
G. B., Peng, C.-K., and Stanley, H. E. (2000). Phys-
iobank, physiotoolkit, and physionet components of
a new research resource for complex physiologic sig-
nals. Circulation, 101(23):e215–e220.
Hue, O., Simoneau, M., Marcotte, J., Berrigan, F., Dor
´
e,
J., Marceau, P., Marceau, S., Tremblay, A., and Teas-
dale, N. (2007). Body weight is a strong predictor of
postural stability. Gait & posture, 26(1):32–38.

Kempen, G. I., Yardley, L., Van Haastregt, J. C., Zijlstra,
G. R., Beyer, N., Hauer, K., and Todd, C. (2008). The
short fes-i: a shortened version of the falls efficacy
scale-international to assess fear of falling. Age and
ageing, 37(1):45–50.
Ku, P., Osman, N. A., Yusof, A., and Abas, W. W. (2012).
Biomechanical evaluation of the relationship between
postural control and body mass index. Journal of
biomechanics, 45(9):1638–1642.
Mozumdar, A. and Liguori, G. (2011). Persistent increase
of prevalence of metabolic syndrome among us adults:
Nhanes iii to nhanes 1999–2006. Diabetes care,
34(1):216–219.
Pereira, C. L., Baptista, F., and Infante, P. (2014). Role
of physical activity in the occurrence of falls and fall-
related injuries in community-dwelling adults over 50
years old. Disability and rehabilitation, 36(2):117–
124.
Sannino, G., De Falco, I., and De Pietro, G. (2015). A
supervised approach to automatically extract a set of
rules to support fall detection in an mhealth system.
Applied Soft Computing, 34:205–216.
Sannino, G. and De Pietro, G. (2014). A mobile system for
real-time context-aware monitoring of patients health
and fainting. International journal of data mining and
bioinformatics, 10(4):407–423.
Santos, D. A. and Duarte, M. (2016). A public data set of
human balance evaluations. PeerJ, 4:e2648.
Shahudin, N. N., Yusof, S. M., Razak, F. A., Sariman,
M. H., Azam, M. Z. M., and Norman, W. M. N. W.
(2016). Effects of age on physical activity level,
strength and balance towards fall risk index among
women aged 20–73 years. In Proceedings of the 2nd
International Colloquium on Sports Science, Exercise,
Engineering and Technology 2015 (ICoSSEET 2015),
pages 25–34. Springer.
Shekharappa, K., Smilee, J. S., Mallikarjuna, P. T., Veda-
vathi, K. J., and Jayarajan, M. P. (2011). Correlation
between body mass index and cardiovascular parame-
ters in obese and non obese in different age groups.
International Journal of Biological & Medical Re-
search, 2(2):551–555.
World Health Organization . Ageing and Life Course Unit
(2008). WHO global report on falls prevention in
older age. World Health Organization.
World Health Organization and others (2005). Preventing
chronic diseases: a vital investment: Who global re-
port.
