
Saliency Guided Computer-aided Diagnosis
for Neurodegenerative Dementia
Olfa Ben Ahmed
1
, Mohamed-Chacker Larabi
1
, Marc Paccalin
2
and Christine Fernandez-Maloigne
1,∗
1
XLIM-SIC, UMR CNRS 7252, Bvd Marie and Pierre Curie, 86962 Futuroscope Chasseneuil Cedex, France
2
Universit
´
e de Poitiers, P
ˆ
ole de G
´
eriatrie, CMRR, CHU La Miltrie 86021 Poitiers, EA3808, Poitiers, France
Keywords:
Alzheimer’s Disease, Saliency Maps, Visual Attention, Machine Learning, MRI, Domain Knowledge.
Abstract:
Visual assessment of brain atrophy for brain diseases diagnosis by clinicians is the most widely adopted
method in clinical practices. Such a visually extracted knowledge represents a great potential to develop better
training programs and create new tools to assist clinical decision making. Inspired by the clinician visual
behavior, we propose in this work a new and automatic approach to detect and quantify local brain atrophies.
The proposed approach combines both bottom-up and top-down visual saliency using domain knowledge
in the brain MRI analysis. The first subsystem relies on low-level MRI characterization (texture and edge)
while the second is based on an embedded learning process to identify and localize the subset of gray matter
regions that provides optimal discrimination between subjects. The proposed method validated for the task of
Alzheimer’s disease (AD) subjects recognition. Classification experiments were conducted on a subset of 188
anatomical MR images extracted from the Alzheimer’s Disease Neuro-imaging Initiative (ADNI) dataset. We
report accuracy of 81.48% and 76.66% respectively for AD versus Normal Control (NC) and Mild Cognitive
Impairment (MCI) versus NC classification tasks.
1 INTRODUCTION
Alzheimer’s disease (AD) is a neurodegenerative dis-
ease associated with the loss of memory and deterio-
ration in cognitive functions. To date, AD diagnosis
is most widely performed based on the visual assess-
ment of brain atrophy (Harper et al., 2016), which is
very difficult, tedious and time consuming task. The
development of an automated approach for objective
visual interpretation of MRI content could potentially
increase the visual assessment skills of radiologists by
stressing some overlooked image features that may be
relevant to the diagnostic problem. This also could
make the diagnosis easier for clinicians with a lim-
ited expertise in order to extract diagnostically use-
ful and objective information. Hence, modeling the
experts’ knowledge and perceptual expertise helps to
improve structural abnormalities detection and then
assists clinicians in the diagnostic task (Li et al., 2013)
(Lala and Nakazawa, 2016).
To that end, saliency modeling has been widely
explored to describe the radiologists’ visual attention
for Computer Aided Diagnosis (CAD) (Wen et al.,
∗
For the Alzheimer’s Disease Neuroimaging Initiative.
2016). Saliency-based methods, aiming at detect-
ing lesions and tissue abnormalities, recently attracted
more and more attentions and achieved promising re-
sults in tumor detection. For instance, (Mehmood
et al., 2013b) proposed a prioritization based ap-
proach to help clinicians to quickly determine and
access the required level of visual information of a
particular brain tumor case from brain MRI. In (No-
dine and Kundel, 1987), the authors proposed a model
for tumor detection in chest X-ray images. They
collected the eye tracking data of radiologists, while
analysing images in presence of abnormalities, to de-
velop a model for predicting the sequence of events
from the time of viewing X-ray images up to the
diagnostic decision-making. For a different task,
Chung et al. (Chung et al., 2015) proposed a novel
saliency-based method for identifying suspicious re-
gions in multi-parametric MR prostate images based
on statistical texture distinctiveness. (Banerjee et al.,
2016) proposed a saliency detection model to auto-
matically detect and isolate the tumor region from
multi-channel brain MRI. Moreover, visual saliency
models have been proposed for retinal images anal-
ysis. For instance, Deepak et al. proposed a visual
saliency-based framework for detecting potential lo-
140
Ben Ahmed O., Larabi M., Paccalin M. and Fernandez-Maloigne C.
Saliency Guided Computer-aided Diagnosis for Neurodegenerative Dementia.
DOI: 10.5220/0006293001400147
In Proceedings of the 10th International Joint Conference on Biomedical Engineering Systems and Technologies (BIOSTEC 2017), pages 140-147
ISBN: 978-989-758-215-8
Copyright
c
2017 by SCITEPRESS – Science and Technology Publications, Lda. All rights reserved

cations of abnormalities in retinal images (Deepak
et al., 2013). Lesions are detected based on their
saliency values and local binary pattern features using
a k-NN classifier. In the same vain, Zou et al proposed
a learning-based visual saliency model method for de-
tecting diagnostic diabetic macular edema regions of
interest (ROIs) in retinal images (Zou et al., 2016).
Others saliency-based solutions have shown promis-
ing results in ROI segmentation and lesion detection
for various diseases. For instance, in (Agrawal et al.,
2014), a novel framework is developed to automat-
ically detect masses from mammograms even in the
presence of regions of pectoral muscles. The frame-
work uses a saliency-based segmentation and features
extraction for mass description. With the aim to inves-
tigate the relevance of computational saliency models
in medical images and the context of lesion detection
in chest X-ray images, Jampani et al. conducted the
work described in (Jampani et al., 2012). Another au-
tomatic segmentation method of ROIs in MRI using
saliency information has been proposed by Mehmood
et al. (Mehmood et al., 2013a) together with the use
of active contours. A graph knowledge-based ap-
proach for internal brain structures recognition and
internal brain structures segmentation from 3D MRI
has been introduced in (Fouquier et al., 2012). Maha-
patra et al. (Mahapatra and Buhmann, 2015) proposed
a new approach for MRI prostate segmentation using
active learning and visual saliency. In (Yuan et al.,
2015), the authors proposed a visual saliency-based
computer-aided detection system to detect ulcers from
wireless capsule endoscopy images for human diges-
tive tract diagnosis. The proposed saliency method is
based on multi-level super-pixel color and texture rep-
resentation. In (Shao et al., 2015), the authors modu-
lated the radiologist’s visual attention from breast ul-
trasound (BUS) images to automatically locate suspi-
cious lesions. Automatic extraction and interpretation
method of focus tissues from Computerized Tomogra-
phy (CT) liver images using a visual attention model
is proposed in (Ma et al., 2009). The latter firstly ex-
tracts texture features of liver regions form Gaussian
pyramid of feature-component maps and the saliency
map is then generated by combining several conspicu-
ity maps. Finally, ROI candidates are located by la-
beling the obtained saliency map.
Recently, visual saliency models have been used
to model group difference in structural brain MRI for
neurodegenerative disease detection such as for AD.
In (Pulidoa et al., ; Pulido et al., 2013), the authors
extract relevant information from brain MRI using a
regional saliency method. They perform classifica-
tion of brain MR images, based on finding pathology-
related patterns through the identification of regional
structural changes, associated or not, to the presence
of probable AD or Mild Cognitive Impairment (MCI).
Rueda et al. proposed an automatic image analysis
method based on saliency maps for group diagnosis
(Rueda et al., 2014). The graph-based visual saliency
(GBVS) algorithm (Harel et al., 2006) is used to gen-
erate saliency maps to highlight particular regions.
In the aforementioned works, authors do not in-
clude any domain knowledge information regarding
AD which makes the model weak for specific AD
diagnosis tasks. They also straightforwardly use tra-
ditional and multimedia oriented saliency algorithms
without accounting for MRI images properties in the
AD diagnosis context. In addition, the used saliency
maps and kernel matrices require extensive computa-
tions. Those works are proposed for the group anal-
ysis study and they have no value at the individual
level. Contrariwise, we propose in this paper a novel
saliency model adapted to AD diagnosis from MRI
content interpretation at the individual level. The pro-
posed approach extracts, spots and describes ROIs in
the structural MRI images offering thus an assistance
to clinician in the AD diagnosis making stage. The
proposed model combines bottom-up and top-down
approaches using domain knowledge in AD diagno-
sis. The first part benefits from the low level MRI
characterization (texture and edge) while the second
is based on an embedded learning process to iden-
tify and rank discriminative regions for AD diagnosis.
The rest of the paper is organized as follows, section
2 is dedicated to the detailed description of the pro-
posed approach. Simulation results and discussions
are given in Section 3. Finally, Section 4 concludes
the paper and gives some openings for future work.
2 PROPOSED APPROACH
This section aims at presenting the proposed approach
to build the visual saliency maps for ROI detection in
the case of AD diagnosis. The proposed approach is
based on a combination of two subsystems : 1) the
bottom-up part corresponding to image features and
2) the top-down part relying on the knowledge and
expertise of radiologists in AD diagnosis. Figure 1
illustrated the pipeline of the proposed method high-
lighting the two subsystems mentioned above.
The bottom-up saliency map is computed using
edge and texture characteristics of the MRI images
while the top-down map is obtained by ranking from
MRI the effectiveness of the gray matter (GM) brain
regions to discriminate healthy brains from those af-
fected by AD using a machine learning strategy. The
final saliency map results from the fusion of the
Saliency Guided Computer-aided Diagnosis for Neurodegenerative Dementia
141
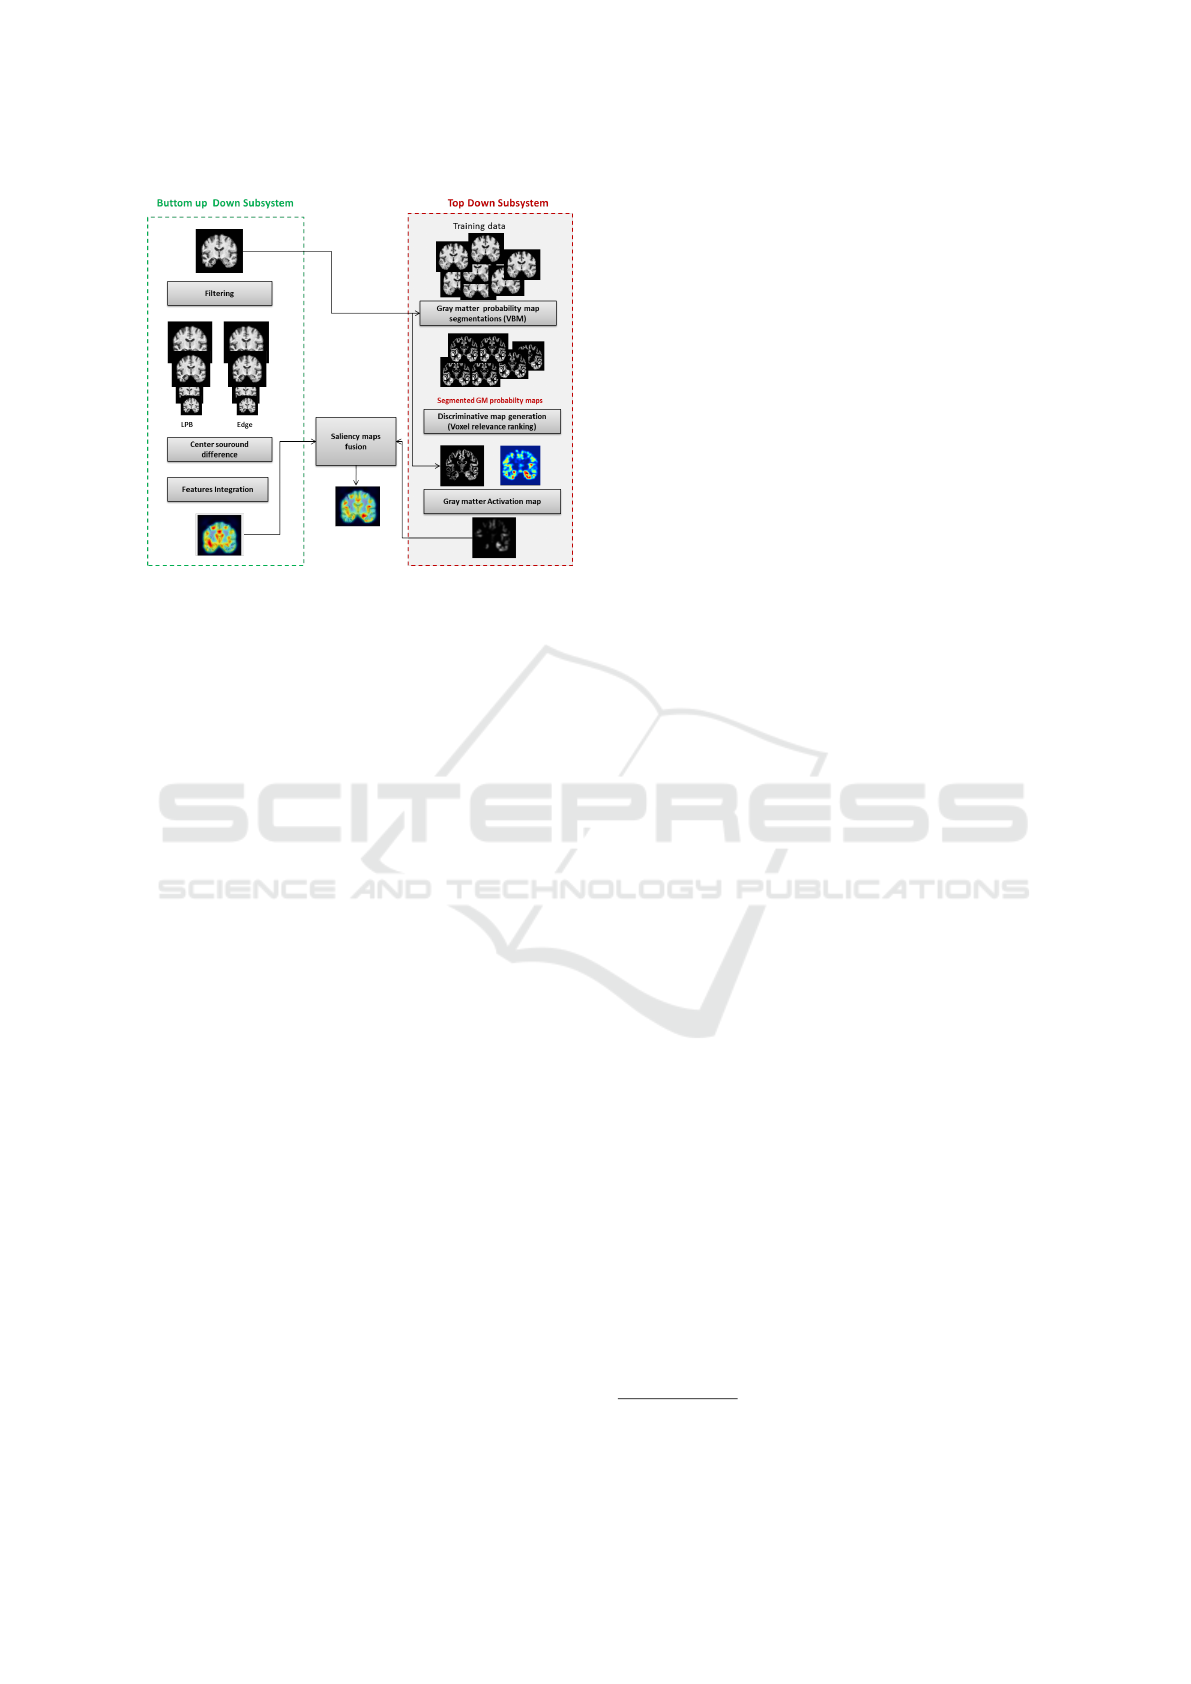
Figure 1: Pipeline of the proposed AD saliency map gener-
ation combining both bottom-up and top-down strategies.
saliency maps obtained respectively from the top-
down and bottom-up subsystems.
2.1 Domain Knowledge and Hypothesis
Generation in MRI Visual
Assessment
From a practical point of view, a clinician with some
expertise may be able to identify the most atrophic
brain areas on a given MRI image. This result is
achieved by looking for structural brain variations.
According to (Braak and Braak, 1998), the pattern of
cell neuro-degeneration seen using anatomical MRI
in several brain areas may be considered as sensi-
tive bio-markers for AD. In visual assessment-based
MRI analysis, the brain shrinkage could be seen as a
variation of tissue properties (i.e. density). In fact,
the brain tissue density reflects the amount of tissue
present in each subject’s image at a given location.
For example, a region of decreased density reflects
a reduced volume in this structure (increasing me-
dial temporal atrophy, MRI cortical thickness shrivels
up, loss of hippocampus volume and ventricular en-
largement in AD when compared with Normal Con-
trol (NC),etc). In the case of AD, the volume losses
generally convey a loss of GM cells (Blennow et al.,
2010). This is why neuro-imaging research is mostly
focused on this tissue.
2.2 Top-down Saliency Map
Locally shrunk brain structure is seen with differ-
ent proportion of GM compared to the case where
they are unaffected. Such a ”top-down” knowledge
is incorporated into a saliency map. Therefore, we
propose first to build a spatial map of GM tissues
using the voxel based morphometry (VBM) method
(Ashburner and Friston, 2000). Indeed, each MRI
is segmented into three tissues : GM, white mat-
ter (WM) and cerebrospinal fluid (CSF). This seg-
mentation is performed using a technique based on
a mixture of Gaussian distribution cluster analysis
which identifies voxels intensity distribution of a par-
ticular brain tissue. The obtained three probability
maps contain values in the range of 0 to 1, repre-
senting the prior probability of a voxel being either
GM, WM or CSF. These spatial maps give a quanti-
tative representation of the spatial distribution of tis-
sues in the brain, with brightness being proportional
to the amount of local tissue volume before warp-
ing. The probability of a voxel at (i; j) coordinates
belonging to cluster Class = {GM,W M,CSF} is de-
noted by P((i, j)/Class). For example, P((i, j)/GM)
is the probability of a voxel being GM.
Once the GM maps are built, we propose to mod-
ulate the clinician preference location by the ”so-
called” ranking map (Rank-Map). This is the first
stage to build the top-down saliency map. We learn
whether the brain tissue from AD patients could be
differentiated from that of NC in the standard space.
Therefore, we developed a recursive feature elimi-
nation (RFE) (Guyon et al., 2002) approach to re-
cursively learn relevant regions of GM. Our goal
is different from what is usually done to eliminate
non relevant features, it consists in ranking and pro-
jecting MRI GM voxels according to their contribu-
tion in separating AD and NC subjects into a spatial
map. The ranking criterion is derived from the SVM
(Hearst et al., 1998) model.
Subjects Data. For the purpose of this work, we
used the ADNI dataset
1
. For the Rank-Map genera-
tion, we selected from the ADNI dataset T1-weighted
structural MRI, a total of 205 participants with 95 AD
patients and 110 NCs. NC subjects aged between 60
and 92 have Mini Mental State Examination (MMSE)
scores ranging from 24 to 30 while AD subjects aged
between 55 and 91 have MMSE scores ranging from
18 to 27. Groups statistical difference was performed
using t-test, the p − value between groups for both
MMSE and age is < 0.001.
In our approach, each medical image is first pre-
processed by applying for each subject, corrections
for eddy currents and head motion, skull stripping
with the Brain Extraction Tool (BET) Software Li-
brary FSL
2
. Then, the whole set of MR images are
1
http://adni.loni.ucla.edu/
2
http://www.fmrib.ox.ac.uk/fsl
BIOIMAGING 2017 - 4th International Conference on Bioimaging
142
co-registered to the Montreal Neurological Institute
(MNI) standard space using MNI 512 brain template
(Frisoni et al., 2005) thanks to the freely available
VBM8 toolbox
3
using statistical parametric map-
ping (SPM)
4
software running on Matlab. After the
preprocessing stage, all MR images have a size of
121×145×121 voxels having a voxel size of 1.5 mm
×1.5 mm ×1.5 mm.
Given a training of instance label pairs (x
i
,y
i
),i =
1,...,l ( l is the number of training data) where x
i
∈ R
n
and y ∈ {1,−1}, x
i
is the feature vector of in n di-
mensions that describes the image and y
i
is the cor-
responding label of x
i
. SVM searches to find the op-
timal hyperplane that best separates the positive and
negatives training samples. The optimization problem
to resolve, in the case of the so-called ”soft margin”
classification, is the following:
minimize
w,ξ
1
2
kwk
2
+
C
l
l
∑
i=1
ξ
i
(1)
sub ject to y
i
(w
T
x
i
+ b) ≥ 1 − ξ
i
,ξ
i
≥ 0
ξ
i
are the so-called slack variables relaxing class-
separators constraints and C is a cost parameter that
controls the trade-off between allowing training er-
rors and forcing rigid margins. RFE was conducted by
ranking voxels in terms of magnitude of their weights
w where the ranking criterion is c
i
= (w
i
)
2
. Larger
the absolute magnitude of a weight vector is, stronger
it affects the final discrimination. At every iteration,
the feature f = argmin(c) will be removed. The SVM
then retrains the remaining features to obtain the new
feature sorting. SVM-RFE repeatedly implements the
process until obtaining a feature sorted list. Because
of the multivariate nature of the classifier, the distri-
bution of weights over all voxels can be interpreted
as the spatial pattern by which the groups differ (i.e.
the discriminating pattern). The SVM-RFE algorithm
was embedded within a leave-one-out cross valida-
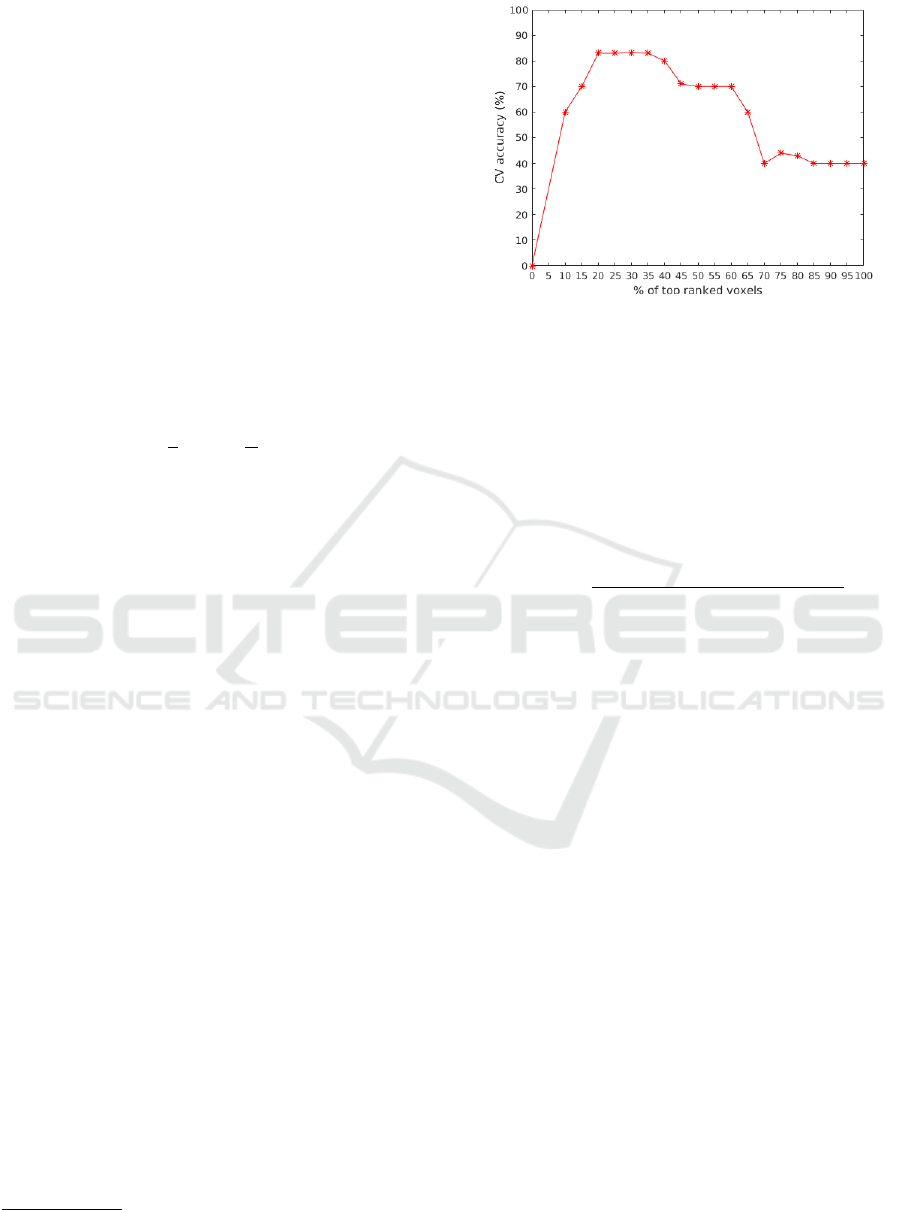
tion (LOO-CV) framework. The average CV accu-
racy over all subjects for each feature set size has been
computed to find the optimal number of features. The
percentage of most pertinent voxels is set to 30% cor-
responding to the best AD versus NC classification
accuracy as illustrated by Figure 2.
The Rank-Map is obtained by projecting the ob-
tained stored ranked features into the MNI coordi-
nate space Rank
map
(x,y) in which each pixel is rep-
resented by its rank r (more the pixel is relevant more
its intensity is higher). This pixel relevance illustrates
the clinician preference order in brain areas inspec-
3
http://dbm.neuro.uni-jena.de/vbm/
4
http://www.fil.ion.ucl.ac.uk/spm/software/
Figure 2: Percentage of top ranked voxels variation over CV
accuracy ( AD versus NC classification).
tion. The first ranked areas could be the most impor-
tant for clinician and consequently the first target to
examine.
Rank
map
(x,y) = r, (2)
where, (x,y) are the MNI coordinates of r
th
most im-
portant pixel. Finally the Rank-Map is normalized as
follows in order to build a ranking image:
Rank
map
=
Rank
map
− min(Rank
map
)
max(Rank
map
) − min(Rank
map
)
. (3)
The top-down saliency map is generated for each sub-
ject using the obtained standard Rank-Map. Referring
to the domain knowledge, we suppose that the clini-
cian gazes at the most important GM region (regions
captured by the normalized Rank-Map) in the GM
distribution. Therefore, we compute the top-down
saliency map of each subject by conserving only the
relevant features that represent non degenerated GM
tissues (P(GM) ≥ 0.5) (Ashburner and Friston, 2000).
S
T P
=
(
Rank
map
, if P(GM) ≥ 0.5).
0, otherwise.
(4)
The obtained top-down saliency map is normalized
between 0 to 1 and represents salient pixels for AD
diagnosis. All the degenerated GM voxels will be
presented by 0 meaning that they are not important
for the diagnosis and will be ignored for the visual as-
sessment made by the clinician. The S
T P
is spatially
smoothed using a Gaussian kernel G:
S
T P
= S
T P
∗ G (5)
2.3 Bottom-up Saliency Map
The image analysis methodology to extract discrim-
inant visual patterns for AD diagnosis is close to vi-
sual inspection performed by the clinician. Hence,
Saliency Guided Computer-aided Diagnosis for Neurodegenerative Dementia
143

we propose a system based on the Itti model (Itti
et al., 1998). Referring to the domain knowledge,
two saliency cues are consolidated to generate fea-
tures maps :
2.3.1 Edge Cue
Edge detection identifies and locates abrupt changes
of pixel intensity in MRI which could characterize a
discontinuity in the gray matter. We use the Canny
edge detector for that task.
2.3.2 Texture Cue
To describe the texture from the MRI images, we re-
sort to the well-known local binary pattern (LBP) de-
scriptor which is proved to be the most used and effi-
cient descriptor to analyze MRI texture for AD diag-
nosis. LBP comprises a binary code that is obtained
by thresholding a neighborhood according to the gray
value of its center. Given a center pixel in the im-
age, the LBP value is computed by comparing its gray
value with its neighbors. The LBP map of the brain
tissue resulting from texture classification reduces the
risk of omission and ensures the reproducibility of the
diagnosis by drawing the radiologists attention on di-
agnostically interesting parts.
Texture and edge Features are extracted on mul-
tiple scales of the MRI slice and stored in separate
feature maps. A unique saliency map is generated
through the combination of centre-surround feature
maps (conspicuity maps). Finally, a weighted mean
of conspicuity maps produces the saliency maps S
BU
.
2.3.3 Feature Maps Fusion
Finally, the conspicuous maps are fused into a single
saliency map as follows:
S
BU
=
1
2
(Map(LBP) + Map(Edge)) (6)
2.4 Final Saliency Model
The final saliency map is obtained as a fusion of afore-
mentioned top-down and bottom-up maps. The used
fusion is a geometric mean between both maps as de-
scribed below :
FS
AD
=
p
S
T P
.S
BU
(7)
3 RESULTS AND DISCUSSION
3.1 Visual Anatomical Interpretation
With the aim to evaluate the proposed approach, the
saliency map is generated using the proposed ap-
proach on the MRI of an NC subject. Figure 3
presents the overlaid saliency maps on the MRI slices
for this subject. Saliency maps are color-coded ac-
cording to the relevance of brain regions. For in-
stance, red spots represent the most visually salient
(relevant for diagnosis) areas of the MRI. The ob-
tained saliency maps effectively detect and quantify
regions of interest that are known to be altered in the
degenerative disease and could be more prominent for
the clinician attention. In order to consider the differ-
ence of saliency maps between AD and NC cases, we
compute also saliency maps on the MRI of AD sub-
jects. Saliency maps are illustrated on Figure 4
By mapping the obtained saliency maps, for both
NC and AD subjects, with standard anatomical atlas
(AAL) (Tzourio-Mazoyer et al., 2002), it is possible
to identify the brain areas involved in the discrimina-
tion between AD and NC, namely the hippocampus,
the parahippocampal gyrus, the entorhinal cortex, and
the amygdale. However, when the regions are not yet
shrunk (this is the case of NC MRI), clinicians tend
to pay more attention to details within the salient re-
gions. This explains the fact that NC saliency maps
are different (see slice s = 85 and s = 80 from Figure
3 and slice s = 75 and s = 80 from Figure 4) over the
corresponding anatomical regions. Another observa-
tion concerns the cerebral cortex and temporal lobe
(slices 45) that is more salient in the MRI of the AD
subjects than NC ones. This indicates that, with the
progress in AD, more atrophies are produced. Thus, a
small number of brain regions with relatively large at-
rophies is sufficient for a successful detection of AD.
From those saliency maps, we can see that detected
regions of interest differ between AD and NC patients
depending on the degree of the brain atrophy. Hence,
the saliency maps help in discovering meaningful vi-
sual patterns witch could be helpful to discriminate
AD subjects from NC.
In addition, saliency map shows the ROI prefer-
ence order (hierarchy) for the diagnosis, hence, the
lateral ventricle and the cortex are detected later (less
salient). In addition, the saliency maps help to detect
the real volume of the hippocampus ROI which con-
stitutes a key step to its effective segmentation.
One would ask about the performance of state-of-
the-art saliency models on such a specific problem.
To answer this, Figure 5 presents examples of MRI
saliency maps generated by our proposed method,
BIOIMAGING 2017 - 4th International Conference on Bioimaging
144
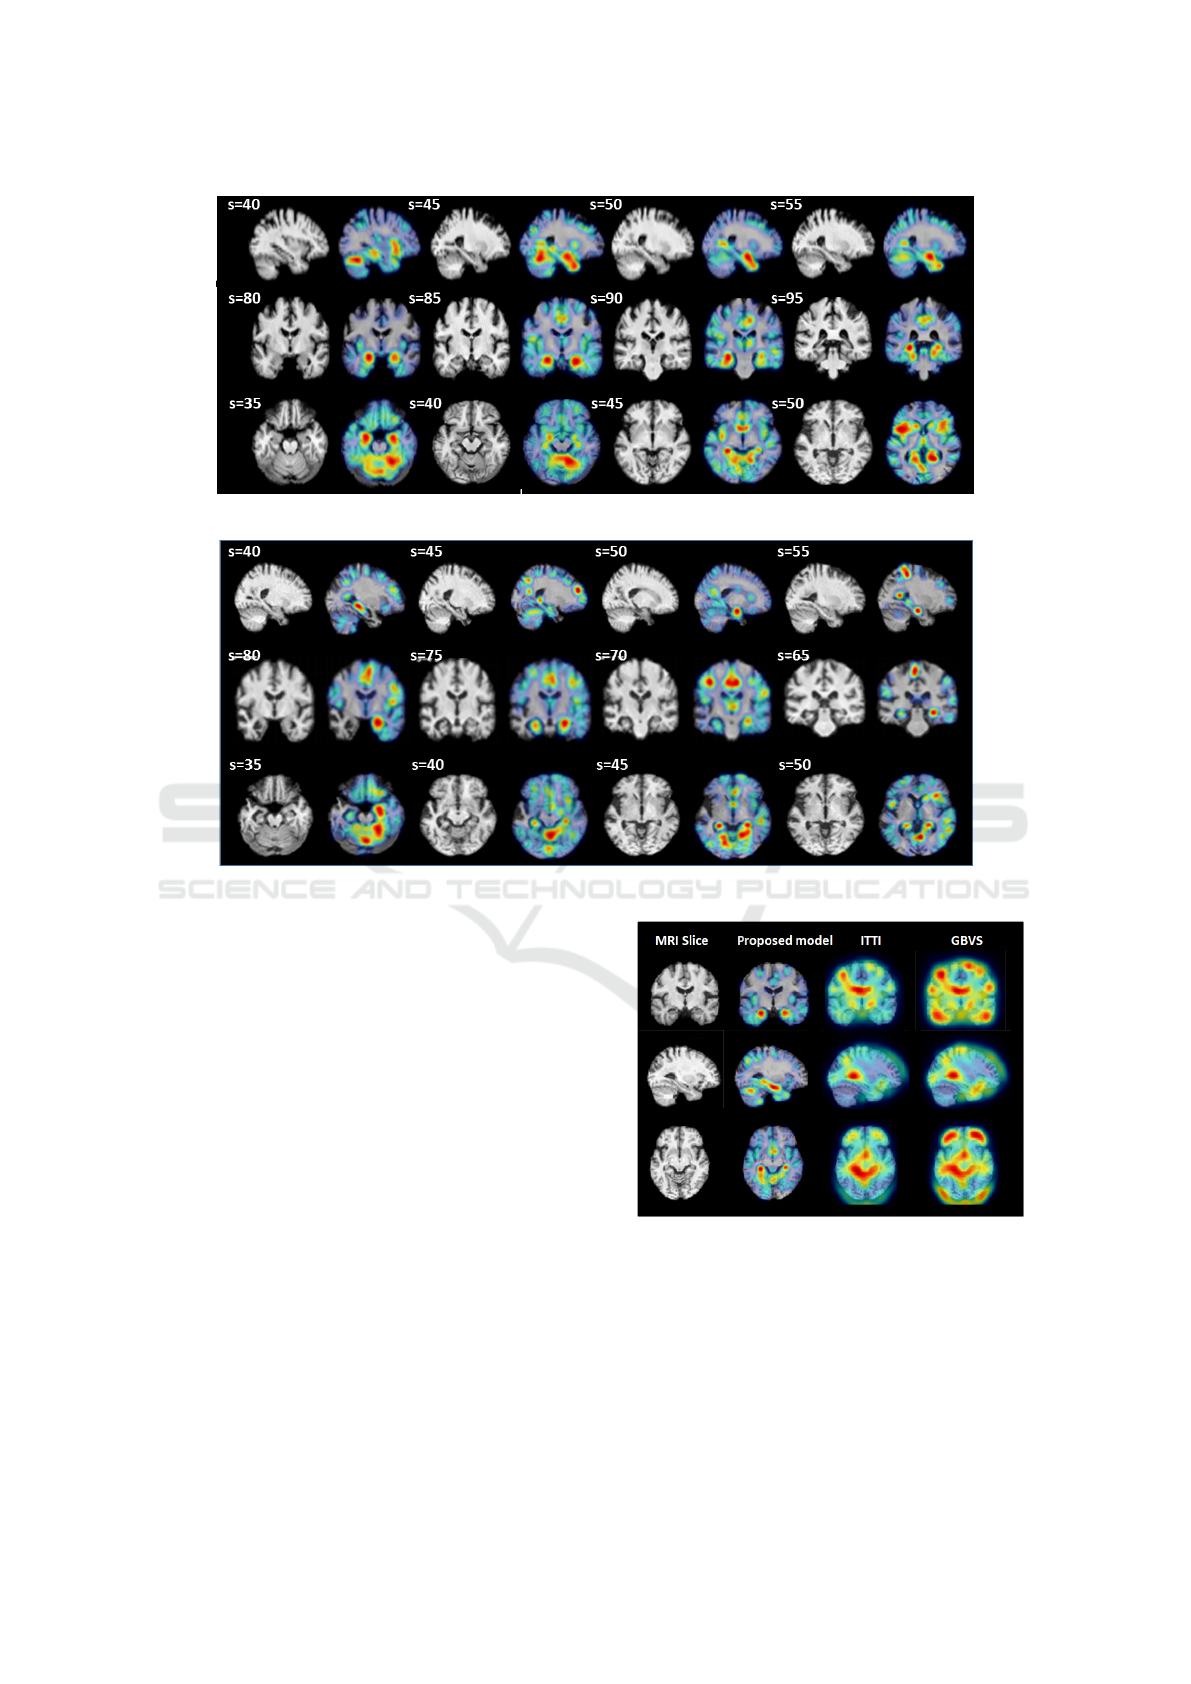
Figure 3: MRI slices selection of NC subject (the subject is 86 years old with an MMSE equal to 30).
Figure 4: MRI slices selection of AD subject (the subject is 80 years old with an MMSE equal to 25).
and by two famous saliency models namely Itti and
GBVS. Those models were proposed for natural
scene interpretation. From the illustrated results, it is
obvious to notice that both Itti and GBVS algorithms
failed to detect relevant regions for Alzheimer’s dis-
ease compared to our proposed approach. This con-
firms the role of domain knowledge in improving au-
tomatic MRI content analysis and interpretation.
3.2 Subjects Classification
In order to check discrimination capability of our ap-
proach, we propose to classify subjects using their
saliency maps. An SVM with the histogram intersec-
tion kernel (HIK) is used for the classification. The
SVM is trained using the normalized saliency maps
generated for the subjects in the training set. The
diagnostic classification was conducted by selecting
a total of 188 subjects from the ADNI database and
grouping them into AD, NC and MCI. The AD group
contains 66 subjects aged in (76.2 ± 7.4) years with
an MMSE ranging in (24.5 ± 0.71). In turn, the NC
group contains 54 NC aged in (79 ± 5.3) years with
Figure 5: Comparison of the output of our proposed model
with regards to two widely used saliency models: Itti and
GBVS.
an MMSE ranging in (29.5 ± 1.3). Finally, the MCI
group contains 68 NC ranging in (71.2 ± 5.7) years
with an MMSE in the mean (27.6 ± 0.5).
Two binary classification problems, AD vs. NC
and MCI vs. NC, have been investigated. To evaluate
the performance of different classification methods,
Saliency Guided Computer-aided Diagnosis for Neurodegenerative Dementia
145

we use 5-fold cross-validation strategy to compute the
classification accuracy (for measuring the proportion
of subjects correctly classified among the whole pop-
ulation), as well as the sensitivity (i.e., the proportion
of AD or MCI patients correctly classified) and the
specificity (i.e., the proportion of healthy controls cor-
rectly classified). Classification results are presented
in Table 1.
Table 1: Diagnostic classification results between AD vs.
NC and MCI vs. NC.
Groups Accuracy Sensitivity Specificity
AD vs NC 81.48 % 83.33% 94.8%
MCI vs NC 76.66% 73.3% 79.82%
For classifying AD from NC, our method achieves
a classification accuracy of 81.48%, a sensitivity of
83.33%, and a specificity of 94.8%. On the other
hand, for classifying MCI from NC our method
achieves a classification accuracy of 76.66%, a sensi-
tivity of 73.3%, and a specificity of 79.82%. Obtained
results show that our saliency based atrophy detection
approach allows to consistently distinguish subjects
with AD or MCI from NC.
4 CONCLUSION
This paper proposed a novel approach for computer-
aided diagnosis based on saliency estimation. The
proposed framework is based on both bottom-up and
top-down subsystems using domain knowledge in
AD diagnosis. In the bottom-up approach, informa-
tion comes from low-level MRI characterization (tex-
ture and edge) and the top-down approach includes
a learning process to identify and localize the sub-
set of gray matter regions that provide optimal dis-
crimination between groups. The proposed method
could help clinicians to evaluate their diagnosis find-
ings. This also makes the diagnosis easier for clini-
cians with a limited expertise to extract diagnostically
useful and objective information. Future work con-
sists in performing clinician’s gazes tracking to im-
prove the proposed model with ground truth.
ACKNOWLEDGEMENT
Data collection and sharing for this work was funded
by the Alzheimer’s Disease Neuroimaging Initiative
(ADNI) (National Institutes of Health Grant U01
AG024904). ADNI is funded by the National Institute
on Aging, the National Institute of Biomedical Imag-
ing and Bioengineering, and through generous con-
tributions from the following: Abbott; Alzheimer’s
Association; Alzheimer’s Drug Discovery Founda-
tion; Amorfix Life Sciences Ltd.; AstraZeneca;
Bayer HealthCare; BioClinica, Inc.; Biogen Idec
Inc.; Bristol-Myers Squibb Company; Eisai Inc.;
Elan Pharmaceuticals Inc.; Eli Lilly and Company;
F. Hoffmann-La Roche Ltd and its affiliated com-
pany Genentech, Inc.; GE Healthcare; Innogenetics,
N.V.; IXICO Ltd.; Janssen Alzheimer Immunother-
apy Research and Development, LLC.; Johnson and
Johnson Pharmaceutical Research and Development
LLC.; Medpace, Inc.; Merck and Co., Inc.; Meso
Scale Diagnostics, LLC.; Novartis Pharmaceuticals
Corporation; Pfizer Inc.; Servier; Synarc Inc.; and
Takeda Pharmaceutical Company. The Canadian In-
stitutes of Health Research is providing funds to sup-
port ADNI clinical sites in Canada. Private sector
contributions are facilitated by the Foundation for
the National Institutes of Health www.fnih.org. The
grantee organization is the Northern California In-
stitute for Research and Education, and the study
is coordinated by the Alzheimer’s Disease Coopera-
tive Study at the University of California, San Diego.
ADNI data are disseminated by the Laboratory for
Neuro Imaging at the University of California, Los
Angeles. This research was also supported by NIH
grants P30 AG010129 and K01 AG030514.
REFERENCES
Agrawal, P., Vatsa, M., and Singh, R. (2014). Saliency
based mass detection from screening mammograms.
Signal Processing, 99:29 – 47.
Ashburner, J. and Friston, K. J. (2000). Voxel-based mor-
phometrythe methods. Neuroimage, 11(6):805–821.
Banerjee, S., Mitra, S., Shankar, B. U., and Hayashi, Y.
(2016). A novel gbm saliency detection model using
multi-channel mri. PloS one, 11(1).
Blennow, K., Hampel, H., Weiner, M., and Zetterberg, H.
(2010). Cerebrospinal fluid and plasma biomarkers
in Alzheimer disease. Nature Reviews Neurology,
6(3):131–144.
Braak, H. and Braak, E. (1998). Evolution of neuronal
changes in the course of Alzheimer’s disease. Neu-
rology, 53:127–140.
Chung, A. G., Scharfenberger, C., Khalvati, F., Wong, A.,
and Haider, M. A. (2015). Image Analysis and Recog-
nition: 12th International Conference, ICIAR 2015,
Niagara Falls, ON, Canada, July 22-24, 2015, Pro-
ceedings, chapter Statistical Textural Distinctiveness
in Multi-Parametric Prostate MRI for Suspicious Re-
gion Detection, pages 368–376. Springer Interna-
tional Publishing, Cham.
Deepak, K. S., Chakravarty, A., Sivaswamy, J., et al. (2013).
Visual saliency based bright lesion detection and dis-
crimination in retinal images. In Biomedical Imaging
BIOIMAGING 2017 - 4th International Conference on Bioimaging
146

(ISBI), 2013 IEEE 10th International Symposium on,
pages 1436–1439. IEEE.
Fouquier, G., Atif, J., and Bloch, I. (2012). Sequential
model-based segmentation and recognition of image
structures driven by visual features and spatial rela-
tions. Computer Vision and Image Understanding,
116(1):146 – 165. Virtual Representations and Mod-
eling of Large-scale Environments (VRML).
Frisoni, G. B., Testa, C., Sabattoli, F., Beltramello, A.,
Soininen, H., and Laakso, M. P. (2005). Structural
correlates of early and late onset Alzheimers disease:
voxel based morphometric study. Journal of Neurol-
ogy, Neurosurgery and Psychiatry, 76(1):112–114.
Guyon, I., Weston, J., Barnhill, S., and Vapnik, V. (2002).
Gene selection for cancer classification using support
vector machines. Machine learning, 46(1-3):389–422.
Harel, J., Koch, C., and Perona, P. (2006). Graph-based vi-
sual saliency. In Advances in neural information pro-
cessing systems, pages 545–552.
Harper, L., Fumagalli, G. G., Barkhof, F., Scheltens, P.,
O’Brien, J. T., Bouwman, F., Burton, E. J., Rohrer,
J. D., Fox, N. C., Ridgway, G. R., and Schott, J. M.
(2016). Mri visual rating scales in the diagnosis of
dementia: evaluation in 184 post-mortem confirmed
cases. Brain.
Hearst, M. A., Dumais, S. T., Osman, E., Platt, J., and
Scholkopf, B. (1998). Support vector machines.
Intelligent Systems and their Applications, IEEE,
13(4):18–28.
Itti, L., Koch, C., Niebur, E., et al. (1998). A model of
saliency-based visual attention for rapid scene analy-
sis. IEEE Transactions on pattern analysis and ma-
chine intelligence, 20(11):1254–1259.
Jampani, V., Sivaswamy, J., Vaidya, V., et al. (2012). As-
sessment of computational visual attention models on
medical images. In Proceedings of the Eighth Indian
Conference on Computer Vision, Graphics and Image
Processing, page 80. ACM.
Lala, D. and Nakazawa, A. (2016). Heat map visualiza-
tion of multi-slice medical images through correspon-
dence matching of video frames. In Proceedings of
the Ninth Biennial ACM Symposium on Eye Tracking
Research & Applications, ETRA ’16, pages 119–122,
New York, NY, USA. ACM.
Li, R., Shi, P., and Haake, A. R. (2013). Image understand-
ing from experts’ eyes by modeling perceptual skill of
diagnostic reasoning processes. In Computer Vision
and Pattern Recognition (CVPR), 2013 IEEE Confer-
ence on, pages 2187–2194.
Ma, L., Wang, W., Zou, S., and Zhang, J. (2009). Liver
focus detections based on visual attention model. In
2009 3rd International Conference on Bioinformatics
and Biomedical Engineering, pages 1–5.
Mahapatra, D. and Buhmann, J. M. (2015). Machine Learn-
ing in Medical Imaging: 6th International Workshop,
MLMI 2015, Held in Conjunction with MICCAI 2015,
Munich, Germany, October 5, 2015, Proceedings,
chapter Visual Saliency Based Active Learning for
Prostate MRI Segmentation, pages 9–16. Springer In-
ternational Publishing, Cham.
Mehmood, I., Baik, R., and Baik, S. W. (2013a). Automatic
Segmentation of Region of Interests in MR Images Us-
ing Saliency Information and Active Contours, pages
537–544. Springer Netherlands, Dordrecht.
Mehmood, I., Ejaz, N., Sajjad, M., and Baik, S. W. (2013b).
Prioritization of brain {MRI} volumes using medi-
cal image perception model and tumor region seg-
mentation. Computers in Biology and Medicine,
43(10):1471 – 1483.
Nodine, C. F. and Kundel, H. L. (1987). Using eye move-
ments to study visual search and to improve tumor de-
tection. Radiographics, 7(6):1241–1250.
Pulido, A., Rueda, A., and Romero, E. (2013). Classifi-
cation of alzheimer’s disease using regional saliency
maps from brain mr volumes. In SPIE Medical Imag-
ing, pages 86700R–86700R. International Society for
Optics and Photonics.
Pulidoa, A., Rueda, A., and Romeroa, E. Extracting re-
gional brain patterns for classification of neurodegen-
erative diseases. In Proc. of SPIE Vol, volume 8922,
pages 892208–1.
Rueda, A., Gonzalez, F., Romero, E., et al. (2014). Extract-
ing salient brain patterns for imaging-based classifica-
tion of neurodegenerative diseases. Medical Imaging,
IEEE Transactions on, 33(6):1262–1274.
Shao, H., Zhang, Y., Xian, M., Cheng, H. D., Xu, F., and
Ding, J. (2015). A saliency model for automated tu-
mor detection in breast ultrasound images. In Image
Processing (ICIP), 2015 IEEE International Confer-
ence on, pages 1424–1428.
Tzourio-Mazoyer, N., Landeau, B., Papathanassiou, D.,
Crivello, F., Etard, O., Delcroix, N., Mazoyer, B., and
Joliot, M. (2002). Automated anatomical labeling of
activations in {SPM} using a macroscopic anatomi-
cal parcellation of the {MNI} {MRI} single-subject
brain. NeuroImage, 15(1):273 – 289.
Wen, G., Aizenman, A., Drew, T., Wolfe, J. M., Hay-
good, T. M., and Markey, M. K. (2016). Computa-
tional assessment of visual search strategies in volu-
metric medical images. Journal of Medical Imaging,
3(1):015501–015501.
Yuan, Y., Wang, J., Li, B., and Meng, M. Q. H. (2015).
Saliency based ulcer detection for wireless capsule en-
doscopy diagnosis. IEEE Transactions on Medical
Imaging, 34(10):2046–2057.
Zou, X., Zhao, X., Yang, Y., and Li, N. (2016). Learning-
based visual saliency model for detecting diabetic
macular edema in retinal image. Computational In-
telligence and Neuroscience, 2016.
Saliency Guided Computer-aided Diagnosis for Neurodegenerative Dementia
147
