
Extracting Android Malicious Behaviors
∗
Khanh-Huu-The Dam
1
and Tayssir Touili
2
1
University Paris Diderot and LIPN, Villetaneuse, France
2
LIPN, CNRS and University Paris 13, Villetaneuse, France
Keywords:
Malware Detection, Android Malwares, Static Analysis, Information Retrieval.
Abstract:
The number of Android malwares is increasing quickly. That makes the Android devices more vulnerable
while they are the target of malware’s writers. Thus, the challenge nowadays is to detect the malicious Android
applications. To this aim, we need to know what are the malicious behaviors that Android malwares apply.
In this paper, we introduce a method to automatically extract the malicious behaviors for Android malware
detection. We present the behaviors of an Android application by an API call graph and we use a malicious
API graph to represent the malicious behaviors. Then, given a set of malicious and benign applications, we
compute the malicious behaviors by extracting from the API call graphs the subgraphs that are relevant to the
malicious API call graphs but not relevant to the benign ones. This relevance is measured by applying the
TFIDF weighting scheme widely used in the Information Retrieval Community. These malicious API graphs
are applied to detect malicious applications. We obtained encouraging results with a recall rate of 92% and a
precision of 98%.
1 INTRODUCTION
Since the number of Android users is growing very
fast in recent years, the number of Android applica-
tions is also increasing as well. As a consequence of
that growth, the target of malware’s writers is chang-
ing and focusing on Android users. Thus, the num-
ber of variants of Android malwares increases year
by year. According to the report of Symantec
2
, this
number increased from 3262 in 2013 to 3944 in 2015.
Thus, the challenge is to detect the malicious Android
applications.
A well known technique for Android malware de-
tection is based on the analysis of the permission re-
quirements. This technique consists of the analysis
of the Android manifest file where all the required
permissions and necessary components of an Android
application are declared. These permissions are re-
quired by an application when users install it to their
device. Then, once these permissions are gained for
an application, it can make harmful operations to the
system without informing to the user. So, the permis-
sion requirements can be a signature to distinguish the
malicious applications. There are serval works (Aung
and Zaw, 2013; Zhang et al., 2013; Tchakount
´
e, 2014;
∗
This work was partially funded by the FUI project AIC
2.0.
2
https://www.symantec.com/security-center/threat-
report
Talha et al., 2015) that applied this technique to de-
tect Android malwares. However, (Aafer et al., 2013)
shows that detecting malwares by analyzing the per-
mission requirements is not robust, especially when
the malicious behavior can be executed without any
additional permission. Moreover, in Android OS ver-
sion 6.0 and later versions, the applications are able
to request the permissions at run-time
3
. Thus, these
permissions are not stored in the manifest file.
To overcome this limitation, other works (Bur-
guera et al., 2011; Dimja
ˇ
sevic et al., 2015; Canfora
et al., 2015; Jang et al., 2016; Malik and Khatter,
2016) try to detect Android malwares by dynamically
analyzing the execution of the Android applications.
In these works, the behaviors of an application is an-
alyzed via its execution traces while running it in a
simulated environment. However, the dynamic anal-
ysis allows only to analyze the behaviors of Android
applications in a limited time interval. Thus, it can-
not detect the malicious behavior if it occurs after this
time interval.
To sidestep the limitations of the above ap-
proaches, (Aafer et al., 2013; Sharma and Dash, 2014;
Song and Touili, 2014) apply static analysis for de-
tecting the malicious applications. In these works, the
authors specify the malicious behaviors by sequences
of API calls of the Android application. APIs (Ap-
3
https://developer.android.com/guide/topics/security/
permissions.html
714
Dam, K-H-T. and Touili, T.
Extracting Android Malicious Behaviors.
DOI: 10.5220/0006288807140723
In Proceedings of the 3rd International Conference on Information Systems Security and Privacy (ICISSP 2017), pages 714-723
ISBN: 978-989-758-209-7
Copyright
c
2017 by SCITEPRESS – Science and Technology Publications, Lda. All rights reserved
plication Programming Interfaces) are functions sup-
ported by the Android OS and Android applications
use them to access the system services and the system
data. Obviously, the harmful tasks related to the sys-
tem are operated by API calls. For instance, (Aafer
et al., 2013; Sharma and Dash, 2014) analyze the ap-
plications by looking at the different calls to these API
functions. In a more advanced analysis, (Song and
Touili, 2014) specifies the behaviors (not the syntax)
of the Android applications by doing the static analy-
sis on the Android codes without installing/executing
it. However, in this work the malicious behaviors are
discovered by studying manually the Android codes.
This task is time consuming and requires a huge en-
gineering effort. Thus, one of the current challenges
in Android malware detection is the automatic extrac-
tion of malicious behaviors.
In this paper, we propose a way to extract the
malicious behavior of the Android applications au-
tomatically. Following (Aafer et al., 2013; Sharma
and Dash, 2014; Song and Touili, 2014), we model
the malicious behaviors via API calls. Let us look
at a typical behavior of an Android trojan SMS spy.
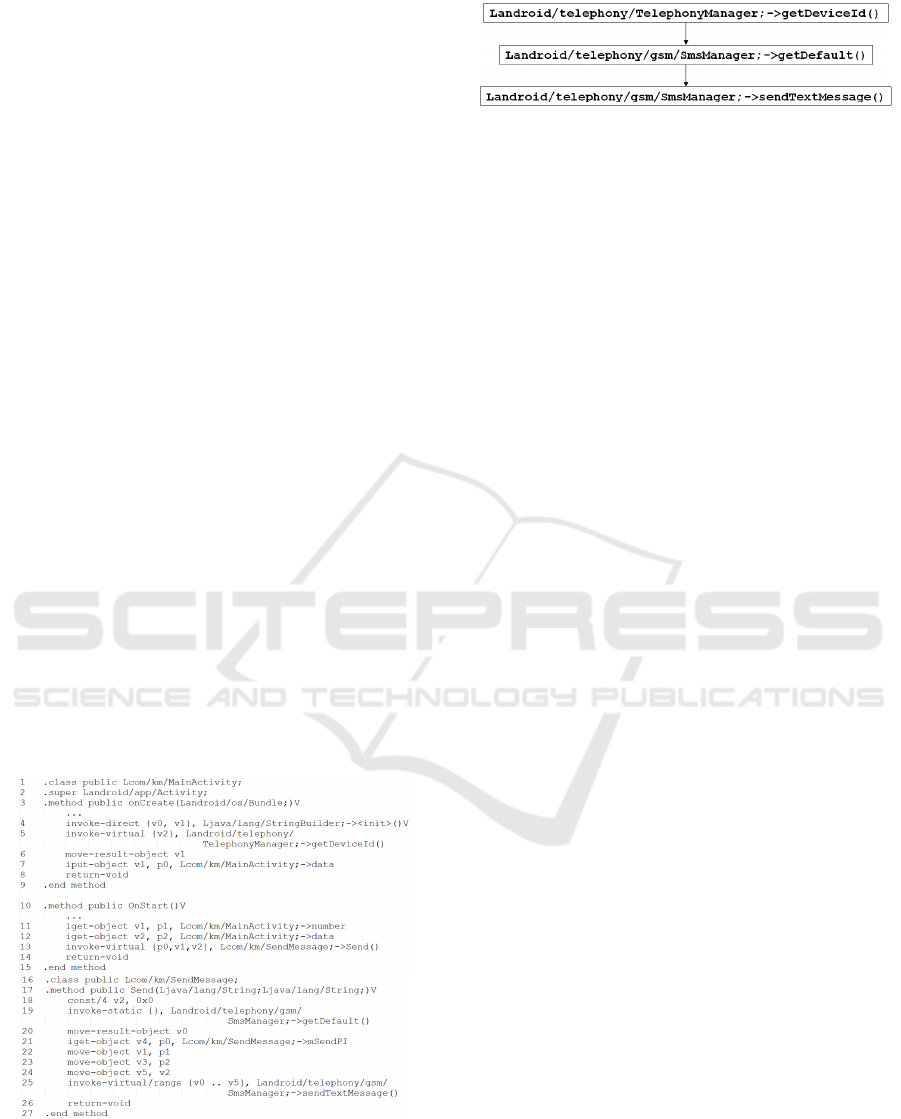
The smali code of this behavior is given in Figure
1. This behavior consists in collecting the phone
id and then sending this data via a text message.
This task is done by a sequence of API calls. First,
the function getDeviceId() is called at line 5 to col-
lect the phone id. Then, the TelephonyManager ob-
ject is gotten by calling getDefault() at line 19. Fi-
nally, the phone id is sent to an anonymous phone
number via a text message by calling sendTextMes-
sage() at line 25. To represent this behavior, we
Figure 1: A piece of smali code of an Android trojan SMS
spy.
use a malicious API graph which is a graph whose
nodes are API functions, and whose edges ( f , f
0
) ex-
press that API function f is called before API func-
Figure 2: A malicious API graph of an Android trojan SMS
spy.
tion f
0
. Figure 2 shows the malicious API graph
of this behavior. The edges express that a call to
the function Landroid/telephony/TelephonyManager;
-¿ getDeviceId() is followed by the calls to the func-
tions Landroid/telephony/gsm/SmsManager; -¿ get-
Default() and Landroid/telephony/gsm/SmsManager;
-¿ sendTextMessage().
Using this representation, the goal of this paper is to
automatically extract such malicious API graphs. In
order to do that, we represent the Android applica-
tion using an API call graph, which is a graph whose
nodes are pairs (m, f ) consisting of an API f and a
control point m, and whose edges ((m, f ),(m
0
, f
0
)) ex-
press that there is a call to the API f at the control
point m, followed by a call to the API f
0
at the control
point m
0
. After extracting this malicious API graph,
the malware detection phase is done by making a kind
of product between the API call graph of the new ap-
plication and the malicious API graphs. The applica-
tion is marked as malicious if the product contains a
feasible trace. Otherwise, it is marked as benign.
Then, given a set of API call graphs that corre-
spond to malicious applications and a set of API call
graphs corresponding to benign applications, we want
to extract in a completely automatic way the mali-
cious API graphs that correspond to the malicious
behaviors of these malicious applications. The mali-
cious API graph can be seen as a subgraph of the API
call graphs of the malicious applications that repre-
sents the malicious behavior. The sufficient subgraphs
that should be extracted can be used to distinguish
the malicious API call graphs from the benign ones.
Thus, our goal is to isolate the few relevant subgraphs
from the irrelevant ones. This problem can be seen
as an Information Retrieval (IR) problem, where the
goal is to retrieve the relevant items and reject the ir-
relevant ones. The IR community have extensively
studied this problem over the last 35 years. Several
approaches have been proposed and successfully ap-
plied in several applications, such as email search-
ing, text searching, image searching, etc. One of the
most popular techniques in IR is the TFIDF weight-
ing scheme where relevant terms are extracted from
the documents in a collection by associating a weight
to each term. The term that has the higher weight is
the more relevant. In this paper, we adapt the TFIDF
weighting scheme in IR to our API call graphs in or-
Extracting Android Malicious Behaviors
715

der to generate the malicious graphs. For that, we
associate to each node and each edge in the API call
graphs of the Android applications in the collection a
weight. Then, the malicious API graphs are computed
by taking edges and nodes with the highest weights.
We implemented this technique in a tool which
consists of two phases: the training phase and the de-
tection phase. In the training phase, we extract the
malicious API graphs from the training set which is
a collection of malicious applications and benign ap-
plications: First, we unpack and decompile each An-
droid application from the Android package file (APK
file). Then, we construct the control flow graph to rep-
resent the execution of this application. After that, we
model its behaviors in an API call graph. Once we
get the API call graphs of all the applications, we ap-
ply the TFIDF weighting scheme to get the relevant
terms in the malicious graphs and automatically ex-
tract the malicious API graphs. In the detection phase,
we use these malicious API graphs for detecting the
malicious behaviors in the new applications. In or-
der to evaluate the performance of our approach, we
apply the tool on a data set of 3100 malicious appli-
cations which are collected from Drebin data set (Arp
et al., 2014) and 459 benign applications taken from
apkpure.com. We obtained encouraging results with
a recall rate of 92% and a precision rate of 98%.
Outline. We present a way to construct the control
flow graph for an Android application and define our
API call graph model in Section 3. Section 4 intro-
duces our malicious API graphs. In Section 5, we
present the malicious behavior computation. Experi-
ments are given in Section 6.
2 RELATED WORKS
Information retrieval techniques were applied for
malware detection in (Masud et al., 2008; Cheng
et al., 2013; Santos et al., 2013; Dam and Touili,
2016). . However, these works do not consider An-
droid malwares. In this work, we extend the work of
(Dam and Touili, 2016) to Android malwares.
The first technique used for Android malware de-
tection is based on the analysis of the manifest file
where the required permissions are stored. (Aung and
Zaw, 2013; Talha et al., 2015) extract the set of per-
missions needed for malicious behaviors. (Aung and
Zaw, 2013) constructs a bit-vector of permissions to
represent android applications and implements a clas-
sifier to distinguish the malicious applications from
the benign ones. As for (Talha et al., 2015), they ex-
tract information from the Android manifest file, such
as application permissions, application services and
application receivers to build a database of signatures
for malware detection. As we have mentioned before,
Android malware detection based on the analysis of
permissions is not robust since the malicious behav-
iors may occur without any declaration in the Android
manifest file.
API calls are used for Android malware specification
in (Aafer et al., 2013; Arp et al., 2014; Sharma and
Dash, 2014; Jang et al., 2016). (Sharma and Dash,
2014; Arp et al., 2014) analysze the manifest file and
the API calls to specify the behaviors. They filter out
the suspicious APIs which are potentially used in the
malicious behaviors. In (Sharma and Dash, 2014),
the authors select 35 features from the set of features
for classifying the malicious applications. (Arp et al.,
2014) construct a huge bit-vector of roughly 545,000
features to classify malicious applications.
(Aafer et al., 2013) use API calls to describe be-
haviors of an application and use common classifiers
such as ID3, SVM and C4.5 to classify the malicious
behaviors. (Jang et al., 2016) generates a profile of the
API calls that are invoked in the application to specify
the behavior of the application. This profile describes
the usages of all API functions and their objects in
an application. The authors introduce a decision pro-
cess to detect malicious applications by comparing
the similarities between profiles.
In another work, (Canfora et al., 2015) considers
sequences of system calls as a specification of the
application’s behaviors. The occurrences of subse-
quences with length n in each sequence is taken into
account in the construction of the feature vector to
represent the applications. Then, the authors imple-
ment a SVM classifier for malware detection. How-
ever, they use dynamic analysis to capture the traces
of the application’s execution. Thus, they take into
account only one execution of the application.
In our work, we also use API calls to represent the
behaviors of an Android application. However, with
the API call graph representation we take into account
the order of API function calls in all the executions of
an application. So, our API call graphs are more pre-
cise than the representations used in the works cited
above. Moreover, we are able to extract the malicious
behaviors of the malicious applications as malicious
API graphs while none of the above works extract
the malicious behaviors of Android applications auto-
matically. Our malicious API graphs are also used to
detect malicious applications. Furthermore, our tech-
nique is completely static, we do not use any dynamic
analysis.
(Song and Touili, 2014) apply static analysis for
Android malware detection. However, this work is
based on manually studying the codes of the Android
ForSE 2017 - 1st International Workshop on FORmal methods for Security Engineering
716

applications to extract the malicious behaviors while
our work allows to extract automatically these behav-
iors.
3 MODELING ANDROID
APPLICATIONS
During the execution of an Android application, dif-
ferent events from the users or the system need to be
taken into account. Thus, the entry points of an An-
droid application are specified by the event handlers
which are methods called when there is an event that
occurs in the system or from the user like opening the
application, touch on the screen, etc. By taking into
account the event handlers in the Android code, we
construct the control flow graph which represents all
the operations in an Android application. Then, we
extract an API call graph to represent the behaviors
of the application. We introduce all these steps in this
section.
3.1 Android Applications
An Android application is installed into the Android
devices via an Android package (an APK file) which
consists of (1) Dalvik bytecode (a dex file) which is
executable, (2) all resources, and (3) an Android man-
ifest file which contains the declaration of all the per-
mission requirements and necessary components used
in the application’s execution. In order to analyze the
behaviors of an Android application, we have to look
into the Android byte code which is executed when-
ever the application runs. However, this code is a kind
of binary code for Android programs. It is hard for
humans to read. Thus, we use a tool to decompile this
byte code into a human readable code, called smali
code. Thanks to the Apktool
4
, the Android package
is unpacked and the byte code is decompiled into the
smali code. The smali code represents the Android
program in a form of an object oriented program-
ming language (like Java language) where a program
is constructed from objects that contain data and func-
tions known as methods. When the Android applica-
tion runs, one of its objects is executed and in this
executed object there are calls to other objects.
An Android application is implemented mainly using
four main components: Activity, Service, Broadcast
Receiver and Content Provider. Each component sup-
ports different functions in the application. For in-
stance, the component Activity provides a user in-
terface for interactions between the user and the ap-
4
https://ibotpeaches.github.io/Apktool
plication. Based on the component Service, the de-
veloper can make background executions. The com-
ponent Broadcast Receiver is a means to make com-
munications between applications in the system. Via
the Content Provider objects, the application can ac-
cess/modify data on the system such as Contact list,
Calendar, etc. Each component follows its own work
flow. For example, in the component Activity, first
the method onCreate() is called, then the method
onStart(), etc. These components contain the entry
points to execute the application. Thus, they are po-
tentially exploited for malicious behaviors.
As an example, Figure 1 shows the implementa-
tion of an Android application based on the compo-
nent Activity. The application starts by executing the
object MainActivity which is an implementation of
the component Activity. This object starts by calling
the method onCreate() and then calling the method
onStart(). Particularly, in the method onStart(), there
is a call to the method Send() at line 13 which belongs
to another object (the SendMessage object).
Moreover, there are several calls to the methods which
are supported by the Android OS such as the method
getDeviceId() at line 5 in the object TelephonyMan-
ager, the method getDefault() at line 19 and the
method sendTextMessage() at line 25 in the object
SmsManager. These methods are functions which
are provided by the Android OS to access the sys-
tem services. Each Android OS version supports a
library which includes all functions to implement an
application, called Application Programming Inter-
faces (APIs). The Android developers use these APIs
to create the application based on the above compo-
nents. Generally, the system operations are made via
API calls. The malicious behaviors in an Android ap-
plication are used to be done by sequences of API
calls. According to this fact, we represent the behav-
iors of an Android application as an API call graph
which represents all sequences of API calls. In order
to construct the behaviors of an Android application,
we build a control flow graph which represents all op-
erations in the application. Then, we extract the API
call graph from the control flow graph. The API call
graph is seen as the representation of the behaviors of
an Android application. In the following subsections,
we introduce control flow graphs and API call graphs,
and explain how to compute them for Android appli-
cations.
3.2 Control Flow Graph
A control flow graph (CFG) is a directed graph G =
(N,I,E), where N is a finite set of nodes, I is a fi-
nite set of instructions in an Android application, and
Extracting Android Malicious Behaviors
717
E : N × I × N is a finite set of edges. Each node cor-
responds to a control point in the Android applica-
tion. Each edge specifies the connection of two con-
trol points and is associated with an instruction. An
edge (n
1
,i, n
2
) in E expresses that in the Android ap-
plication, the control point n
1
is followed by the con-
trol point n
2
and is associated with the instruction i.
We construct the CFG of an Android application
as follows:
1. Build the CFG for each method in the application.
2. If at a given control point n there exists a call to
another method A (n
callA
−−−→ n
0
∈ E) , we remove
this edges from E and we make a link from point
n where the call occurs to the entry point of the
called method A and a link from the exit point of
the called method A to the next point n
0
of this
call.
3. By taking into account the event handlers of an
Android application, we make the link between
the CFGs of the methods which handle the events
according to the work flow of each object. For in-
stance, to handle the initialization of a new activ-
ity object, there is a call to the method onCreate()
and then a call to the method onStart(). Thus, we
add a link between the exit points of the method
onCreate() to the entry points of the method on-
Start() in this object.
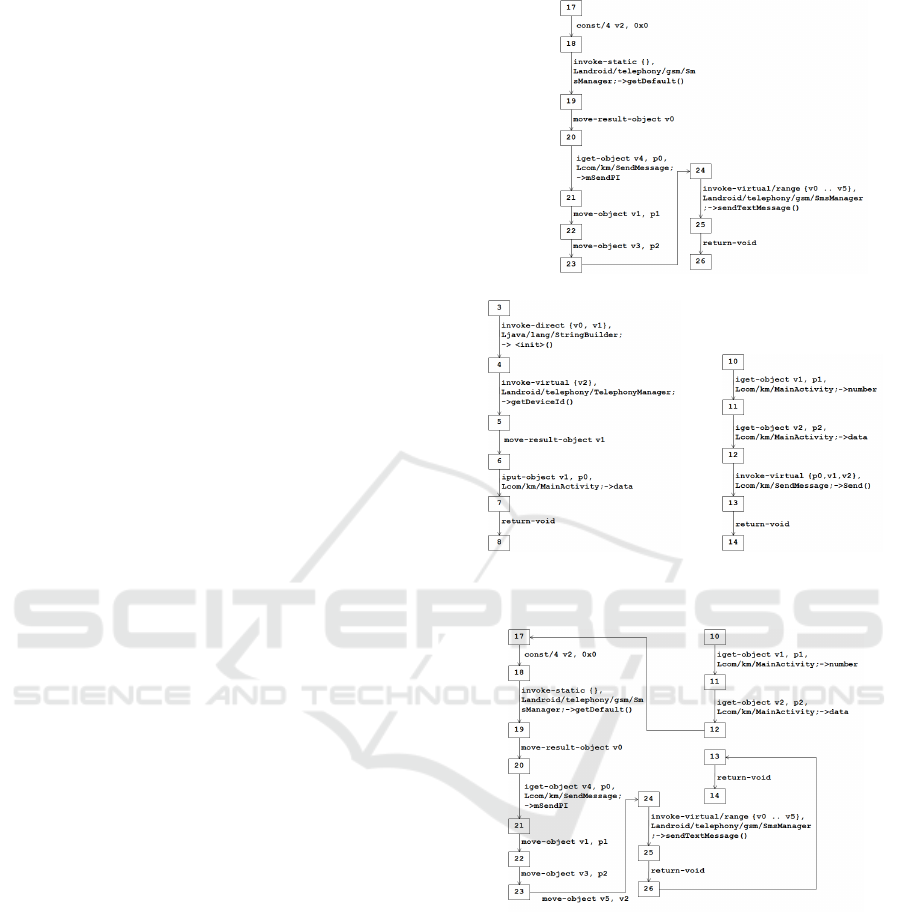
As an example, let us consider the smali code in
Figure 1. Firstly, we build the CFG for each method
as shown in Figure 3. Then, since there is a call to the
method Send() from the method onStart(), we make a
link from the point (12) where a call to the method
Send() will be made to the entry point (17) of the
method Send() and a link from the exit point (26) of
the method Send() to the next point (13) of this call.
This is shown in Figure 4.
Moreover, in this application there is an activity
object. This object is started by calling the method on-
Create() and then calling the method onStart(). Thus,
we make a link from the exit point (8) of the method
onCreate() to the entry point (10) of the method on-
Start(). The CFG of the application is shown in Figure
5.
3.3 API Call Graph
Let A be the set of all APIs in Android applica-
tions. An API call graph is a directed graph G
api
=
(V
api
,E
api
), where V
api
: N × A is a finite set of ver-
tices and E
api
: (N × A) × (N × A) is a finite set of
edges. A vertex (n, f ) means that at a control point
n, a call to the API function f is made. An edge
((n
1
, f
1
),(n
2
, f
2
)) in E means that the API function
(a) The CFG of method Send().
(b) The CFG of method onCreate(). (c) The CFG of method onStart().
Figure 3: The CFGs of the methods of the code in Figure 1.
Figure 4: The CFG of method onStart() linked to the CFG
of method Send().
f
2
called at the control point n
2
is executed after the
API function f
1
called at the control point n
1
. To com-
pute an API call graph from the CFG of an Android
application, we perform a kind of control point reach-
ability analysis on the CFG as described in (Dam and
Touili, 2016).
As an example, let us consider the construction
of the API call graph of the code in Figure 1. Since
the control flow graph is constructed in Figure 5, we
simplify this graph to get an API call graph where
each node is a pair of the control point and the API
which is called at this control point. Then, we make
ForSE 2017 - 1st International Workshop on FORmal methods for Security Engineering
718
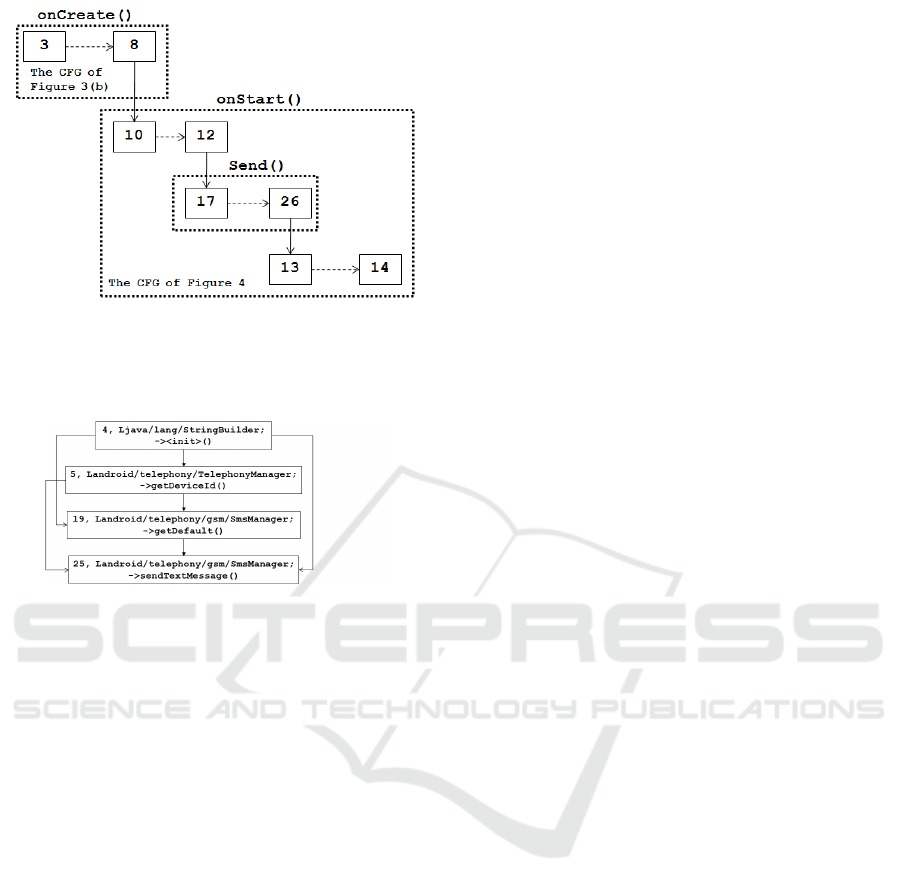
Figure 5: The CFG of the code in Figure 1.
the transitive closure for each node in this simplified
graph. The API call graph is shown in Figure 6.
Figure 6: The API call graph of the code in Figure 1.
4 MALICIOUS BEHAVIOR
SPECIFICATION
In this section we introduce malicious API graphs,
and we show how to apply these graphs to detect mal-
wares.
4.1 Malicious API Graphs
A malicious API graph is a directed graph G
M
=
(V
M
,E
M
,V
0
,V
F
), where V
M
⊆ A is a finite set of ver-
tices, E
M
: V
M
×V
M
is a finite set of edges, V
0
⊆ V
M
is
the set of initial nodes, i.e., the set of nodes v s.t. there
does not exist any edge coming to v, and V
F
⊆ V
M
is
the set of final nodes, i.e., the set of nodes v s.t. there
does not exist any edge exiting v. An edge ( f
1
, f
2
)
in E
M
means that the API function f
2
is executed af-
ter the API function f
1
. Let f
0
,. .., f
k
be API func-
tions. A malicious behavior f
0
·· · f
k
is represented in
the malicious API graph if f
0
∈ V
0
, f
k
∈ V
F
, and for
every i, 1 ≤ i ≤ k − 1, ( f
i
, f
i+1
) ∈ E
M
.
For instance, the malicious behavior of the An-
droid trojan sms spy is expressed by the ma-
licious API graph of Figure 2. In this graph,
the behavior starts at the initial node Lan-
droid/telephony/TelephonyManager; -¿ get-
DeviceId() and ends at the final node Lan-
droid/telephony/gsm/SmsManager; -¿ sendTextMes-
sage(). This graph represents the behavior of getting
and sending the Phone Id via a text message.
4.2 Malware Detection using Malicious
API Graphs
Given a program represented by its API call graph
G
api
= (V
api
,E
api
), and a set M of malicious be-
haviors (sequences of API functions) represented by
a malicious API graph G
M
= (V
M
,E
M
,V
0
,V
F
), we
check whether the program contains one of the mali-
cious behaviors in M , by performing a kind of prod-
uct as follows: G
P
= (V
P
,E
P
,V
P
0
,V
P
F
) such that V
P
0
=
{(m, f ) ∈ V
api
| f ∈ V
0
}, V
P
F
= {(m, f ) ∈ V
api
| f ∈
V
F
}, and E
P
= {
(m, f ),(m
0
, f
0
)
∈ E
api
| ( f , f
0
) ∈
E
M
}. Then, the program contains a malicious behav-
ior in M iff G
P
contains paths that led from an initial
node in V
P
0
to a final node in V
P
F
.
5 MALICIOUS BEHAVIORS
EXTRACTION
The problem is to compute the malicious API graph
from a set of malicious and benign API call graphs.
Following the work in (Dam and Touili, 2016), we
compute the subgraphs which are relevant to the ma-
licious graphs but not relevant to the benign ones. A
relevant subgraph contains nodes and edges that are
meaningful to the malicious API call graphs. Apply-
ing the techniques of the information retrieval com-
munity, we associate to each node/edge of the API
call graphs a weight to measure its relevance with
respect to the malicious graphs and wrt. the benign
ones. Using these weights, we construct the malicious
API graphs. In this section, we recall the approach
of (Dam and Touili, 2016) and show how to apply
the TFIDF scheme that was widely applied for docu-
ments by the IR community for our malicious graph
extraction problem.
5.1 Term Weighting Scheme
Relevance in a Graph. In what follows, we call
nodes and edges terms. The relevance of a term is
measured by a TFIDF weight. This scheme ensures
that if a term has a higher weight, then it is more rel-
evant in the graph. The TFIDF weighting scheme is
a well-known technique of the IR community that is
applied in many applications in web searching, text
Extracting Android Malicious Behaviors
719

searching, image searching, etc. It was mainly ap-
plied for documents. Following (Dam and Touili,
2016), we show here how to apply it for graphs. The
weight in the TFIDF scheme is measured from the oc-
currences of terms in a graph and their appearances in
other graphs. If a term occurs frequently in a graph
and appears rarely in other graphs, it is one of the rel-
evant terms in this graph. For a given term, its rel-
evance to an API call graphs in the collection G is
measured by the TFIDF weight as follows.
w(i, j) = F(tf(i, j)) × idf(i) (1)
where w(i, j) is the weight of a term i in graph j. The
idf factor ensures a higher weight for terms which ap-
pear in a few graphs of the collection. It varies in-
versely with the number of graphs df(i) that contain
a term i in a collection of N graphs. A typical factor
may be computed as log(
N
df(i)
). tf(i, j) is the number
of occurrences of term i in graph j, called term fre-
quency.
Moreover, a term in a large-size graph may have a
high term frequency. If in a collection the difference
between the sizes of graphs is high, the term frequen-
cies are taken over by the large-size graphs. Thus, one
needs to take into account the size of the graphs while
computing the term frequency. This is implemented
using the function F that involves a size normaliza-
tion component (Robertson et al., 1995; Singhal et al.,
1996). In our experiment, we apply several functions
of term frequency. They are defined as follows:
• F
1
(tf(i, j)) = tf(i, j) leads to the raw factor.
• F
2
(tf(i, j)) =
(k
1
+1)×tf(i, j)
tf(i, j)+k
1
(
S( j)
AVG(G)
×b+1−b)
implements
the size normalized BM25 factor (Robertson and
Zaragoza, 2009; Robertson et al., 1995).
• The size normalized logarithmic factor can be
implemented by the following function (Singhal
et al., 1999; Singhal and Kaszkiel, 2001):
F
3
(tf(i, j)) =
(
1+ln(1+ln(tf(i, j))
S( j)
AVG(G)
×b+1−b
if tf(i, j) > 0
0 if tf(i, j) = 0
• The size normalized sigmoid factor (Yao et al.,
2006) can be implemented by function F
4
defined
as follows:
(
k
1
+1
k
1
(
S( j)
AVG(G)
×b+1−b)+e
−tf(i, j)
if tf(i, j) > 0
0 if tf(i, j) = 0
Where
S( j)
AVG(G)
× b + (1 − b), 0 ≤ b ≤ 1 is a size nor-
malization component (Singhal et al., 1996) where
S( j) is the size of graph j and AVG(G) is the aver-
age size of graphs in the collection G. In the above
formulas, by setting b to 1, graph size normalization
is fully performed, while setting b to 0 turns off the
size normalization effect.
In the TFIDF weighting scheme, these functions are
applied and have shown good performances. How-
ever, there is no theoretical evidences to prove which
function is better than the others. Thus, we take into
account all these functions in our experiments to de-
termine which one is the best function for our prob-
lem.
Relevance in a Set. Given a set G of API call graphs
and a term i, the relevance of term i in G is measured
by its relevance in each graph in this set: it is com-
puted as the sum of the term weights of i in each graph
of G:
W (i,G) =
1
K
|G|
∑
j=1
w(i, j) (2)
where K = max
i, j
w(i, j) is a normalizing coefficient.
It is used to normalize the term weight values in the
different graphs to make them comparable in the sum-
mation. w(i, j) is a TFIDF term weight of term i in
graph j ( j ∈ G). w(i, j) is computed using one of the
functions F as described above. W (i,G) is the weight
of term i in the set G. A term with a higher weight is
more relevant to graphs in set G.
Malicious Relevance. In our context, given G
M
and G
B
that are the sets of malicious graphs and be-
nign graphs respectively, we want to compute a term
weight that is high if the term is relevant for set G
M
but not for set G
B
. If a term i is relevant in both sets,
then it is not meaningful, as it does not correspond to
a malicious behavior. Thus, given a term i we need to
compute a new weight of term i to measure its rele-
vance in set G
M
with respect to set G
B
. This is com-
puted by two intuitive equations.
The first equation is the Rocchio equation which
intuitively measures the weight of a term by the dis-
tance between its weights in the sets G
M
and G
B
(Christopher D. Manning, 2009). A higher distance
of a term means that it is more relevant for G
M
than
for G
B
. Given a term i, the relevance of term i in the
set G
M
against the other set G
B
is given by:
W (i,G
M
,G
B
) = β ×
W (i,G
M
)
|G
M
|
− γ ×
W (i,G
B
)
|G
B
|
(3)
where |G
M
| and |G
B
| are the sizes of the sets G
M
and
G
B
, β and γ are parameters to control the effect of the
two sets G
M
and G
B
.
The second equation is the Ratio equation which
computes the relevance of a term i as follows:
W (i,G
M
,G
B
) =
W (i,G
M
)
|G
M
|
×
λ + |G
B
|
λ +W (i,G
B
)
(4)
ForSE 2017 - 1st International Workshop on FORmal methods for Security Engineering
720
Intuitively, this is a kind of quotient between the
weight of i in G
M
and its weight in G
B
. Thus, the
weight of term i is high if it has a high weight in G
M
and a low weight in G
B
.
As the two equations above (Rocchio and Ratio)
are natural and intuitive, a higher weight indicates a
higher relevance of a term i in G
M
. We have no the-
oretical evidence that shows the advantage of taking
one equation over the other. Thus, in our experiments,
we make a comparison of the performances of these
two equations in order to decide which one is the best
for our application. In our experiments, the values of
β,γ and λ are set to 0.15, 0.75 and 0.5, respectively.
(These are the typical values used in the IR commu-
nity.)
5.2 Computing Malicious API Graphs
A malicious API graph is a combination of terms
which have a high malicious relevance. Since terms
of a graph are either nodes or edges, we can compute
the malicious API graphs by several possible strate-
gies. These strategies depend on a parameter n which
is chosen by the user. n corresponds to the number of
nodes (resp. edges) that are taken into account in the
computation. In what follows, by “weight of a term i”,
we refer to W (i,G
M
,G
B
). Let {(m
1
, f
1
),. .. ,(m
n
, f
n
)}
be the set of nodes that have the n highest weights.
Let A
M
= { f
1
,. .. , f
n
} ⊆ A be the corresponding API
functions. Let {e
1
,. .. ,e
n
} be the set of edges that
have the n highest weights. Intuitively, this means that
the API functions in A
M
and the edges in {e
1
,. .. ,e
n
}
are the most relevant ones. Then, the malicious API
graphs are computed using the following strategies:
Strategy 1. We take nodes which correspond the
API functions in A
M
and then add edges with the
highest weight to connect these nodes. No other node
is added.
Strategy 2. We start from nodes which corre-
spond to the API functions A
M
. For every node, we
consider all its outgoing edges, and we add the edge
with the highest weight, even if it involves a node that
is not in A
M
.
Strategy 3. We construct the graph from the edges
with the highest weights {e
1
,. .. ,e
n
}.
6 EXPERIMENTS
We evaluate the performance of our approach on a
data set of 459 benign applications, which are col-
lected from the website apkpure.com and 3100 ma-
licious applications which are gotten from Drebin
dataset (Arp et al., 2014). We divide this data set
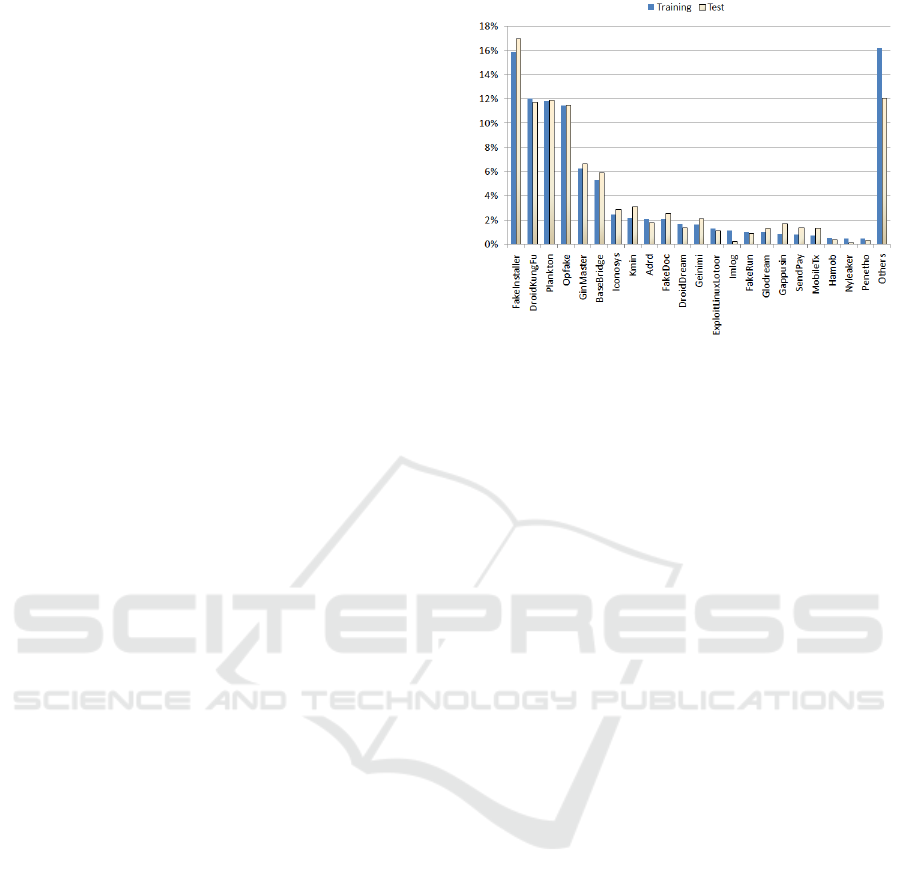
Figure 7: Proportions of malicious application categories in
training and test sets.
into two sets for training and testing. The training
set consists of 1900 malicious applications and 359
benign applications. The test set consists of 1200 ma-
licious applications and 100 benign applications. Fig-
ure 7 shows the proportions of each malware category
in the training set and in the test set. There are two
phases in this evaluation as follows.
- Training Phase. In this phase, we extract the ma-
licious API graphs from the data in the training
set as follows. Firstly, we take each input ap-
plication as an APK file. Then, this APK file is
unpacked and decompiled by Apktool. After get-
ting its smali code from Apktool, we construct the
CFG and the API call graph of this application.
Once we build the API call graph for each appli-
cation, we compute the malicious API graphs by
the strategies described in Section 5.2.
- Testing Phase. In this phase, we apply the mali-
cious API graphs to classify the applications in the
test set. We take each input application as an APK
file. Then, we unpack and decompile this APK
file to get its smali code by using Apktool. After
that, we construct its API call graph. As we de-
scribed in Section 4.2, this application is marked
as malicious if there is a feasible common path
between its API call graph and the malicious API
graphs. Otherwise, it is marked as benign.
We evaluate the performance of the functions
F
1
,F
2
,F
3
and F
4
(detailed in Section 5.1) with the
Rocchio and Ratio equations (equations 3 and 4). For
each combination, we construct the malicious API
graph from the training set. Then, these specifica-
tions are evaluated on the test set. The performance
is measured by the following quantities. Recall (De-
tection rate) is the True Positives over the number
of malicious API call graphs. Precision is the True
Extracting Android Malicious Behaviors
721
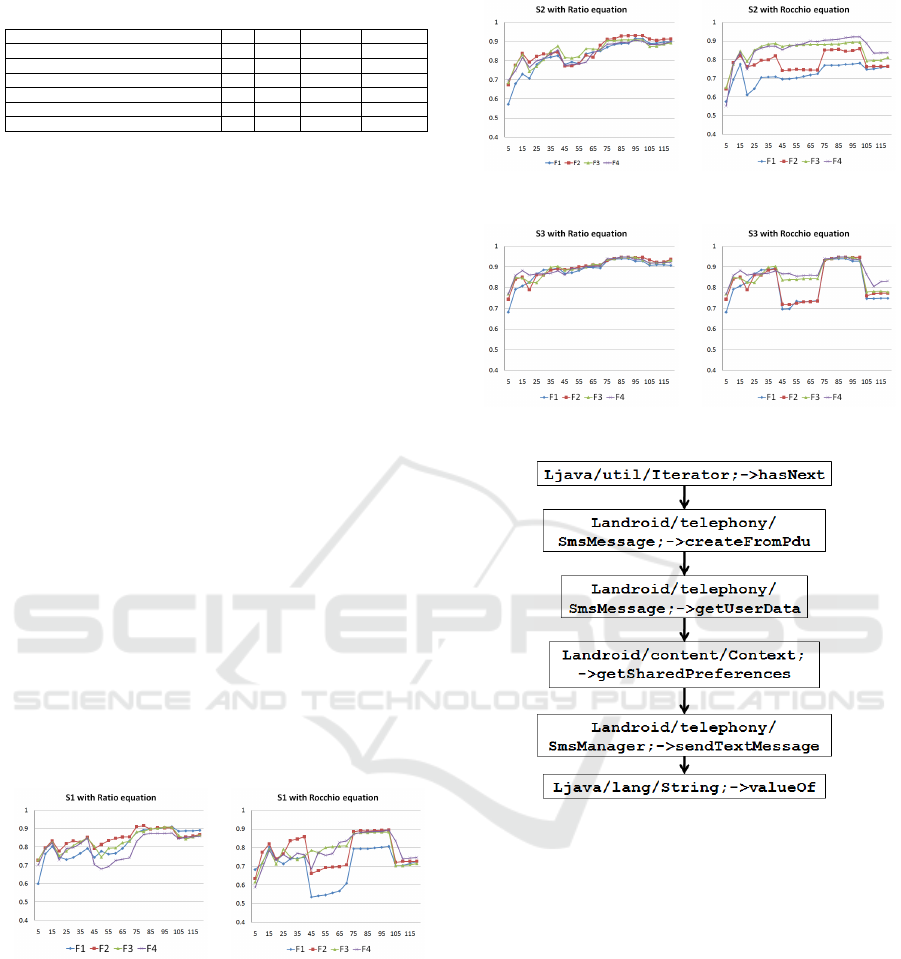
Table 1: The best performance of each strategy.
Strategy n Recall Precision F-measure
S1 by F4 with Rocchio equation 100 82.8% 97.3% 89.5%
S1 by F2 with Ratio equation 80 85.4% 98.7% 91.6%
S2 by formula F4 with Rocchio equation 100 87.6% 97.5% 92.3%
S2 by formula F2 with Ratio equation 100 88% 98.8% 93.1%
S3 by formula F3 with Rocchio equation 85 92% 98% 94.9%
S3 by formula F3 with Ratio equation 85 92% 98% 94.9%
Positives over the sum of True Positives and False
Positives. F-Measure is a harmonic mean of pre-
cision and recall that is computed as F-Measure =
2×Precision×Recall/(Precision+Recall). These are
standard evaluation measures in the IR community.
The technique computes more relevant items than ir-
relevant if the precision rate is high. We can deduce
that most of the relevant items were computed if the
recall rate is high. As for the F-measure, it is 1 if all
retrieved items are relevant and all relevant items have
been retrieved.
The figures below show the F-measure obtained
from the combinations of different formulas and
strategies. In these experiments, we vary n from 5 to
120. According to the results, the ratio equation gives
the best performance with formulas F2 and F3 while
the Rocchio equation gives the best performance with
formula F4. Moreover, the F-measure is more stable
(no jumps) with the ratio equation than with the Roc-
chio equation. Table 1 shows the best obtained re-
sults for each combination. We obtain the best perfor-
mance from the strategy S3 by F3 with both weighting
equations. The detection rate reaches 92% with 98%
of precision at n = 85. Therefore, we use this configu-
ration (S3 by F3 with the ratio equation) for malicious
graphs extraction because the ratio equation is more
stable.
Figure 8: F-measures of strategy S1 on the test set.
Morever, our tool was able to automatically ex-
tract several graphs that represent real malicious be-
haviors. For example, it was able to extract the graph
of Figure 11 below.
This behavior consists of repeatedly sending the user
information by text messages. First, the method cre-
ateFromPdu() is called to create a new text message.
Then, the method getUserData() is called to get the in-
formation of the user. Additionally, more information
is gotten from calling getSharedPreferences(). The
message is sent by calling sendTextMessage(). This
Figure 9: F-measures of strategy S2 on the test set.
Figure 10: F-measures of strategy S3 on the test set.
Figure 11: Repeatedly sending text messages.
process is repeated by an iterator object.
7 CONCLUSION
In this paper, we consider the problem of automat-
ically extracting Android malicious behaviors. To
solve this problem, we consider a set of benign and
malicious Android applications. We model these ap-
plications using API call graphs, and we extract from
these graphs the relevant subgraphs that form the
malicious specifications by using and adapting well
known techniques in the Information Retrieval com-
munity. Using the graphs generated by our tech-
niques, we obtained interesting results: 92% of de-
tection rates with 98% of precision. As far as we
know, this is the first time that information retrieval
ForSE 2017 - 1st International Workshop on FORmal methods for Security Engineering
722

techniques are applied for the automatic extraction of
Android malicious behaviors.
REFERENCES
Aafer, Y., Du, W., and Yin, H. (2013). Droidapiminer:
Mining api-level features for robust malware detec-
tion in android. In International Conference on Se-
curity and Privacy in Communication Systems, pages
86–103. Springer.
Arp, D., Spreitzenbarth, M., Hubner, M., Gascon, H., and
Rieck, K. (2014). Drebin: Effective and explain-
able detection of android malware in your pocket. In
NDSS.
Aung, Z. and Zaw, W. (2013). Permission-based android
malware detection. International Journal of Scientific
and Technology Research, 2(3):228–234.
Burguera, I., Zurutuza, U., and Nadjm-Tehrani, S. (2011).
Crowdroid: behavior-based malware detection system
for android. In Proceedings of the 1st ACM workshop
on Security and privacy in smartphones and mobile
devices, pages 15–26. ACM.
Canfora, G., Medvet, E., Mercaldo, F., and Visaggio, C. A.
(2015). Detecting android malware using sequences
of system calls. In Proceedings of the 3rd Interna-
tional Workshop on Software Development Lifecycle
for Mobile, pages 13–20. ACM.
Cheng, J. Y.-C., Tsai, T.-S., and Yang, C.-S. (2013). An
information retrieval approach for malware classifica-
tion based on windows api calls. In 2013 International
Conference on Machine Learning and Cybernetics.
Christopher D. Manning, Prabhakar Raghavan, H. S.
(2009). An introduction to information retrieval.
Cambridge University Press.
Dam, K.-H.-T. and Touili, T. (2016). Automatic extraction
of malicious behaviors. In 11th International Con-
ference on Malicious and Unwanted Software 2016
(MALCON 2016), Fajardo, Puerto Rico.
Dimja
ˇ
sevic, M., Atzeni, S., Ugrina, I., and Rakamaric, Z.
(2015). Android malware detection based on system
calls. University of Utah, Tech. Rep.
Jang, J.-w., Kang, H., Woo, J., Mohaisen, A., and Kim,
H. K. (2016). Andro-dumpsys: anti-malware sys-
tem based on the similarity of malware creator and
malware centric information. computers & security,
58:125–138.
Malik, S. and Khatter, K. (2016). System call analysis of
android malware families. Indian Journal of Science
and Technology, 9(21).
Masud, M. M., Khan, L., and Thuraisingham, B. (2008). A
scalable multi-level feature extraction technique to de-
tect malicious executables. Information Systems Fron-
tiers.
Robertson, S. and Zaragoza, H. (2009). The probabilistic
relevance framework: BM25 and beyond. Now Pub-
lishers Inc.
Robertson, S. E., Walker, S., Jones, S., Hancock-Beaulieu,
M. M., Gatford, M., et al. (1995). Okapi at trec-3.
NIST SPECIAL PUBLICATION SP.
Santos, I., Ugarte-Pedrero, X., Brezo, F., Bringas, P. G., and
G
´
omez-Hidalgo, J. M. (2013). Noa: An information
retrieval based malware detection system. Computing
and Informatics.
Sharma, A. and Dash, S. K. (2014). Mining api calls and
permissions for android malware detection. In Inter-
national Conference on Cryptology and Network Se-
curity, pages 191–205. Springer.
Singhal, A., Buckley, C., and Mitra, M. (1996). Pivoted
document length normalization. In Proceedings of the
19th annual international ACM SIGIR conference on
Research and development in information retrieval.
Singhal, A., Choi, J., Hindle, D., Lewis, D. D., and Pereira,
F. (1999). At&t at trec-7. NIST SPECIAL PUBLICA-
TION SP.
Singhal, A. and Kaszkiel, M. (2001). A case study in web
search using trec algorithms. In Proceedings of the
10th international conference on World Wide Web.
Song, F. and Touili, T. (2014). Model-checking for an-
droid malware detection. In Asian Symposium on Pro-
gramming Languages and Systems, pages 216–235.
Springer.
Talha, K. A., Alper, D. I., and Aydin, C. (2015). {APK}
auditor: Permission-based android malware detection
system. Digital Investigation, 13:1 – 14.
Tchakount
´
e, F. (2014). Permission-based malware detec-
tion mechanisms on android: Analysis and perspec-
tives. JOURNAL OF COMPUTER SCIENCE, 1(2).
Yao, J., Wang, J., Li, Z., Li, M., and Ma, W.-Y. (2006).
Ranking web news via homepage visual layout and
cross-site voting. In European Conference on Infor-
mation Retrieval.
Zhang, Y., Yang, M., Xu, B., Yang, Z., Gu, G., Ning, P.,
Wang, X. S., and Zang, B. (2013). Vetting undesirable
behaviors in android apps with permission use analy-
sis. In Proceedings of the 2013 ACM SIGSAC Confer-
ence on Computer & Communications Security,
CCS ’13, pages 611–622, New York, NY, USA. ACM.
Extracting Android Malicious Behaviors
723
