Initial Results of a Method for the Generation of Triangle Meshes
Representing Bone Fragments using a Spatial Decomposition
F´elix Paulano-Godino and Juan J. Jim´enez-Delgado
Department of Computer Science, University of Ja´en, Campus Las Lagunillas s/n, Ja´en, Spain
Keywords:
Bone Fragments, 3D Reconstruction, Spatial Decomposition, Triangle Mesh.
Abstract:
The generation of a virtual representation of the bones and fragments is an artificial step required in order
to obtain helpful models to work with in a simulation. Nowadays, the Marching Cubes algorithm is a de
facto standard for the generation of geometric models from medical images. However, bone fragments models
generated by Marching Cubes are huge and contain many unconnected geometric elements inside the bone
due to the trabecular tissue. The development of new methods to generate geometrically simple 3D models
from CT image stacks that preserve the original information extracted from them would be of great interest.
In order to achieve that, a preliminary study for the development of a new method to generate triangle meshes
from segmented medical images is presented. The method does not modify the points extracted from CT
images, and avoid generating triangles inside the bone. The aim of this initial study is to analyse if a spatial
decomposition may help in the process of generating a triangle mesh by using a divide-and-conquer approach.
The method is under development and therefore this paper only presents some initial results and exposes the
detected issues to be improved.
1 INTRODUCTION AND
BACKGROUND
Computer-assisted fracture reduction procedures usu-
ally require the generation of 3D models represent-
ing bone fragments. Although the generated models
could be point clouds or volumes, most of the times
these models are meshes, since computer-assisted
techniques require geometric algorithms (Jim´enez
et al., 2016). In particular, interactive environments
usually require triangle meshes in order to apply col-
lision detection strategies. Computed Tomography
(CT) is the most appropriate and accessible data ac-
quisition techniquefor distinguishing bone from other
tissues and thus, for generating 3D bone fragment
models (Egol et al., 2010). This type of image stores
at each pixel the radio-density obtained during the CT
scan as intensity values in the image. The morphol-
ogy of bone fragments makes the generation of trian-
gle meshes difficult, since the shape of the segmented
regions is very irregular because trabecular tissue ap-
pears in the outer part of the bone fragment due to
the fracture. These features influence the choice of a
method for generating meshes.
Nowadays, the Marching Cubes (MC) algorithm
(Lorensen and Cline, 1987) is a de facto standard for
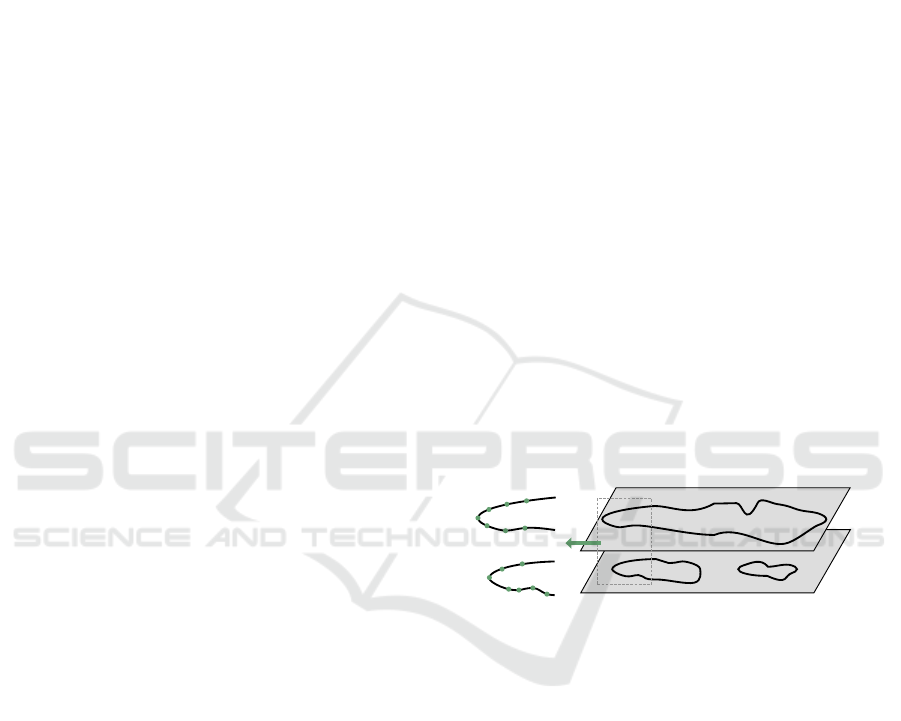
slice i
slice i+1
Figure 1: Simplified representation of the case in which
contours from two consecutive slices do not have a one-to-
one correspondence. Left, zoomed area showing the diffi-
culty of deciding which points should be sewed together in
3D.
generating triangle meshes representing bone frag-
ments to be used in computer-assisted procedures
(Jim´enez et al., 2016). The MC algorithm has been
utilized to generate meshes that represent acetabu-
lar fractures (Fornaro et al., 2008)(Fornaro et al.,
2010a), fractured pelvic bones (Fornaro et al., 2010b)
(Lee et al., 2012) and proximal humerus fractures
(F¨urnstahl et al., 2012). This algorithm has also been
used to generate fragment models to represent highly
fragmented bone fractures (Willis et al., 2007) and
to provide models for a virtual orthopaedic surgery
simulator (Tsai et al., 2001). The size of the models
generated by these methods depends on the resolution
of the medical images and the complexity of the seg-
mented bone structures; hence models generated by
MC are usually huge and contain unconnected geom-
298
Paulano-Godino F. and JimÃl’nez-Delgado J.
Initial Results of a Method for the Generation of Triangle Meshes Representing Bone Fragments using a Spatial Decomposition.
DOI: 10.5220/0006266302980305
In Proceedings of the 12th International Joint Conference on Computer Vision, Imaging and Computer Graphics Theory and Applications (VISIGRAPP 2017), pages 298-305
ISBN: 978-989-758-224-0
Copyright
c
2017 by SCITEPRESS – Science and Technology Publications, Lda. All rights reserved
etry inside the bone due to the morphology of trabec-
ular tissue (Paulano et al., 2015). Therefore, gener-
ated meshes commonly need to be post-processed to
improve their features. An alternative approach con-
sists of generating a 3D model by triangulating ex-
ternal contours of the bone fragments extracted from
medical images. However, this approach involves the
resolution of some complex problems, such us decid-
ing which points should be sewn together in 3D, or
managing sewing when the contours are subdivided
in consecutive slices (Figure 1). The use of spatial de-
compositions (Samet, 2010) allows dividing the point
cloud into small sets of points, reducingthe mesh gen-
eration problem to smaller sub-problems.
In this paper, an initial study for the development
of an alternative method to generate triangle meshes
from medical images using a spatial decomposition
is presented. In this study, we decided to use a spa-
tial decomposition named tetra-tree (Jim´enez et al.,
2006), since conducted studies demonstrated that it
presents several advantages for interactive environ-
ments with regards to other data structures based on
rectangular cells such as the octree (Chen and Huang,
1988). Mainly, the tetra-tree makes the selection of
related triangles easier, being able to select inacces-
sible parts without the use of complementary algo-
rithms (Jim´enez et al., 2011). Section 2 describes the
main stages of the proposed method. Then Section
3 discusses the main advantages of using a tetra-tree
to generate triangle meshes and analyses the issues to
improve in the proposed method.
2 PROPOSED METHOD
2.1 Overview
The first stage of the proposed mesh generation
method consists of extracting contour points from
medical images. Then, a spatial decomposition
named tetra-tree (Jim´enez et al., 2006) recursively di-
vides the space into tetrahedra with a shared origin
named tetra-cones, so that these tetra-cones cover the
whole space without overlapping. As the tetra-tree
is built, the contour points are classified in the tetra-
cones. After that, triangle patches are generated using
the points classified in each tetra-cone. Finally, tri-
angle patches are hierarchically sewn in order to ob-
tain the reconstructed model. Figure 2 summarizes
the stages of the proposed method.
With the aim of easing the understanding of the
proposed algorithms, a simple model representing a
patella (Figure 3) will be used to exemplify the pro-
cess in the following subsections.
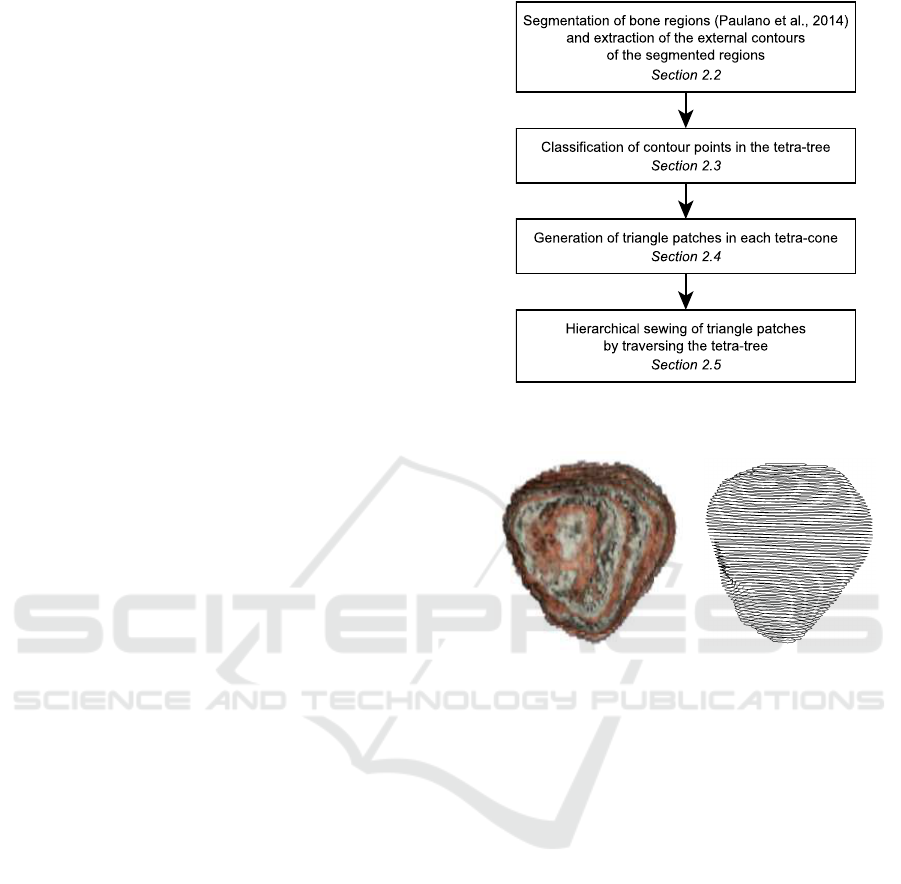
Figure 2: Overview of the proposed mesh generation
method.
Figure 3: Left, volume visualization of a patella segmented
from CT images. Right, external contours extracted from
the segmentation results.
2.2 Segmentation and Extraction of
External Contours
The input of our mesh generation method is a point
cloud representing the outer part of bone fragments.
These point clouds must be extracted from the infor-
mation available in medical images.
In a first step, all the bone fragments are seg-
mented from CT scans. For that purpose, the segmen-
tation algorithm described in (Paulano et al., 2014)
is used. The algorithm generates a region for each
bone fragment in each slice (Figure 3, left). Unlike
other approaches, this algorithm is able to separate
wrongly joined bone fragments during the segmenta-
tion process. Then the external contour of each seg-
mented region is extracted. With that aim, an ap-
proach similar to the proposed in (Pulido et al., 2014)
is applied. First, the Marching Squares algorithm is
utilized in order to generate contours from the seg-
mented regions (Ho et al., 2005). This algorithm can
be considered as a 2D adaptation of MC. The algo-
Initial Results of a Method for the Generation of Triangle Meshes Representing Bone Fragments using a Spatial Decomposition
299
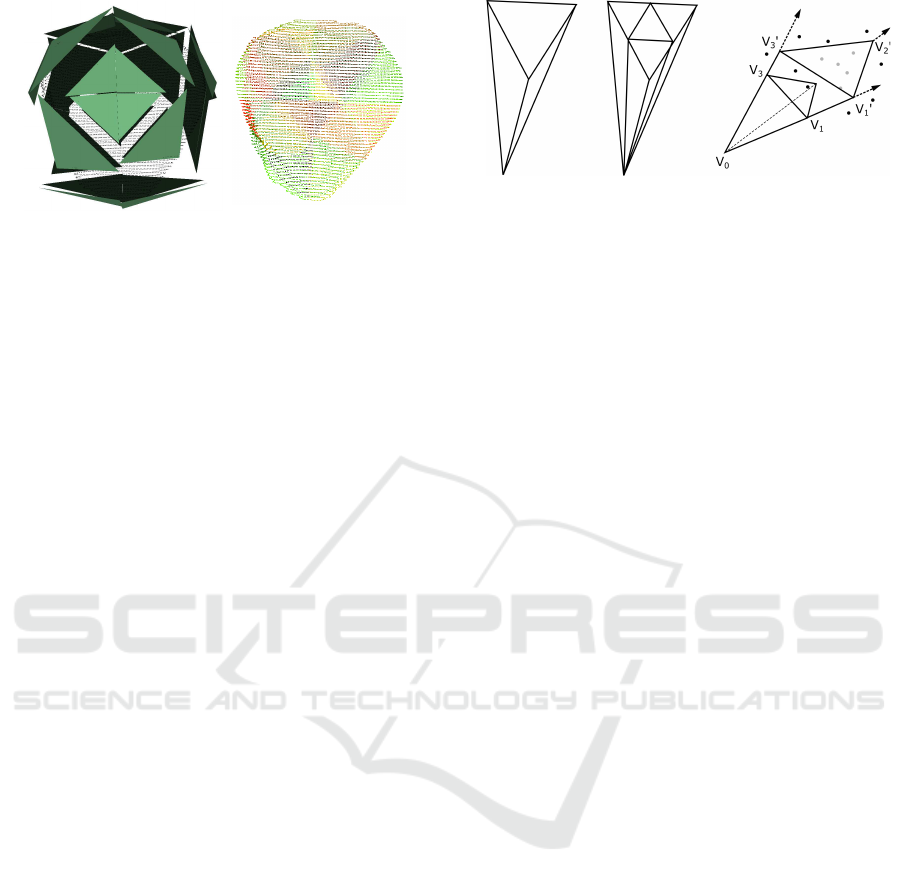
Figure 4: Left, a tetra-tree associated to the contour points.
Right, points belonging to each tetra-cone are shown in a
different colour.
rithm does not ensure that the generated contours are
closed, but this is not relevant in this case since the
final goal is to generate point clouds. Due to the noise
present in the regions because of trabecular tissue, in-
ner contours may be obtained. These inner contours
are removed using the point-in-polygon algorithm by
Feito and Torres (Feito and Torres, 1997); hence only
the outer contour of each fragment is extracted in each
slice. After removing internal contours, the vertices
of each external contour are grouped in order to form
the point cloud used as input by the mesh generation
algorithm (Figure 3, right).
2.3 Classification in the Spatial
Decomposition
A tetra-tree (Jim´enez et al., 2006) is a spatial decom-
position technique that recursively divides the space
into tetra-cones with a common origin, so that these
tetra-cones cover the entire space without overlapping
among them (Figure 5, left). As the tetra-tree is built,
the points are classified in the generated tetra-cones
(Figure 4, right). Then the tetra-tree is adapted in or-
der to fit the classified geometric elements. For that
purpose, the enveloping tetrahedron associated with
each tetra-cone is calculated. The enveloping tetrahe-
dron of a given tetra-cone is the smallest tetrahedron
that shares the origin and the lateral faces with that
tetra-cone, and contains all the points that are classi-
fied into it (see Figure 5, right). Since a tetra-cone
is defined by three planes that intersect in a point,
the top cover of each tetrahedron is a triangle. This
top cover is perpendicular to the segment that goes
from the centroid of the model to its incircle. The dis-
tance from the centroid of the model to the top cover
is established by the point classified in the tetra-cone
which is furthest to the centroid. Figure 4 (left) shows
an adapted tetra-tree associated with the point cloud
representing the patella.
Figure 5: Left, a representation of the subdivision of a tetra-
cone. Right, a schema that represents the bounding tetra-
hedra associated with a tetra-cone (Jim´enez and Segura,
2008).
2.4 Generation of Patches
The classification of all the contour points in the tetra-
tree enables the execution of a divide-and-conquerap-
proach, so that the points classified in each tetra-cone
are triangulated in order to generate patches. Nev-
ertheless, not all the points classified in a tetra-cone
must be triangulated together. In order to avoid gen-
erating incorrect triangles, the points are clustered be-
fore being triangulated. A Euclidean cluster extrac-
tion algorithm has been used to group the points that
must be triangulated together. With this algorithm,
the points are grouped whenever they can be con-
nected by points closer than a pre-defined threshold.
In the case of the patella that we use as example, only
one cluster is generated for each tetra-cone.
Once the clusters have been generated, the points
belonging to each cluster are used to generate patches.
The proposed method triangulates points belonging
to consecutive contours. In order to perform the tri-
angulation, the connectivity information of the con-
tours is used. First, the contour points are sorted and
grouped by slices. Then the contours of each slice are
divided into connected polylines. After that, the poly-
lines belonging to consecutive slices are triangulated.
Depending on the number of polylines in which each
contour has been divided, three different triangula-
tion cases are considered: one-to-one, one-to-two and
two-to-two. Any other case is discarded and thus not
triangulated during this stage of the algorithm. De-
pending on each case, a different triangulation algo-
rithm is applied.
2.4.1 One-to-One Triangulation
The easiest case occurs when both contours are com-
posed by only one polyline. In this case new trian-
gles are generated, minimizing the number of trian-
gles with large sides and small angles. Given the first
two points of each polyline A
0
, A
1
, B
0
, B
1
, the algo-
rithm first computes the distance from A
0
to B
1
and
the distance from B
0
to A
1
. The smaller of these two
GRAPP 2017 - International Conference on Computer Graphics Theory and Applications
300
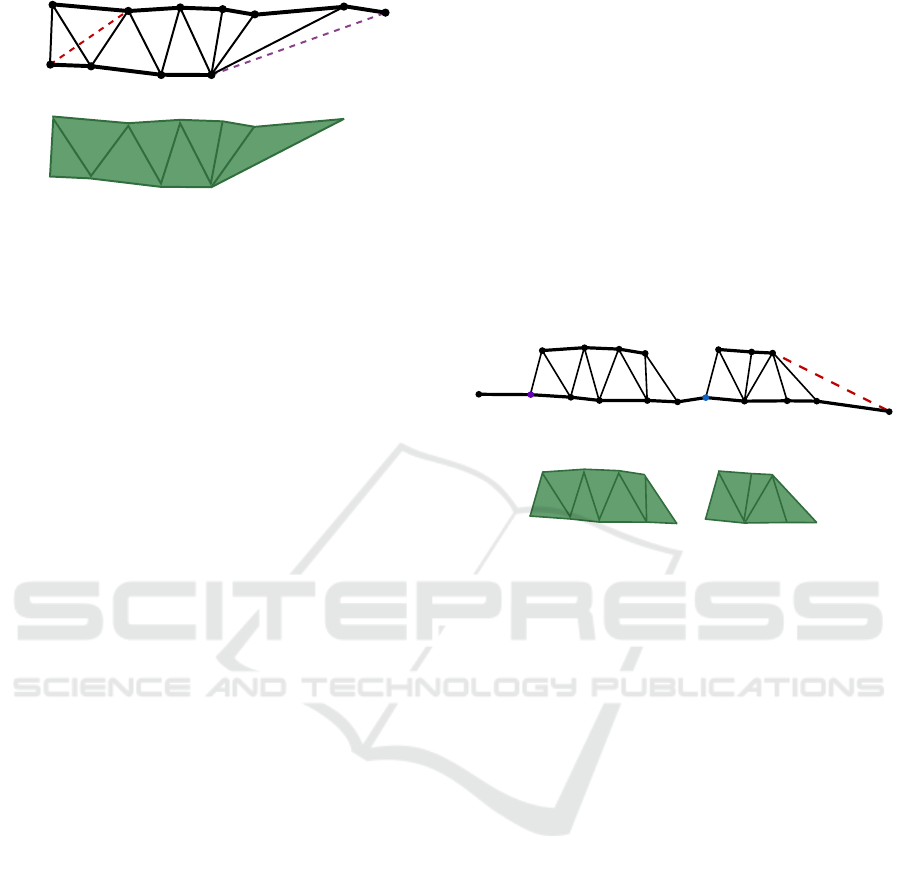
A
0
A
1
A
n-1
B
m
B
1
B
0
A
n
Figure 6: Top, example of a one-to-one triangulation of
polylines using the proposed algorithm. Bottom, obtained
triangles.
distances defines the segment which is used to gen-
erate the triangle. In Figure 6, the red coloured trian-
gle A
0
B
0
A
1
is discarded since the distance between B
0
and A
1
is bigger than the distance from A
0
to B
1
. This
step is repeated until all the points belonging to one of
the polylines have been triangulated. Finally, the last
point of the already sewn polyline is used to gener-
ate triangles with the remaining points of the opposite
polyline. Considering that all the points of B have
been triangulated and A
j
is the next point in A to be
triangulated, the algorithm tries to generate new tri-
angles until the distance from A
j
to B
m
is greater than
twice the average distance between A and B. This
constraint provides a better triangle distribution and
avoids degenerated triangles. In Figure 6, the purple
coloured triangle A
n−1
B
m
A
n
is discarded because the
distance from B
m
to A
n
is bigger than twice the aver-
age distance between A and B.
2.4.2 One-to-Two Triangulation
If one of the contours is composed by two sub-
polylines - A and B -, these must be sorted before
being sewn. Then the sub-polylines are sequentially
sewn to the polyline C of the opposite contour. Since
the two sub-polylines are sewn using the same pro-
cess, the algorithm to sew a single sub-polyline A to
a polyline C is explained for simplicity. Firstly, the
polyline point C
i
closest to the first point of A is cal-
culated. In Figure 7, the closest point to A
0
is coloured
in purple. After that, the one-to-one algorithm is ap-
plied but starting from the closest point previously
calculated. Using that algorithm, new triangles are
generated until all the points of A have been triangu-
lated. Then the last point of A is used to generate
new triangles. The main difficulty consists of decid-
ing when to stop sewing a sub-polyline and to start
the next one. Being C
j
the next point of the polyline
to be triangulated, the algorithm stops sewing the sub-
polyline A when the distance from the last point of A
to C
j
is greater than twice the average distance be-
tween A and C and it is also bigger than the distance
from the first point of B to C
j
. As in the one-to-one
case, these constraints provide a better triangle distri-
bution and avoid degenerate triangles. Once the first
sub-polyline A has been sewn, the same procedure is
repeated for the second sub-polyline B. In Figure 7,
the closest point to B
0
is coloured in blue. Being C
k
the next point of C to be triangulated, in this case
new triangles are generated until the distance from
the last point of B to C
k
is larger than twice the av-
erage distance between B and C or all the points have
been triangulated. In Figure 7, the red coloured trian-
gle C
l−1
B
m
C
l
is discarded because the distance from
B
m
to C
l
is bigger than twice the average distance be-
tween B and C.
A
0
A
1
Closest
point to A
0
B
m
B
1
B
0
A
n
C
0
C
l
Closest
point to B
0
Figure 7: Top, example of a one-to-two triangulation of
polylines using the proposed algorithm. Bottom, obtained
triangles.
2.4.3 Two-to-Two Triangulation
The two-to-two case requires deciding which sub-
polylines haveto be sewn together. Two sub-polylines
are sewn if the average distance between them is less
than a pre-defined threshold. This value is manually
set and mainly depends on the distance between slices
in the source medical images. The order in which the
sub-polylines are sewn is also determined by the dis-
tance between them. Firstly, the system tries to sew
together the two closest sub-polylines, and then the
two remaining sub-polylines. In both cases, the one-
to-one algorithm (Figure 6) is used in order to sew the
two sub-polylines.
The triangulation algorithm described above must
be repeated in order to generate patches for each clus-
ter. Figure 8 shows the triangle patches generated by
the triangulation algorithm in the case of the patella.
2.5 Sewing Triangle Patches
The triangulation algorithm generates one or more tri-
angle patches for each tetra-cone. In order to close the
mesh, these patches need to be sewn together. For that
purpose, the tetra-tree hierarchy is traversed in post-
order. For each node of the hierarchy, the patches
stored in its 4 children nodes that are closer than a
Initial Results of a Method for the Generation of Triangle Meshes Representing Bone Fragments using a Spatial Decomposition
301
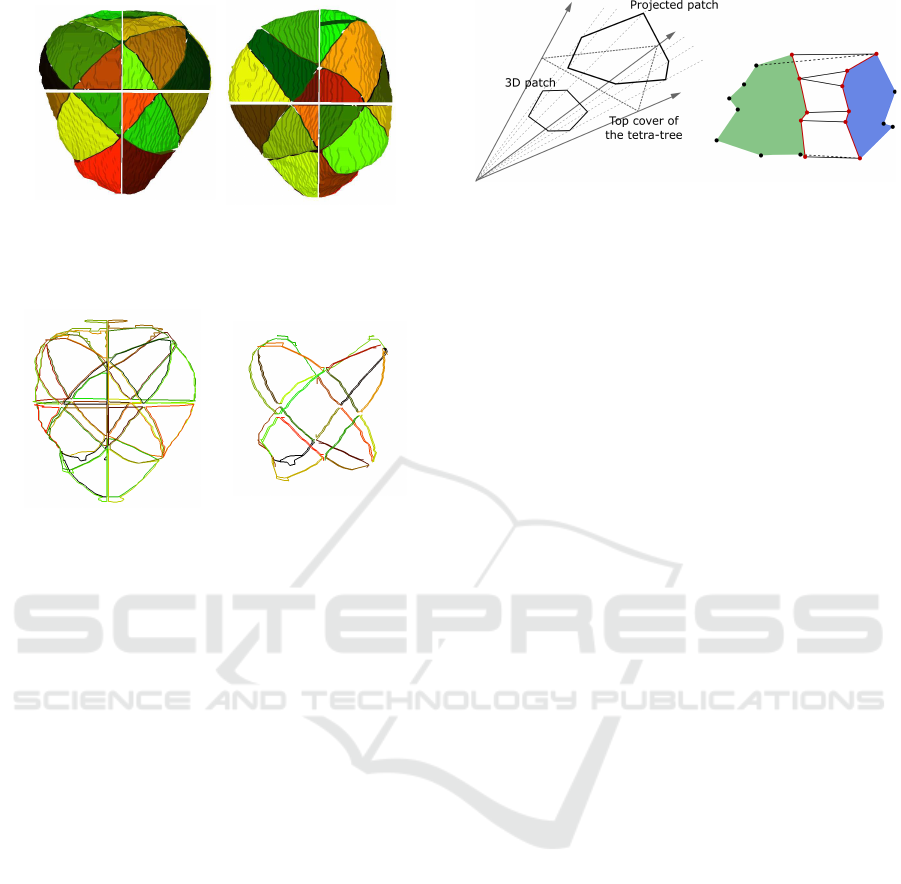
Figure 8: From left to right: front and back views of the
triangle patches generated by applying the triangulation al-
gorithm to each cluster in the leaf nodes of the hierarchy.
Each patch is displayed in a different colour.
Figure 9: Left, external contours of the triangle patches gen-
erated in each leaf tetra-cone. The external contour of each
patch is displayed in a different colour. Right, pairs of poly-
lines that are triangulated together in the last level of the
tetra-tree. Each pair is displayed in the same colour.
previously defined threshold are sewn. As occurs in
the patch generation algorithm, this threshold value is
manually chosen and depends on the point distribu-
tion, and thus on the distance between slices and the
resolution of the source medical images. The order in
which the patches are sewn is defined by the distance
between patches and closer patches have priority.
The algorithm proposed to sew two patch contours
starts with the identification of the points to be sewn.
For that purpose, the external edges of each patch are
calculated (Figure 9, left) as the edges that only be-
long to one triangle. Then these edges are projected
onto the plane defined by the top cover of the tetra-
cone containing them. In order to avoid overlapping
of the projection of the two patches, the patches are
separated by the displacing them the distance between
the centroids of both patches, in the direction defined
by both centroids. In 2D, the edges to be sewn are
defined as those whose points can be connected to a
point belongingto the other patch without intersecting
any of the two patches (Figure 10). Figure 9 (right)
shows the polylines to be sewn between every two
patches in the last level of the tetra-tree for the case of
the patella. Finally, new triangles are generated using
the one-to-one method to sew two polylines already
described in Section 2.4.
This sewing procedure is repeated in each node of
Figure 10: Left, schema that represents the linear projec-
tion of the external contours of a triangle patch onto the
plane defined by the top cover of its associated tetra-cone.
Right, schema representing the selection of the edges to be
sewn between two patches. Solid lines connect points of
edges that belong to the group of edges to be sewn group
since they do not intersect with any patch. Dotted lines in-
tersect with the patch, and therefore their associated edges
are discarded.
the hierarchy. Once all the nodes of a level have been
processed, the generated patches are transferred to the
parent node and the sewing algorithm is repeated at
the upper level. The process is repeated until reach-
ing the root node of the tetra-tree. The top image of
Figure 11 shows the patches generated in each of the
tetra-cones belonging to the top level of the tetra-tree.
At the top level, the parent node receives the
patches generated in its eight children nodes. These
patches have to be sewn together in order to close the
mesh. In this step of the algorithm, patches are sewn
two by two in a sequential process. Figure 11 sum-
marizes the three stages of this process.
At the first two stages of the process (Figure 11,
top and middle), the criteria used to select the points
to be sewn is that each point must be sewn to its clos-
est patch. Given a pair of patches, P
a
and P
b
, the
points to be sewn in P
a
are those whose closest patch
is P
b
. The points to be sewn in P
b
are calculated us-
ing the same procedure. Then patches are sewn using
the one-to-one algorithm previously described to sew
polylines. Due to the holes associated with the first
and the last slices of the stack, two sub-polylines may
be obtained when calculating the edges to be sewn in
some cases. To deal with the sewing in these cases,
the two-to-two algorithm is applied.
At the last stage of the process (Figure 11, bot-
tom), only two patches are remaining. At this stage,
all the external edges of both patches belong to the
polylines to be sewn, and therefore, the algorithm
to extract external contours is applied to get them.
Since the polylines representing the external contours
are closed, the one-to-one sewing algorithm requires
being adapted to properly join the two patches. As
mentioned above, the generated model contains two
holes associated with the contours in the first and the
last slices of the stack. Nevertheless, these two holes
GRAPP 2017 - International Conference on Computer Graphics Theory and Applications
302
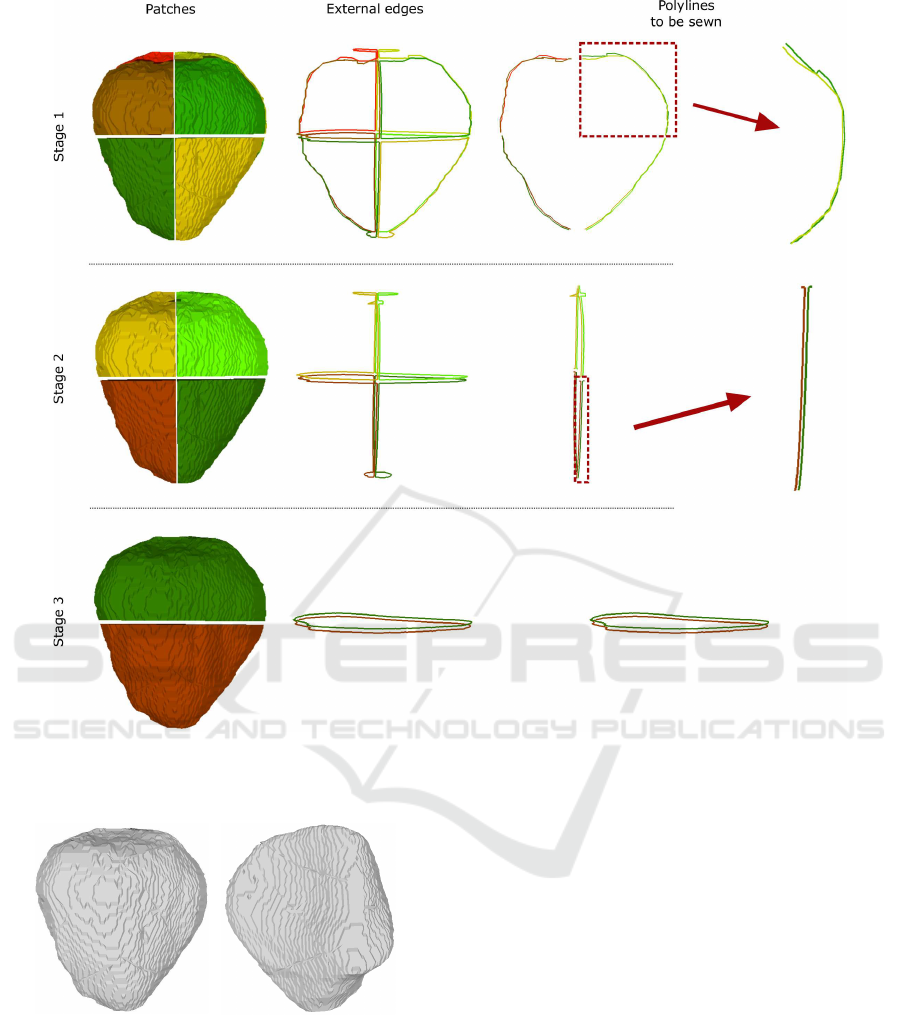
Patches
External edges
Polylines
to be sewn
Stage 1
Stage 2Stage 3
Figure 11: Left, triangle patches received as input in each of the three stages carried out at the top level of the tetra-tree.
Centre, external edges of those patches. Right, calculated polylines to be sewn at each of the three stages.
Figure 12: Front and back views of a mesh generated using
the proposed procedure in the case of the patella.
do not affect to the application of the algorithm, and
can be filled at the end. Figure 12 shows the results
obtained by applying the method in the case of the
patella.
3 DISCUSSION AND
CONCLUSIONS
In this paper, a preliminary study for the develop-
ment of a new method to generate triangle meshes
representing bone fragments from medical images has
been presented. This method uses a spatial decom-
position to implement a divide-and-conquer approach
that allows simplifying the problems that arise when
triangulating the contours extracted from consecutive
slices. Since the presented method is under develop-
ment, only initial results have been shown. Next para-
graphs discuss the main advantages of using a tetra-
tree instead of other spatial decompositions, as well as
the main aspects that should be improved in order to
apply the proposed method in the generation of more
complex bone fragment models.
The use of a tetra-tree provides additional prop-
erties to the generated model that encourage its uti-
Initial Results of a Method for the Generation of Triangle Meshes Representing Bone Fragments using a Spatial Decomposition
303

lization in interactive environments (Jim´enez et al.,
2011). This spatial decomposition enables the visu-
alization of the triangles that either take part or are
close to taking part in an interaction, enabling the ac-
cessibility to far or non-visible parts of the generated
model without having to use additional algorithms
such as ray-triangle or ray-box intersection tests. Ad-
ditionally, the tetra-tree provides a smooth transition
when changing the level of detail during interaction.
In contrast to other widely used spatial decomposi-
tions like the octree (Chen and Huang, 1988), the
tetra-tree is object-centred; hence the classification of
the geometry is invariant to rotations. Moreover, the
construction cost is lower and the interaction times
are faster than using an octree (Jim´enez et al., 2011).
Although the developed algorithm produces
promising results in the generation of bone fragment
models, some cases in which the algorithm does not
perform well have been detected. Firstly, the classifi-
cation of points in the tetra-tree is not always optimal,
and hinders the generation of patches in the more ir-
regular areas, especially in the case of long bones. In
addition, the classification of points often generates
triangulation cases that cannot be solved using the al-
gorithms described in Section 2.4. Finally, in the case
of models with several concavities, the linear projec-
tion proposed in Section 2.5 in order to find the edges
to be triangulated for sewing two patches may not be
the best option.
Regarding the classification of the point cloud, the
tetra-tree does not provide a homogeneous classifica-
tion of the points in the case of long bone fractures. In
these cases, the more detailed area, which is usually
the fracture zone, is located at the ends of each bone
fragment; hence the tetra-tree should be further sub-
divided in those areas. The research of a new spatial
decomposition that fits better the shape of any bone
fragment would be profitable. For that purpose, the
new spatial decomposition could use additional infor-
mation such as the intensity value or the estimated
curvature at each point.
During the generation of patches from contours,
we detected that two special triangulation cases are
not resolved. On the one hand, some isolated points
can be classified into one tetra-cone because of the
location of the centroid and the orientation of the
tetra-tree. These points divide polylines into two sub-
polylines, and thus a hole is obtained duringtriangula-
tion. Furthermore, isolated points may cause that the
triangulation algorithm described in Section 2.4 gen-
erates incorrect triangles. In order to solve this case,
two different approaches could be used: developing a
new triangulation algorithm that is not affectedby iso-
lated points, or reclassifying the points of the affected
tetra-cone avoiding isolated points.
On the other hand, a closed small contour can be
completely classified in a single tetra-cone. There-
fore, that closed contour must be triangulated with the
polyline extracted from the next slice. The one-to-
one triangulation algorithm described in Section 2.4
is not able to properly generate triangles in that case.
To address this case, two different strategies could
be utilized: reclassifying the points in the tetra-tree
avoiding the classification of entire contours in a sin-
gle tetra-cone, or developing a new triangulation al-
gorithm with the purpose of dealing with this case.
Once patches havebeen generated in the leaf tetra-
cones, these are hierarchically sewn as described in
Section 2.5. In order to calculate the edges to be tri-
angulated, patches are linearly projected onto the top
plane of their associated tetra-cone. This projection
obtains good results in some of the testes cases. How-
ever, the linear projection of the patches onto the top
plane of the tetra-tree does not work well if the bone
fragments have various concavities, such as the case
of femoral condyles. In order to deal with these cases,
a different type of projection should be used.
In the future, new methods will be developed in
order to solve the special cases detected when sewing
consecutive contours. In addition, the method could
be extended to work with alternative spatial decompo-
sitions that fit better the shape of any bone fragment.
For that purpose, these spatial decompositions could
use not only the position of the points, but also the
intensity and the estimated curvature at each point, in
order to adjust them better to the bone fragment in the
more detailed areas like the fracture zone. Finally, a
new strategy to correctly calculate edges to be sewn
when a linear projection does not perform well will
be developed
ACKNOWLEDGEMENTS
This work has been partially supported by the Min-
isterio de Econom´ıa y Competitividad and the Euro-
pean Union (via ERDF funds) through the research
project DPI2015-65123-R.
REFERENCES
Chen, H. H. and Huang, T. S. (1988). A survey of construc-
tion and manipulation of octrees. Computer Vision,
Graphics, and Image Processing, 43(1):112–113.
Egol, K. A., Koval, K. J., and Zuckerman, J. D. (2010).
Handbook of Fractures. Lippincott Williams &
Wilkins.
GRAPP 2017 - International Conference on Computer Graphics Theory and Applications
304

Feito, F. R. and Torres, J. C. (1997). Inclusion test for gen-
eral polyhedra. Computers & Graphics, 21(1):23–30.
Fornaro, J., Harders, M., Keel, M., Marincek, B., Trentz,
O., Szekely, G., and Frauenfelder, T. (2008). Interac-
tive visuo-haptic surgical planning tool for pelvic and
acetabular fractures. Studies in health technology and
informatics, 132(Figure 1):123–5.
Fornaro, J., Keel, M., Harders, M., Marincek, B., Sz´ekely,
G., and Frauenfelder, T. (2010a). An interactive sur-
gical planning tool for acetabular fractures: initial re-
sults. Journal of orthopaedic surgery and research,
5(50):1–8.
Fornaro, J., Sz´ekely, G., and Harders, M. (2010b). Semi-
automatic segmentation of fractured pelvic bones for
surgical planning. Biomedical Simulation, 5958:82–
89.
F¨urnstahl, P., Sz´ekely, G., Gerber, C., Hodler, J., Snedeker,
J. G., and Harders, M. (2012). Computer assisted re-
construction of complex proximal humerus fractures
for preoperative planning. Medical image analysis,
16(3):704–20.
Ho, C.-c., Fu-che, W., Bing-yu, C., and Ouhyoung, M.
(2005). Cubical marching squares: Adaptive feature
preserving surface extraction from volume data. Com-
puter Graphics Forum, 24:2005.
Jim´enez, J. J., Feito, F. R., and Segura, R. J. (2011). Tetra-
trees properties in graphic interaction. Graphical
Models, 73(5):182–201.
Jim´enez, J. J., Feito, F. R., Segura, R. J., and Og´ayar,
C. J. (2006). Particle Oriented Collision Detection us-
ing Simplicial Coverings and Tetra-Trees. Computer
Graphics Forum, 25(1):53–68.
Jim´enez, J. J., Paulano, F., Pulido, R., and Jim´enez, J.
(2016). Computer assisted preoperative planning of
bone fracture reduction: simulation techniques and
new trends. Medical Image Analysis, 30:30–45.
Jim´enez, J. J. and Segura, R. J. (2008). Collision detection
between complex polyhedra. Computers & Graphics,
32(4):402–411.
Lee, P.-Y., Lai, J.-Y., Hu, Y.-S., Huang, C.-Y., Tsai, Y.-
C., and Ueng, W.-D. (2012). Virtual 3D planning
of pelvic fracture reduction and implant placement.
Biomedical Engineering: Applications, Basis and
Communications, 24(03):245–262.
Lorensen, W. E. and Cline, H. E. (1987). Marching cubes:
A high resolution 3D surface construction algorithm.
ACM Siggraph Computer Graphics, 21(4):163–169.
Paulano, F., Jim´enez, J. J., and Jim´enez, J. (2015). Sur-
face reconstruction of bone fragments: A comparative
study. In Tavares, J. M. R. S. and Jorge, R. N., editors,
Computational Vision and Medical Image Processing
V, chapter 51, pages 321–326. CRC Press.
Paulano, F., Jim´enez, J. J., and Pulido, R. (2014). 3D seg-
mentation and labeling of fractured bone from CT im-
ages. The Visual Computer, 30(6-8):939–948.
Pulido, R., Paulano, F., and Jim´enez, J. J. (2014). Recon-
struction & Interaction with3D Simplified Bone Mod-
els. In WSCG 2014 Communication Papers Proceed-
ings, pages 321–327.
Samet, H. (2010). Sorting in space: multidimensional, spa-
tial, and metric data structures for computer graph-
ics applications. In SA ’10 ACM SIGGRAPH ASIA
2010 Courses, pages 1–52, Seoul, Republic of Korea.
ACM.
Tsai, M.-D., Hsieh, M.-S., and Jou, S.-B. (2001). Virtual
reality orthopedic surgery simulator. Computers in Bi-
ology and Medicine, 31(5):333–351.
Willis, A., Anderson, D., Thomas, T., Brown, T., and
Marsh, J. L. (2007). 3D reconstruction of highly frag-
mented bone fractures. In Medical Imaging 2007: Im-
age Processing. Proceedings of the SPIE, page 65121.
Initial Results of a Method for the Generation of Triangle Meshes Representing Bone Fragments using a Spatial Decomposition
305
