
Recent Advances in Fiber Cavity Ring-down Technology
Susana Silva and Orlando Frazão
INESC TEC and Department of Physics and Astronomy, Faculty of Sciences of University of Porto,
Rua do Campo Alegre 687, 4169-007 Porto, Portugal
Keywords: Cavity Ring-down, Optical Fibre Sensors, Strain, Curvature, Refractive Index.
Abstract: A brief review in the fibre cavity ring-down (CRD) technique is presented. It addresses the latest
developments in CRD technique for sensing applications, undergone at INESC TEC. The CRD is based on
the conventional configuration with the possibility of adding amplification in order to compensate the
output signal losses induced by the sensing head. The results obtained for strain, curvature and refractive
index sensing are presented, corresponding to distinct sensing structures, namely, a chirped fibre Bragg
grating (FBG), a long period grating (LPG) and a multimode interference (MMI) based sensor.
1 INTRODUCTION
The cavity ring-down (CRD) technique consists in a
spectroscopy method broadly used in technology.
Being mainly employed in the sensor area, this
methodology enables an accurate analysis of
amplitude behaviour over the time. Throughout the
past decades, the CRD spectroscopy has been
subject of a lot of research, namely in chemical and
molecular analysis in real time (Berden et al., 2000).
The principle involved settles the basis for various
configurations, being also applied to resonant optical
cavities with high reflective mirrors, as a result of
the high evolution of this technique (Herbelin, 1980)
(Herbelin et al., 1980; Anderson et al., 1984).
Through association with the previous developed
fibre loops, there were implemented new fibre optic-
based CRD settings, which, in turn, used a fibre loop
operating as the resonant cavity. This configuration
quickly obtained a lot of popularity in the scientific
community, mainly for presenting an effective
alternative to the usual CRD configuration (Stewart,
2004). By virtue of these conceptual studies, the
CRD technique has been target of a lot of research in
the spectroscopy field, being implemented in the last
decade to the measurement of physical parameters,
such as strain (Tarsa et al., 2004; Ni et al., 2007;
Silva et al., 2015a), temperature (Wang, 2005),
curvature (Lerber et al., 2002; Silva et al., 2015b)
and pressure (Wang and Scherrer, 2004a; Wang and
Scherrer, 2004b; Qiu et al., 2007). More recently, a
fast development of CRD technique allied to the
biochemical sensing field can also be easily
recognized. The implementations in this area are
quite extensive, which can go from detection of
organic dyes (Brown et al., 2002) to unicellular
organisms (Tarsa et al., 2004), or even 1-octyne in
decane solution (Pu and Gu, 2009). The CRD
approach has also been widely used for refractive
index of liquids (Ni et al., 2008; Zhou et al., 2009a;
Zhou et al., 2009b; Wang et al., 2010; Wong et al.,
2012) and gas sensing (Stewart et al., 2001; Vogler
et al., 2003; Zhao et al., 2013; Shimizu and
Noriyasu, 2014).
In addition to these applications, the CRD
technique use is widespread, being implemented in
chemical sensors (Wang, 2009), using frequency-
shifted interferometry (Ye et al., 2011), using
wavelength-tuneable ultrashort pulsed light (Hiraoka
et al., 2013) or even an Optical Time Domain
Reflectometer (OTDR) instead of the usual
implemented laser and modulator setup (Passos et
al., 2014). More recently, a new CRD topology for
remote sensing was demonstrated (Silva et al.,
2016).
This work adresses the latest developments in
fibre optic based CRD technique for sensing
applications, undergone at INESC TEC. The results
obtained for strain, curvature and refractive index
sensing are presented, with focus to the sensing
structures
used and the CRD configuration for such
purpose.
Silva S. and Frazao O.
Recent Advances in Fiber Cavity Ring-down Technology.
DOI: 10.5220/0006258303510355
Copyright
c
2017 by SCITEPRESS – Science and Technology Publications, Lda. All rights reserved
2 FIBER-OPTIC CRD SETUP
The experimental setup of the main configuration
CRD system used for sensing is presented in Figure
1. The fibre loop is composed of two standard (2 ×
1) 1:99 optical fibre couplers and a sensing head. A
commercial OTDR is used as modulated laser source
in order to send impulses (1 s at 1550 nm) down
into the fibre cavity. The train of pulses is coupled
via 1% arm of the input optical coupler, rings around
inside the fibre loop and is coupled out via 1 % arm
of the output coupler; the amplitude of the output
pulses decay temporally due to the total existing
losses in the fibre loop (fibre loss, fibre couplers
insertion losses, sensing head transmission
attenuation), passes through a photodetector (gain of
40 dB) and is monitored in an oscilloscope.
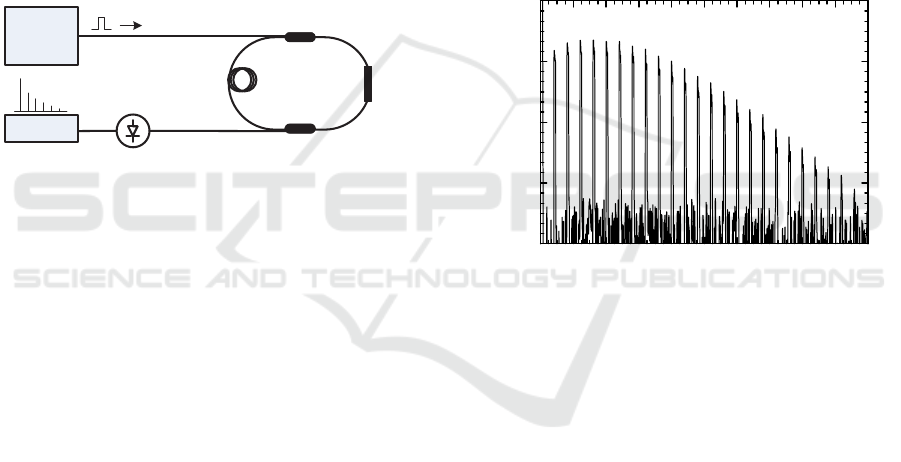
Figure 1: Experimental setup of the CRD configuration
that uses an OTDR as laser source and a transmission-
based fiber structure as sensing head.
The advantage of using an OTDR is to allow
system optimization either in terms of impulse and
optical power – allowing its use in long distance
applications. Furthermore, the use of a multimode
laser source increases the optical power inside the
fibre loop. Also, the output signal of the OTDR may
be used as laser source or to interrogate the variation
of the output signal.
3 SENSING APPLICATIONS
3.1 Strain Sensing
A fibre-based CRD configuration using an OTDR to
interrogate the output signal has been developed for
the measurement of strain (Silva et al., 2015a). The
sensing head, which is placed inside the fibre loop
cavity (1560 m), is based on a chirped fibre Bragg
grating (chirped-FBG) and acts as a strain sensing
element. The chirped-FBG is centred at 1570 nm,
has 4 nm width and is interrogated in transmission.
The output signal response is strongly dependent
of the wavelength position of the FBG with respect
to the OTDR laser source (operating at 1550 nm). If
the chirped-FBG is placed at lower wavelengths, the
output signal is expected to decrease with increasing
strain. On the other hand, if the FBG is placed at
wavelengths higher than 1550 nm (in this case, the
FBG is centred at 1570 nm) the output signal is
expected to increase with applied strain.
Figure 2 presents the OTDR pulse intensity
decay that is back-reflected by the chirped-FBG
inside the fibre loop. At the beginning, there is
signal saturation that may be avoided by placing a
few meters of singlemode fibre between the OTDR
and the cavity ring. Afterwards, the amplitude of the
signal decays due to the several round trips of the
pulse inside the cavity, as expected.
Figure 2: OTDR waveform of the impulse intensity decay
caused by the chirped-FBG inside the fiber loop.
The operation mode of the CRD interrogated by
the OTDR is based on the second reading of the
back-reflected light from the FBG. In this case, the
light travelled ca.1600 m which corresponds to a
single round trip of 8 s, similar to the one obtained
with the CRD configuration. This also corresponds
to the distance between two consecutive peaks (800
m from observing Fig. 2) – due to signal processing
of the OTDR, the back-reflected and measured light
is divided by 2; therefore, the effective distance
between two consecutive peaks is ca. 1600 m.
The OTDR may also be a viable interrogation
method as depicted in Figure 3.
Photodetector
Optical fiber coupler (2)
1:99
Optical fiber coupler (1)
1:99
Modulated
Laser Source
Oscilloscope
Sensing
head
Fibre
Loop
02468101214161820
12
16
20
24
28
Amplitude (dB)
Distance (Km)
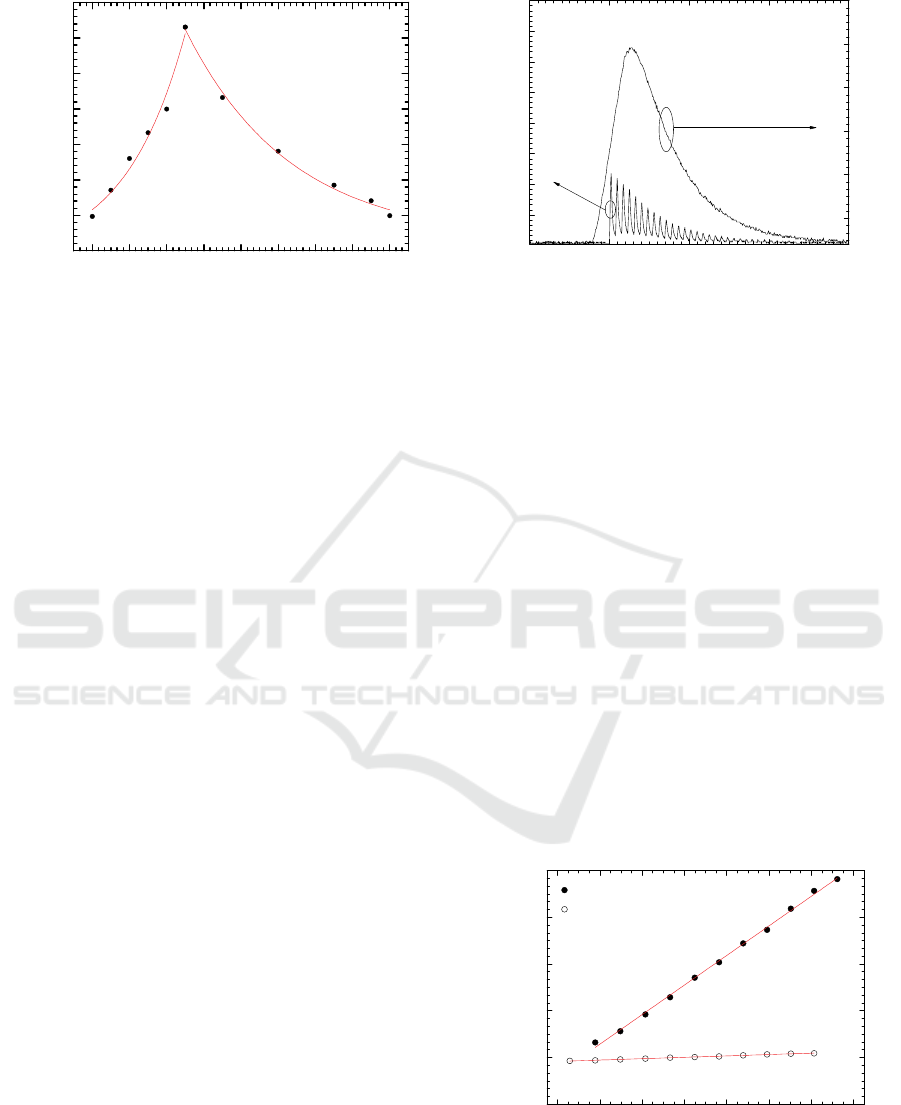
Figure 3: Cavity ring-down time versus applied strain to
the chirped-FBG when interrogated by the OTDR.
When strain is applied, the chirped-FBG moves
to longer wavelengths, scanning the several
wavelength peaks of the laser source and thus
resulting in a periodic behaviour as shown in
Figure 3. In this case, the ring-down time is almost
10-fold the one obtained with the conventional CRD
configuration (22.8 µs) and ranges from 180 to
206 µs due to the FBG position regarding the laser
source. Using the CRD configuration it was possible
to obtain a linear response to strain applied to the
chirped-FBG in the range 0-2000 and a sensitivity of
1.34 ns/ was obtained.
3.2 Curvature Sensing
The fibre-based CRD configuration presented in
Figure 1 has also been used for the measurement of
curvature (Silva et al., 2015b). An OTDR is used to
send impulses down into the fibre loop cavity
(800 m), inside of which a long period grating
(LPG) is placed to act as sensing device. The LPG
was written by UV in SMF28e with a period of 335
nm and a length of 25 mm. The LP07 resonance
mode of the LPG is positioned at 1566.2 nm with a
full width half maximum (FWHM) of 33.7 nm. This
resonance is situated in the long-wavelength side of
the multimode laser spectrum which is centred at
1550 nm and has a 50 nm-bandwidth.
In this case, an added-signal was used for
curvature sensing and it was obtained by the sum of
several conventional CRD impulses. Figure 4 shows
the CRD trace when the LPG was interrogated using
(1) the CRD conventional signal processing and (2)
when an added-signal was applied in the fibre loop.
Figure 4: CRD trace for (1) conventional configuration
and (2) added-signal obtained by the sum of several
conventional CRD impulses.
In the first case (1), the OTDR sent impulses of
1 s at 1550 nm down into the fibre cavity; the time
of a single round trip was ca. 3.85 s which is
determined by the cavity length. An exponential fit
was also performed and a ring-down time of 23.7 µs
was attained, with an associated loop loss of 0.7 dB.
In the second case (2), the OTDR sent impulses of
20 s at 1550 nm in order to obtain the added-signal.
After performing an exponential fit, a ring-down
time of 43.3 µs was obtained. Such results show that
the added-signal increases the optical power but
increases as well the ring-down time due to the sum
of the several loops that light travels inside the ring.
The behaviour of this structure as a curvature
sensor was duly characterized. As expected, the
amplitude of the added-signal decreases with
decreasing curvature, as result of bending the LPG.
The ring-down time as a function of curvature was
also determined for both conventional CRD- and
added-signals, as depicted in Figure 5.
Figure 5: Ring-down time versus curvature applied to the
LPG when interrogated by the conventional CRD signal
processing and added-signal.
0 200 400 600 800 1000 1200 1400 1600
175
180
185
190
195
200
205
210
Ring-down time (s)
()
0,03
0,04
0,05
0,06
0,07
0,08
-50 0 50 100 150
0,026
0,028
0,030
0,032
0,034
0,036
0,038
0,040
Am
p
litude
(
mV
)
Amplitude (mV)
Time (s)
(2)
(1)
2,22,42,62,83,03,23,43,6
15
20
25
30
35
40
Added-signal
Conventional CRD signal
Ring-down time (s)
1/R (m
-1
)
Results show that the sensitivities obtained for
the added-signal and conventional CRD signal are
15.3 s/m
-1
and 0.74 s/m
-1
, respectively. The
added-signal configuration presents a sensitivity 20-
fold the one obtained for the conventional CRD
signal processing.
3.3 Refractive Index Sensing
In a recent approach, a CRD system using a
multimode interference (MMI) based fibre sensor
was developed for refractive index (RI) sensing. Due
to the high losses associated to the MMI-based
sensing head, an erbium doped fibre amplifier
(EDFA) was inserted in the fibre loop cavity for
amplification of the output signal. The EDFA is
composed by 2 m of an erbium-doped fibre (losses
of 14 dB/m @ 980 nm) and in order to compensate
the losses from the MMI-based sensing head, a
current of 155.7 mA was applied to the fibre device.
The sensing head is based on multimode
interference and relies on a singlemode – coreless-
multimode – singlemode fibre configuration. The
coreless-MMF is a pure silica fibre with 125 m-
diameter and 20 mm-length, which was spliced
between two SMFs and interrogated in transmission.
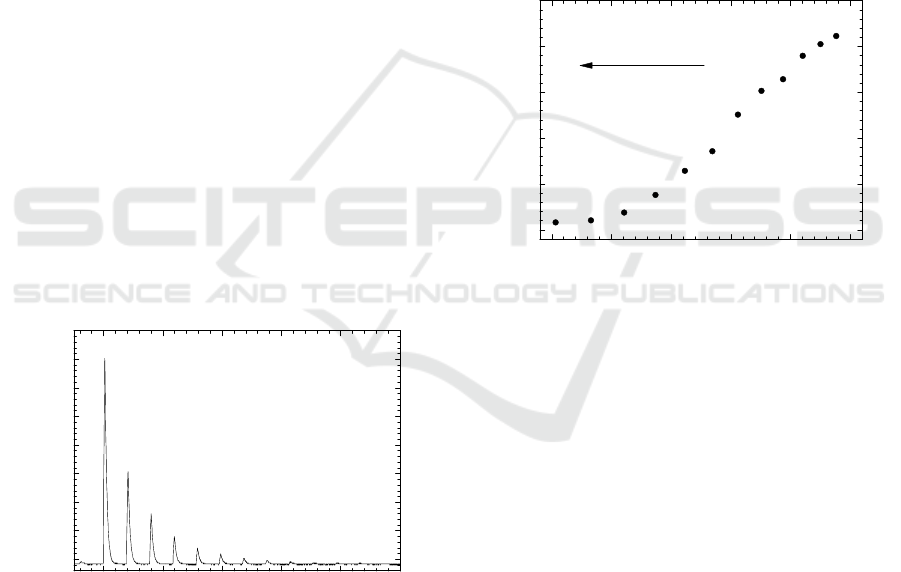
The CRD trace obtained with the proposed
configuration is shown in Figure 6. The time of a
single round trip is ca. 7.8 s and is strongly
dependent on the pulse width, fibre length, fibre
losses, MMI losses and others.
Figure 6: CRD trace for pulses sent by the modulated
multimode laser source into the fiber loop with 500 ns
width.
The sensing head was then submitted to RI
changes of water caused by temperature variation.
The MMI-based fibre sensor was placed under water
and submitted to increasing temperature in the range
25–80C. In this experiment, the OTDR sent
impulses of 500 ns at the operation wavelength of
1550 nm, which in turn is located in the slope of the
band-rejection filter centred at 1546 nm. Therefore,
the wavelength variation caused by RI changes of
the external medium will shift the band-rejection
peaks, associated with an amplitude variation of the
acquired signal. In this case, the temperature-
induced RI variation of water causes the amplitude
of the band-rejection peaks to change and
consequently leading to measurable losses in the
acquired CRD signal.
Figure 7 presents the ring-down time variation
according to temperature-induced RI changes of
water. Since the MMI-based fiber sensor is
intrinsically sensitive to temperature but also to RI
of the external medium, one had to remove the
temperature component of the acquired output
signal, in order to obtain the presented results.
Figure 7. Ring-down time versus temperature-induced RI
changes of water.
The behavior of the sensing head to temperature
variation was studied. The MMI fiber sensor was
placed in a furnace and submitted to increasing
temperature and a negligible sensitivity of -1.610
-
9
s/C was attained. This allowed eliminating the
temperature component from RI measurement of
water and a linear sensitivity of 580 s/RIU in the
RI range of 1.324-1.331 was obtained.
4 CONCLUSIONS
This brief overview on fiber optic based CRD
technique for sensing applications, undergone at
INESC TEC, shows that one of the new lines of
research is the use of existing equipment on the
market for long range measurement. An example
was recently demonstrated, namely, the use of the
OTDR for the measurement of strain. Another line
of investigation is signal processing that makes the
0 20406080100
0
50
100
150
200
250
300
350
400
Amplitude (mV)
Time (s)
1.322 1.324 1.326 1.328 1.330 1.332
0
1
2
3
4
5
Ring-down time (s)
Refractive index of water (RIU)
Temperature increase

CRD a quick acquisition system and allows analysis
in real time. The use of the add-signal as a new
solution presents greater sensitivity when the sensor
is subjected to curvature. Finally it was presented the
use of the CRD for RI measurement. It is clearly that
its application in the future will be in spectroscopy
for medicine, biomedical and chemical areas of
research.
ACKNOWLEDGEMENTS
This work was supported by Project "CORAL –
Sustainable Ocean Exploitation: Tools and Sensors,
NORTE-01-0145-FEDER-000036, financed by the
North Portugal Regional Operational Programme
(NORTE 2020), under the PORTUGAL 2020
Partnership Agreement, and through the European
Regional Development Fund (ERDF). S.S. received
a Pos-Doc fellowship (ref. SFRH/BPD/92418/2013)
also funded by FCT – Portuguese national funding
agency for science, research and technology.
REFERENCES
Berden, G., Peeters, R., Meijer, G., 2000. Int. Rev. Phys.
Chem. 19, 565-607.
Herbelin, J. M., McKay, J. A., Kwok, M. A., Uenten, R.
H., Urevig, D. S., Spencer, D. J., 1980. Applied Optics
19 (1), 144–147.
Anderson, D. Z., Frisch, J. C., Masser, C. S., 1984.
Applied Optics 23 (8), 1238–1245.
Stewart, G., Atherton, K., Culshaw, B., 2004. Opt. Lett. 29
(5), 442-444.
Tarsa, W. P., Brzozowski, D. M., Rabinowitz, P.,
Lehmann, K. K., 2004. Opt. Lett. 29 (12), 1339-1341.
Ni, N., Chan, C. C., Dong, X. Y., Sun, J., Shum, P., 2007.
Meas. Sci. Technol., Special Issue, 18, 3135-3138.
Silva, S., Passos, D. J., Marques, M. B., Frazão, O., 2015a.
Microw. Opt. Technol. Lett. 57 (6), 1442-1444.
Wang, C., 2005. Opt. Eng. Lett. 44 (3), 030503.
Lerber, T., Sigrist, M. W., 2002. Appl. Opt. 41 (18), 3567-
3575.
Silva, S., Biswas, P., Bandyopadhyay, S., Jorge, P. A.,
Marques, M. B., Frazão, O., 2015b. IEEE Photon.
Technol. Lett. 27 (19), 2079-2082.
Wang, C., Scherrer, S. T., 2004a. Opt. Lett. 29 (4), 352-
354.
Wang, C., Scherrer, S. T., 2004b. Appl Opt. 43 (35), 6458-
6464.
Qiu, H., Qiu, Y., Chen, Z., Fu, B., Chen, X., Li, G., 2007.
Microw. Opt. Technol. Lett. 49 (7), 1698-1700.
Brown, R. S., Kozin, I., Tong, Z., Oleschuk, R. D., Loock,
H.-P., 2002. J. Chem. Phys. 117, 10444-10447.
Tarsa, P. B., Wist, A. D., Rabinowitz, P., Lehmanna, K.
K., 2004. Appl. Phys. Lett. 85 (19), 4523–4525.
Pu, S., Gu, X., 2009. Opt. Lett. 34 (12), 1774-1776.
Ni, N., Chan, C., Xia, L., Shum, P., 2008. IEEE Photon.
Technol. Lett. 20 (16), 1351-1353.
Zhou, K. M., Webb, D., Farries, M., Hayes, N., Zhang, L.,
Bennion, I., 2009a. Opt. Lasers Eng. 47, 1023-1027.
Zhou, K. M., Webb, D. J., Mou, C. B., Farries, M., Hayes,
N., Bennion, I., 2009b. IEEE Photonics Technol. Lett.
21 (22), 1653-1655.
Wang, C., Herath, C., 2010. Opt. Lett. 35 (10), 1629-1631.
Wong, W. C., Zhou, W., Chan, C. C., Dong, X., Leong, K.
C., 2012. Sens. Actuat. B 161, 108-113.
Stewart, G., Atherton, K., Yu, H., Culshaw, B., 2001.
Meas. Sci. Technol. 12, 843–849.
Vogler, D. E., Muller, M. G., Sigrist, M. W., 2003. Appl.
Opt. 42 (27), 5413-5417.
Zhao, Y., Bai, L., Wang, Q., 2013. Opt. Communications
309, 328-332.
Shimizu, H., Noriyasu, H., 2014. Japanese J. Appl. Phys.
53, 116601.
Wang, C., 2009. Sensors 9 (10), 7595-7621.
Ye, F., Qi, B., Qian, L., 2011. Optics letters 36 (11), 2080-
2082.
Hiraoka, T., Ohta, T., Ito, M., Nishizawa, N., Hori, M.,
2013. Japanese J. Appl. Physics 52 (4R), 040201.
Passos, D. J., Silva, S. O., Fernandes, J. R. A., Marques,
M. B., Frazão, O., 2014. Photonic Sensors 4 (4) 295-
299.
Silva, S., Marques, M. B., Frazão, O., 2016. Microw. Opt.
Technol. Lett. 58 (11), 2711-2713.
