
Multisensory Analytics: Case of Visual-auditory Analysis of Scalar
Fields
E. Malikova
1
, V. Pilyugin
2
, V. Adzhiev
3
, G. Pasko
2
and A. Pasko
3
1
LLC SMEDX, Samara, Russian Federation
2
National Research Nuclear University "MEPhI", Moscow, Russian Federation
3
National Centre for Computer Animation, Bournemouth University, Bournemouth, U.K.
Keywords: Multisensory Data Analysis, Visual Analytics, Sonification, Scientific Visualization, Scalar Field,
Multimedia Coordinates, Sound.
Abstract: A well-known definition of visualization is the mapping of initial data to a visual representation, which can
be perceived and interpreted by humans. Human senses include not only vision, but also hearing, sense of
touch, smell and others including their combinations. Visual analytics and its more general version that we
call Multisensory Analytics are areas that consider visualization as one of its components. We present a
particular case of the multisensory analytics with a hybrid visual-auditory representation of data to show how
auditory display can be used in the context of data analysis. Some generalizations based on using real-valued
vector functions for solving data analysis problems by means of multisensory analytics are proposed. These
generalizations might be considered as a first step to formalization of the correspondence between the initial
data and various sensory stimuli. An illustration of our approach with a case study of analysis of a scalar field
using both visual and auditory data representations is given.
1 INTRODUCTION
Visual analysis of graphical representation of data has
practically become an essential part of modern
scientific research. Through applying analytical
reasoning facilitated by visual representations
hypotheses about the data can be either confirmed or
rejected leading to a better understanding of the data
and subsequently about a phenomena that data
represents. Such a reasoning process using visual
representations of data is called Visual Analytics
(Wong, 2004; Keim, 2008).
Nowadays we deal with processes of intensive
human interaction with large amounts of data offering
the prospects of extracting useful hidden information.
The growing complexity and amount of raw data
require expanding the means of visual analytics,
involving multimedia, virtual and augmented reality,
tactile and haptic devices, 3D printing and other
means of information representation for human
perception and analysis. A general definition of
visualization as "a binding (or mapping) of data to a
representation that can be perceived" (Foley, 1994)
gives the ground to expansion of visual analysis to
become multisensory analysis. This expansion
requires involving other human senses besides vision,
namely hearing, sense of touch and others. Involving
multiple human senses into the process of data
analysis and analytical reasoning is the main feature
of the Multisensory Analytics approach as an
extension of the Visual Analytics. From the authors’
point of view, this approach can be the next emerging
topic in the field of comprehensive data interpretation
and analysis.
The formalization of the multisensory analytics
process and particularly of establishing
correspondences between the initial data and multiple
sensory stimuli is an open research question. In this
paper, we propose a general approach to multisensory
analytics and illustrate this approach with a case study
of scalar fields analysis using hybrid audio-visual
data representation.
2 RELATED WORKS
In this section we discuss related topics and concepts
such as visualization and visual analytics, sonification
and perceptualization, as well as geometric modeling
using real functions.
322
Malikova E., Pilyugin V., Adzhiev V., Pasko G. and Pasko A.
Multisensory Analytics: Case of Visual-auditory Analysis of Scalar Fields.
DOI: 10.5220/0006255003220329
In Proceedings of the 12th International Joint Conference on Computer Vision, Imaging and Computer Graphics Theory and Applications (VISIGRAPP 2017), pages 322-329
ISBN: 978-989-758-228-8
Copyright
c
2017 by SCITEPRESS – Science and Technology Publications, Lda. All rights reserved

2.1 Visualization and Visual Analytics
Informally, visualization can be understood as
making invisible visible, but more formally it can be
defined as the process of transforming data into a
visual form enabling viewers to observe and analyze
the data (McCormick, 1987). Visual analytics as a
method of data analysis is an extension of information
visualization and scientific visualization with a focus
on analytical reasoning enabled by interactive visual
interfaces (Wong, 2004). Visual analytics software
tools and techniques are used in various scientific
disciplines to form certain judgments on the basis of
the obtained data. Through applying analytical
reasoning facilitated by visual interfaces, hypotheses
about the data can be either confirmed or rejected
leading to a better understanding of the data (Keim,
2008). The paper (Keim, 2008) introduces a formal
description of the visual analytics process as
interconnected mappings from initial data to some
insight, which can be either directly obtained from
generated visual representations or in a combination
with automated analysis methods. We will provide a
similar formal description for the proposed approach
to multisensory analytics.
While (Keim, 2008) mentions a single-step
mapping from a data set to its visual representation
within the visual analytics process, (Pilyugin, 2013)
goes further and states that to obtain such a visual
representation (or a graphical image), one needs to
put some geometric model (multidimensional in the
general case) into correspondence with the initial
data. It means that a spatial scene, which is an
assembly of spatial objects with their geometric and
optical descriptions, has first to be constructed and
then a graphical image can be generated using some
rendering procedure for its further visual analysis.
2.2 Sonification and Perceptualization
Among the sensory stimuli other than visual, the
usage of sound has been widely investigated since
early 80-s (Yeung, 1980; Bly, 1982). The human
auditory perception is considered most quantitative
because of its sensitivity to subtle changes in the
sound characteristics. The technique of data
representation using variable sound characteristics
such as pitch, volume, note duration and others is
called data sonification (Kaper, 1999).
Auditory perception has always been the human's
early warning system, which operates in the
background mode and requires full attention, only
when the sound changes abruptly. In (Scaletti, 1991)
a small survey was made on the situations when using
audio analysis may be more effective than visual
perception. The main classes of data that fall in this
category are time-varying data and multidimensional
data. The auditory perception brings the unique
advantage to distinguish even small variations in the
parameters of the single sound wave and to compare
sound waves. Currently, it is considered that any
person may be trained to develop an ear for music. A
musical ear, traditionally viewed as a set of abilities
that allows to fully perceive music and to adequately
judge on all its nuances, but the presence of this
ability allows one to take advantage of the most
advanced extended analysis capabilities as well. In
(Mezrich, 1984) the procedures of time-varying data
representation in the graphical form using a musical
accompaniment are considered. In the paper (Lodha,
1997), there are examples of the presentation of
scientific data in the form of musical fragments. The
software product MUSE presented in (Lodha, 1997)
is the result of a collaboration of researchers and
musicians. This is largely a matter of sensory
capabilities of a specific researcher, but we can say
that combining auditory and visual perception allows
one to significantly enhance the ability to conduct
analysis more efficiently, taking advantages of two
sensory organs that work differently, and to perceive
the same information in different ways
complementing each other.
An extension of visualization through creating
additional perceptual human inputs or more general a
combination of several sensory stimuli for data
representation is called data perceptualization
(Grinstein, 1990; Ebert, 2004) or data sensualization
(Ogi, 1996). The typical combinations are between
visual and auditory stimuli (Grinstein, 1990; Jovanov,
1999), visual and tactile/haptic stimuli (Maciejewski,
2005), or three of these stimuli applied together (Ogi,
1996). Generalizing the above definition of
visualization, we can say that the purpose of
perceptualization is making abstraction perceivable.
Although some efforts have been made on the
development of data perceptualization, a formal
framework for establishing correspondences between
data and multiple sensory stimuli has not been yet
proposed. The concept of multimedia coordinates
was introduced and applied in multidimensional
shape modelling and rendering (Adzhiev, 1999)).
This concept provides a formalization of mapping
from a multidimensional geometric model to a
multimedia object including text, images, video,
sounds and other types of sensory stimuli.
Multisensory Analytics: Case of Visual-auditory Analysis of Scalar Fields
323
2.3 Function Representation in
Geometric Modeling
In geometric modelling, the necessity of compact
precise models with unlimited complexity has
resulted in the development of the new paradigm of
procedural modeling and rendering, where the
geometric shape and properties are evaluated upon
request using procedural rules. One of the approaches
to procedural modelling is to evaluate a real function
of point coordinates providing the point membership
for the shape at the given point along with the
measure of distance to its surface. A constructive
approach to the creation of such function evaluation
procedures for geometric shapes is called the
Function Representation (FRep) (Pasko, 1995). FRep
was extended in (Pasko, 2001) to the constructive
hypervolume model, where the object is represented
not by a single function, but by a vector-function with
one component responsible for the object geometry
and other components serving as point attribute
functions representing such object properties as
material, color, transparency, and others. Later, it will
be demonstrated that the use of the constructive
hypervolume model can bring significant advantages
to solving scientific data analysis problems.
3 AN APPROACH TO
MULTISENSORY ANALYTICS
As it was mentioned above, multisensory analytics
can be considered an extension of visual analytics
involving more than one human senses in the process
of data analysis. Based on the visual analytics process
as presented in (Keim, 2008) and the idea of an
intermediate multidimensional geometric
representation of initial data (Pilyugin, 2013), we
propose the following interpretation of the basic
multisensory analytics process.
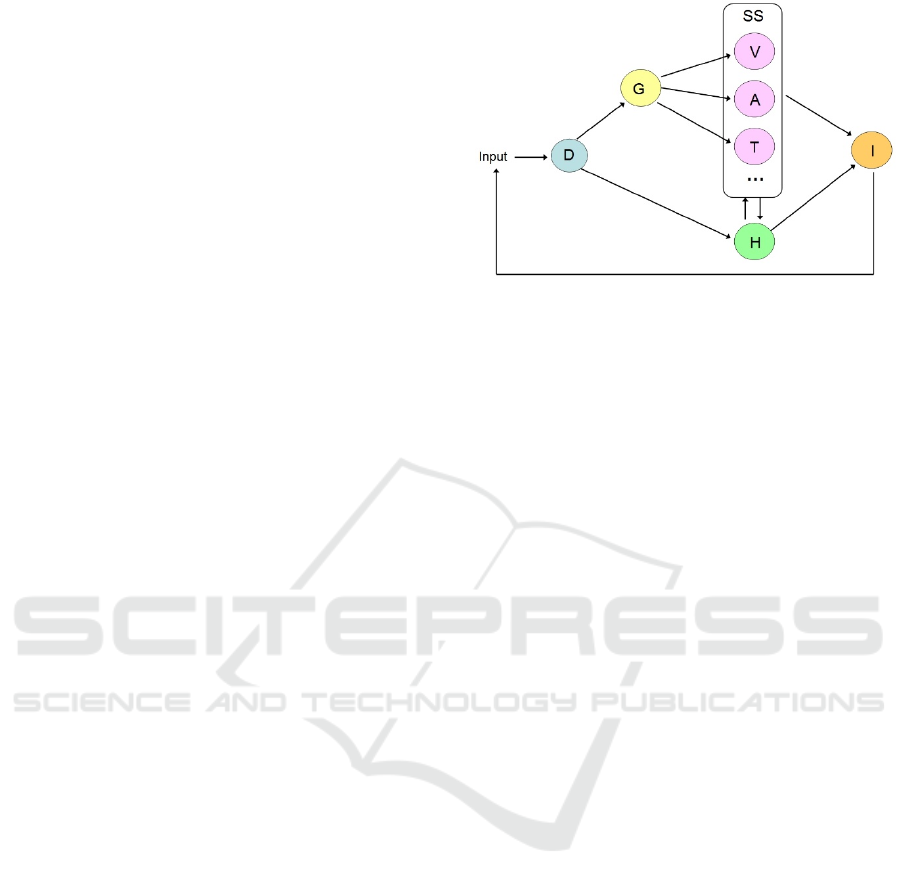
In the diagram (Fig. 1), the multisensory analytics
process is presented as a transformation (mapping)
M: D I from initial data D to insight I, which is the
goal of the entire process. The mapping M is a
superposition of mappings from one set to another in
the diagram. Thus, the initial data undergo geometric
interpretation and are mapped to the set G of
multidimensional geometric models. The next step is
to generate several sensory stimuli SS for human
perception. The mappings from G to SS are facilitated
by the introduction of a spatial scene, which is an
assembly of spatial objects with their geometric,
optical, auditory, tactile and other properties.
Figure 1: Multisensory analytics process.
Note that the geometric objects in the spatial scene
can have their dimensionality reduced to 2D and 3D
using geometric cross-sections and projections,
which allows for applying well-known graphical
rendering algorithms. When such a spatial scene is
constructed, various sensory stimuli can be generated
using corresponding rendering procedures: visual
stimuli V (graphical images), auditory stimuli A
(sounds), tactile and haptic stimuli T, and others. The
final insight I can be either directly obtained from the
generated sensory stimuli through human perception
and analysis, or it is obtained in a combination with
generating a hypothesis H and its analysis including
automated methods. Note that the hypothesis H can
be also represented with visual and other sensory
stimuli, which can help to refine or redefine it in the
process of analysis. The entire process has iterative
character, which is shown by the feedback loop in the
diagram. The user may tune or redefine not only the
parameters of the data input, but also the introduced
geometric models, the hypothesis, the selection of
sensory stimuli and the type and parameters of
rendering procedures.
Applying the presented general approach the
process of data analysis involving both human vision
and hearing, we need to do the following:
1) To define a mapping of the given data onto its
representation in the form of images and sound. To
obtain a necessary model of a spatial scene, its
geometric and optical models need to be extended by
a sound model. Such a spatial scene augmented with
sonification needs to be put in correspondence to the
given data and then sound rendering can be applied
with output to speakers or some other sound output
device for further analysis.
2) To analyze the rendered images and sound and
to interpret the results of this analysis in terms of the
initial data.
IVAPP 2017 - International Conference on Information Visualization Theory and Applications
324
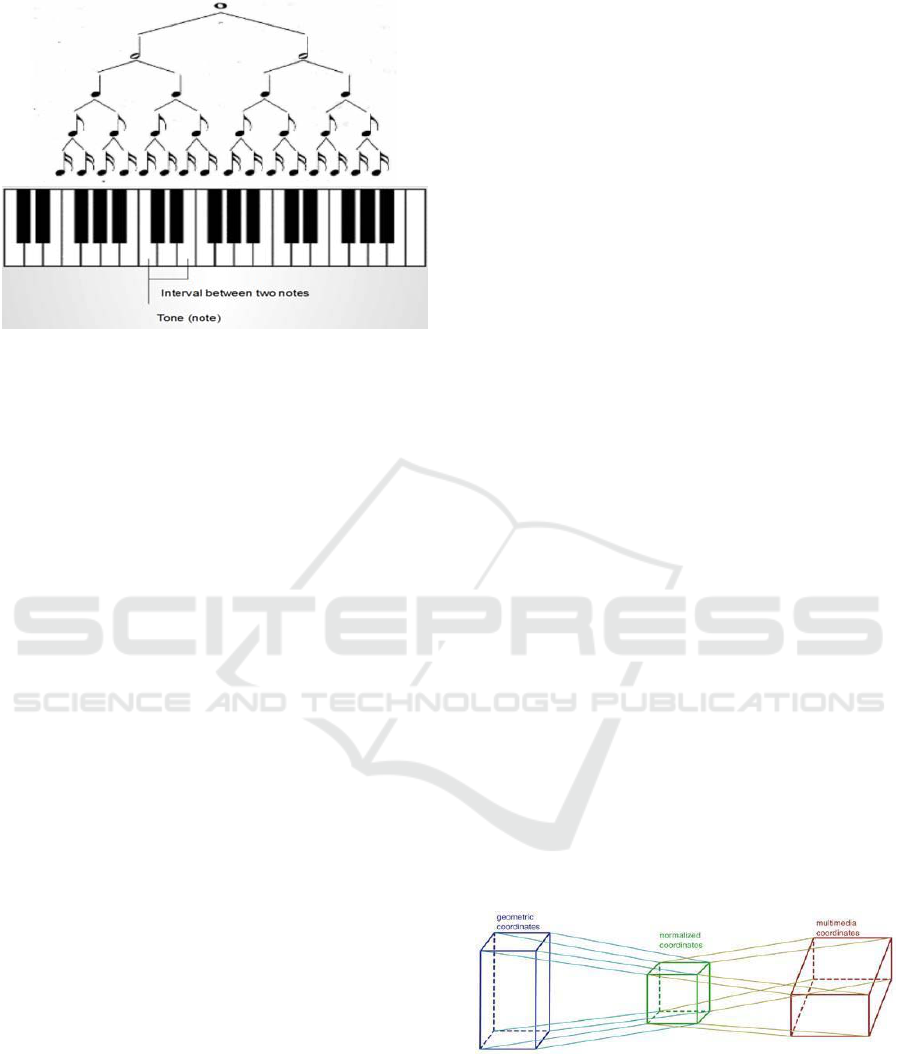
Figure 2: (Top) Aurally measuring the interval between two
notes and determine the tone (note itself). For this a musical
scale used in a musical composition should be defined first
of all (minor, major, based on C,D,F note and etc.).
(Bottom) Measuring the note duration. The basic rhythm
parameters in a musical composition should be defined first
of all.
The definition of the corresponding sound
mappings that can be concretely analyzed and easily
interpreted by researchers is also a question that
should be studied. Here, we suggest that a researcher
should be trained to interpret some not quite evident
sound mappings similar to musicians training their
ears for further music analysis. In our work, we take
advantage of musicians’ approach adopting well-
known concepts of music analysis and writing used
by musicians from simple properties of sound
analysis (pitch, volume, duration, etc.) to “music”
properties analysis (tone, interval between tones,
etc.). These concepts are taken as the base of sound
mapping and accordingly of sound analysis.
4 MAPPINGS VIA MULTIMEDIA
COORDINATES
To obtain a multisensory representation we need to
create a spatial scene, which is an assembly of spatial
objects with their geometric, optical, audio and others
properties. Then the corresponding visual, audio and
other stimuli can be generated using some specialized
mapping and rendering procedures for further
multisensory analysis.
Although some efforts have been made on the
development of data perceptualization, a formal
framework for establishing correspondences between
data and multiple sensory stimuli has not been yet
proposed. We believe that the concept of multimedia
coordinates introduced previously in (Adzhiev, 1999)
and applied in multidimensional shape modeling can
be a good framework for formalization of mapping
from a multidimensional geometric model to a
multimedia object. This object can be treated as a
multidimensional object with Cartesian, visual,
audio, haptic and other types of multimedia
coordinates, which represent various sensory stimuli.
A space mapping between geometric coordinates and
multimedia coordinates establishes correspondence
between the multidimensional shape and the
multimedia object. In this way, a correspondence can
be also established between the given scientific data
and a multimedia object, because introducing a
multidimensional geometric model is one of the steps
in the visualization pipeline presented previously.
Fig. 2 presents some musical (sound)
characteristics that musicians can distinguish
auditory and describe quantitatively: tone, note
duration, interval between two notes are most often
used ones. In this article we deal with a particular type
of musical hearing called harmonical hearing that is
believed to be developed practically by everyone after
some musical training (Zavadska, 2015).
From our point of view, a camera, a sound
receiver, a haptic cursor and other similar elements
need to be explicitly placed in the spatial scene as
spatial models of the human organs of perception.
Thus, a spatial scene includes spatial objects
representing data as well as other spatial objects
representing their influence on human senses.
Rendering of the spatial scene generates information
for output devices provided for consideration by
humans, namely a screen, speakers, a haptic device
and others. In this article we are going to go further
and propose some theoretical generalizations about
solving data analysis problem of complex
multidimensional data by multisensory visual-
auditory analytics.
Figure 3: Mapping of geometric coordinates to multimedia
coordinates.
To operate with multimedia coordinates, one can
introduce a system of normalized numerical
coordinates (a unit cube) and its one-to-one
correspondence to the multimedia space. By selecting
a real normalized value, one can use the
Multisensory Analytics: Case of Visual-auditory Analysis of Scalar Fields
325

corresponding value of the multimedia coordinate
(Fig. 3).
Each geometric coordinate variable takes values
within a given interval. On the other hand,
multimedia coordinates also have their own variation
intervals. For example, a time interval means life time
of the multimedia object, color varies inside the color
space (RGB cube) and so on. To define the mapping,
one has to establish a correspondence between these
intervals through the normalized numerical
coordinates.
There are some special ways of dealing with the
above mappings. By assigning a finite set of constant
values for some geometric coordinate, one can first
reduce the dimensionality of the introduced
geometric model before establishing some mapping
to multimedia coordinates.
Generally methods and approaches that aim at
visual analysis of geometrical objects representing
multidimensional data are called multidimensional
visualization methods (Wong, 1997). These
techniques usually suppose not only reducing
dimensionality through application of specific
geometric operations, but mapping data to different
photometric characteristics (color, transparency), and
include interactive techniques as well. Most well-
known of these techniques are covered by different
types of multimedia coordinates, introduces in
(Adzhiev, 1999), among them are:
Dynamic coordinates represent continuous
coordinates that can be mapped onto physical
time
Spreadsheet coordinates take discrete values
in the given bounding box.
Photometric coordinates include color,
transparency, texture and other parameters of
visual appearance of the multimedia object.
Another type of multimedia coordinates,
mentioned previously is audio. In this paper, we
propose some generalizations on the basis of
multimedia coordinates approach for the specific type
of multidimensional data multisensory analysis,
namely of scalar fields, bringing together some most
well-known interactive, photometric and geometrical
techniques and demonstrating how they can be
extended by other multisensory techniques involving
sound.
5 MULTISENSORY ANALYSIS
OF SCALAR FIELDS
On the basis of the proposed approach to multi-
sensory analytics, let us describe the process for
solving high dimensional data analysis problem
involving hybrid visual-auditory representations. The
data analysis problem can be formulated as follows:
Given - numerical data D describing the object
under consideration;
Required - to obtain an insight I of interest to the
researcher regarding the initial object.
Let us consider the solution of the above stated
problem by reducing this problem to the following
two problems solved one after another:
1) the problem of obtaining a multisensory
representation (SS in Fig. 1) of considered data in the
hybrid visual-auditory form;
2) the problem of human sensory analysis and
interpretation of the results of the analysis with
respect to the original description.
Note that we will deal here only with the upper
path in the diagram in Fig. 1 from the initial data to
sensory stimuli, leaving the hypothesis H
formulation, visualization and analysis out of the
discussion.
It should be noted that initial data may be
multidimensional and very complex. From our
experience of research in nuclear physics, chemistry
and other disciplines, it is very often the case that the
initial data can be presented as a set of real functions
of several variables
f1(x1,x2,...xk) , f2(x1,x2,...xk) , ... fn(x1,x2,...xk)
or scalar fields in an abstract k-dimensional space
describing different characteristics of a complex
object under investigation. When the initial data is
given in the form of discrete samples, it still can be
presented in the above form by applying appropriate
interpolation procedures.
There are two alternative ways to introduce a
multidimensional geometric interpretation (set G in
Fig. 1) of such a data. One is quite straightforward as
each of the above set of real functions can be
considered as a definition of a k-dimensional surface
in a k+n-dimensional space. However, this
interpretation can turn too abstract for the further
multisensory perception and analysis. Alternatively,
all the given data functions can be presented in the
form of a vector function
f = (f1, ..., fn),
which then can be interpreted as an FRep
constructive hypervolume model (Pasko, 2001)
mentioned earlier. This means the function f1 is
describing some multidimensional geometric object
and all other components of the vector-function
represent the attributes associated with this
IVAPP 2017 - International Conference on Information Visualization Theory and Applications
326

multidimensional geometric shape.
The latter geometric interpretation can effectively
be used for constructing a spatial scene description
that can be used by rendering procedures. If the
number of independent variables xi k 3, we first
need to assign constant values to some of the
variables to reduce the space dimensionality to 2D or
3D. Then, we can assign one or several values to f1,
which means applying geometric cross-sections and
projections to obtain 2D or 3D geometric objects
(isolines or isosurfaces correspondingly) for the
spatial scene. The attribute functions f2, ..., fn defined
on the obtained geometry can represent various object
properties such as material, color, emitted sound,
rigidity and others that can be directly mapped to
sensory stimuli. Rendering of the spatial scene
generates several sensory stimuli as outputs. This
process will be illustrated in more detail by the case
study below.
6 CASE STUDY OF VISUAL-
AUDITORY DISPLAY OF
SCALAR FIELDS
Figure 4: Effective multisensory analysis pipeline.
Let us illustrate the process of the multisensory
analysis with a certain class problems, where given
data represent various scalar fields. We will involve
both visual and auditory stimuli in the analysis
process. The effective multisensory analysis pipeline
for this case study is shown in Fig. 4.
Problem statement
The objects under study are an electron density field
and an electrostatic potential field of CNH molecule.
These two scalar fields are used to be analyzed
together.
Given
The mathematical model consists of the values of two
real functions of three variables f1(x,y,z) and f2
(x,y,z), where (x,y,z) are coordinates of points in
space. The fields are given in the tabular form at the
nodes of a rectangular regular grid in the function's
domain
Required
To analyze variations of the functions depending on
changes of independent variables x,y,z.
Geometric model
Let us introduce two interpolation functions
Y1(x,y,z) and Y2(x,y,z) corresponding to the initial
tabulated functions. The geometric interpretation of
the functions Y1 and Y2 are the hypersurfaces G14
and G24 in the Euclidean subspace E4 with
coordinates (x, y, z, γ), where γ is a function
coordinate. To facilitate further multisensory
analysis, we introduce the following additional
attribute functions:
1) A1=a1(x,y,z) that will correlate with Y1
function values and will correspond to some visual
attribute values. This function defines a hypersurface
A14 in the attribute subspace (x,y,z,a1).
2) A2=a2(x,y,z) that will correspond to some
auditory attribute and will correlate with Y1 function
value.
3) A3=a3(x,y,z) that will correspond to some
auditory attribute and will correlate with Y2 function
value.
4) A4=a4(x,y,z) that will correlate with Y2
function values and will correspond to some visual
attribute values.
Here the vector-function (Y, A1, A2, A3, A4) can
be considered a constructive hypervolume model
with each of its components representing a 4D
hypersurface in 8-dimensional space with coordinates
(x, y, z, γ, a1, a2, a3, a4).
Spatial scene
The hypersurface G14 can be put into correspondence
with a collection of isosurfaces Cj in the space E3 by
selecting level values cj for the function Y1. We
choose a color scale of selected isosurfaces and thus
define the range for the A4 function values and map
points (xi,yi,zi) on each isosurface cj to
corresponding values Y2(xi,yi,zi) and assign the
corresponding color. We also map each value Y1 = cj
to transparency according to the value of A1 function
within the selected transparency scale. The sound
model includes an introduced point sound source to
be used in sound rendering. The location of the sound
source (xs, ys, zs) within the spatial scene defines the
selected point in space and the sound frequency w of
the generated sound is defined by the function A2
value at this point. We define the sound frequency as
w =k1*a2 (xs, ys, zs), where k is a scalar coefficient.
Also the sound volume as v=k2*a3 (xs, ys, zs) is
defined by the function A3 and thus we generate
complex sound with these two characteristics, pitch
and volume, analyzed simultaneously.
Thus we form the geometrical, optical and sound
models. Schematically the mapping of 4D
hypersurfaces in 8-dimensional space with
Multisensory Analytics: Case of Visual-auditory Analysis of Scalar Fields
327
coordinates (x, y, z, γ, a1, a2, a3, a4) into
corresponding multimedia coordinates will look like:
{x,y,z} world coordinates “x”,“y”,“z”
{a1,a4} photometric coordinates of
“transparency” and “color”
{a2,a3} audio coordinates of “sound frequency”
and “sound volume”.
Rendering and analysis
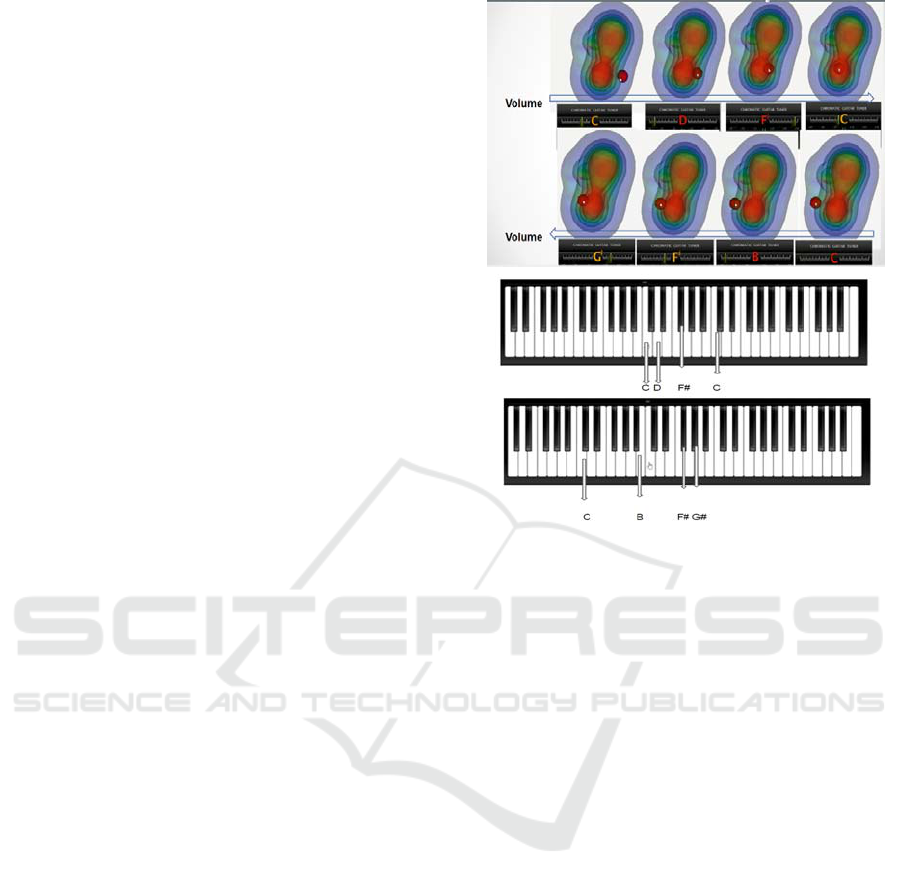
The results of the visual and auditory rendering of the
spatial scene are as follows (illustrated by Fig. 3):
- a graphical image of projections of semi-
transparent colored isosurfaces on a graphical
terminal;
- the point sound source represented by the red
sphere with the sound source located in its center. Its
location is specified interactively by the user;
- a sound wave generated by a sound terminal with
the frequency corresponding to the location of the
point sound source and perceived by the user as a
specific sound tone. Here, according to the
multimedia coordinates concept a “musical tone
scale” was defined. In this case we consider a simple
2-octave interval in Cmajor gamma to be such a scale.
These intervals and notes may be presented with a
piano. Quite often, when musicians aurally analyze a
musical composition, they determine note places on
the piano keyboard before writing corresponding
musical sheets. Here we will take the representation
of notes on the piano as our musical scale graphical
representation.
Each sound tone generated at the location of the
point source is defined on the musical Cmajor scale
(Fig.5). Here we receive the following tones
presented in Fig 5(top) and can graphically present
their place on musical scale Fig.5 (bottom). A basic
guitar tuner was also used to illustrate the current note
value (Fig.5 top). However, a well-trained musical
ear can distinguish intervals between these notes and
determine the current note itself and its place on the
piano musical scale. This allows for drawing
conclusions about of quantitative parameters of the
scalar field current value (according to the mapping
from the field value to an according tone) and then
change the value (according to the mapping from the
change in the field value to the interval).
Taking into consideration the presented multisensory
analytics concepts and the specific pipeline in Fig. 4,
we have developed an algorithm for visual-auditory
display of a scalar field. This algorithm has been
implemented as an application program in C++ using
3ds Max and OpenAL (OpenAL, 2016) as the
instrumental tools. The results of the visual and
auditory rendering of the spatial scene are illustrated
by Fig. 5.
Figure 5: Exploration of two scalar fields dependency and
change with pitch and volume. (Top) Here we use an
interactive “sphere” widget to define sound
frequency w and volume v of the generated sound defined
by the functions A2 and A3 values at fixed values of world
coordinates x,y,z. (Bottom) Presentation of according notes
on Cmajor scale (2 octaves) on piano. A researcher with
well-trained musical ear and appropriate “auditory tuning”
on Cmajor scale can easily aurally determine these notes
and their place on piano musical scale and judge about how
quantitatively sound was changed.
7 CONCLUSIONS
This paper deals with the emerging area of
multisensory analytics involving human senses
besides vision, namely hearing, sense of touch and
others in the process of data analysis. We proposed an
interpretation of the multisensory analytics process as
a set of mappings starting with the initial data sets and
leading to some insight regarding this data. The key
steps of the process are introduction of
multidimensional geometric model of data, creation
of a spatial scene with lower dimensional geometric
models augmented by optical, sound and other
models related to the human senses, and rendering of
this spatial scene with the generation of visual,
auditory, tactile and other sensory stimuli for further
analysis.
The formalization of the mapping between the
multidimensional geometric models and the spatial
IVAPP 2017 - International Conference on Information Visualization Theory and Applications
328

scene available for rendering multiple sensory stimuli
is the next research question to address. We have
shown a possible solution in the case of the initial data
represented by scalar fields (real functions of several
variables) and illustrated this by a case study of the
scalar field analysis using interactive visual-auditory
display. This specific approach of using vector
function gives researchers an opportunity to operate
with high-level abstraction, namely create their own
functional dependencies and use various
mathematical operations. They can introduce new
functions and their superpositions and thus build
geometric, optical and other components of the
spatial scene for further rendering and analysis.
In the more general case of input data, the
mapping to sensory stimuli can be more complex and
non-linear. We are planning to further develop the
concept of multimedia coordinates (Adzhiev, 1999)
as a way to establish more complex correspondences
between initial data, the introduced multidimensional
geometric models and multiple sensory stimuli.
REFERENCES
Wong, P. C., Thomas J., 2004. Visual analytics, IEEE
Computer Graphics and Applications, vol. 24, No. 5,
pp. 20–21.
Keim, D., Mansmann, F., Schneidewind, J., Thomas, J.,
Ziegler, H., 2008. Visual analytics: scope and
challenges, Visual Data Mining, Lecture Notes in
Computer Science, volume 4404, Springer, pp 76-90.
Foley, J., Ribarsky, B., 1994. Next-generation data
visualization tools, in Scientific Visualization,
Advances and Challenges, L. Rosenblum et al. (Eds.),
Academic Press.
McCormick, B., DeFanti, T., Brown, M. (Eds.), 1987.
Visualization in Scientific Computing, Computer
Graphics, vol. 21, No. 6.
Pilyugin, V., Malikova, E., Adzhiev, V., Pasko, A., 2013.
Some theoretical issues of scientific visualization as a
method of data analysis, Transactions on
Computational Science XIX, Lecture Notes in
Computer Science, vol. 7870, Springer-Verlag, pp.
131–142.
Yeung, E., 1980. Pattern Recognition by Audio
Representation of Multivariate Analytical
Data, Analytical Chemistry, vol. 52, No.7, pp. 1120–
1123.
Bly, S., 1982. Presenting information in sound,
Proceedings of the CHI '82 Conference on Human
Factors in Computer Systems, ACM, pp. 371-375.
Kaper, H., Wiebel, E., Tipei, S., 1999. Data Sonification
and Sound Visualization, Computing in science and
Engineering, vol.1, No.4, pp.48-58.
Scaletti, C., Craig, A.B., 1991. Using Sound to Extract
Meaning from Complex Data, In Proceedings SPIE,
1459, pp. 207–219.
Mezrich, J. J., Frysinger, S., Slivjanovski, R., 1984.
Dynamic representation of multivariate. Time Series
data, Journal of the American Statistical Association,
Vol. 79, N. 385. pp. 34–40.
Lodha Suresh, K., Beahan, J., Heppe, T. and etc., 1997.
MUSE: A Musical Data Sonification Toolkit, In
Proceedings of International Conference on Auditory
Display (ICAD), pp. 36–40.
Grinstein, G., Smith S., 1990. Perceptualization of
scientific data, Proc. SPIE 1259, Extracting Meaning
from Complex Data: Processing, Display, Interaction,
pp. 190-199.
Ebert, D., 2004. Extending Visualization to
Perceptualization: the Importance of Perception in
Effective Communication of Information, in The
Visualization Handbook, C. Hansen and C. Johnson
(Eds.), Academic Press, pp. 771-780.
Ogi, T., Hirose M., 1996. Multisensory Data Sensualization
based on Human Perception, VRAIS '96 Proceedings of
the 1996 Virtual Reality Annual International
Symposium, pp. 66-71.
Jovanov, E., Starcevic, D., Radivojevic, V., Samardzic, A.,
Simeunovic, V., 1999. Perceptualization of Biomedical
Data. An Experimental Environment for Visualization
and Sonification of Brain Electrical activity, IEEE
Engineering in Medicine and Biology Magazine,
vol. 18, No. 1, pp. 50–55.
Maciejewski, R., Choi, S., Ebert, D., Tan, H., 2005. Multi-
Modal Perceptualization of Volumetric Data and its
Application to Molecular Docking, WHC '05
Proceedings of the First Joint Eurohaptics Conference
and Symposium on Haptic Interfaces for Virtual
Environment and Teleoperator Systems, pp. 511-514.
Adzhiev, V., Ossipov, A., Pasko, A., 1999.
Multidimensional shape modeling in multimedia
Applications, in MultiMedia Modeling: Modeling
Multimedia Information and Systems, ed. A.Karmouch,
World Scientific, pp. 39-60.
Pasko, A., Adzhiev, V., Sourin, A., Savchenko, V., 1995.
Function Representation in Geometric Modeling:
Concepts, Implementation and Applications, The Visual
Computer, vol.11, No.8, pp.429-446.
Pasko, A., Adzhiev, V., Schmitt, B., Schlick, C., 2001.
Constructive Hypervolume Modeling, Graphical
Models, vol. 63, No. 6, pp. 413-442.
Zavadska, G., Davidova, J., 2015. The Development of
Prospective Music Teachers’ Harmonic Hearing at
Higher Education Establishments, Pedagogika /
Pedagogy Vol. 117, No. 1, pp. 72–85, Lietovus
Edukologijos Universitetas, Lituania.
Wong, P.C., Bergeron, R.D., 1997. 30 Years of
Multidimensional Multivariate Visualization,
Proceeding Scientific Visualization, Overviews,
Methodologies, and Techniques, EEE Computer
Society Washington, DC, USA, pp. 3-33.
OpenAL, 2016. Programmers Guide. Available at:
http://connect.creativelabs.com/openal/Documentation
/OpenAL_Programmers_Guide.pdf
Multisensory Analytics: Case of Visual-auditory Analysis of Scalar Fields
329
