
Analysis of Impedance Spectroscopy Measurements of Biological
Tissue using the Distribution of Relaxation Times Method
Roberto Giovanni Ramírez-Chavarría
1,2
, Celia Sánchez-Pérez
1
and Daniel Matatagui
1
1
Centro de Ciencias Aplicadas y Desarrollo Tecnológico, Universidad Nacional Autónoma de Mexico,
AP 10-186, 04510, CD MX, Mexico
2
Facultad de Ingeniería, Universidad Nacional Autónoma de México, 04510, CD MX, Mexico
Keywords: Biological Tissue, Electrical Impedance Spectroscopy, Distribution of Relaxation Times Method.
Abstract: This work proposes a method for analysing electrical impedance spectroscopy (EIS) measurements of
biological tissue in the range of 100 Hz to 1 MHz by means of the distribution of relaxation times (DRT) to
evaluate and study the different relaxation time constant involved in electrical response. We numerically
analyse different configurations of RC circuits and compare the electrical response in time domain by DRT
with that of classical EIS representation in frequency domain as Bode plots. Experimental validation of the
technique using RC circuits, gives an error of less than 1% for the EIS measurement system with respect to
theoretical calculation. We present preliminary measurements for WISTAR rat tissue samples of spleen, lung
and kidney fixed in formaldehyde solution at 3.8% founding a more detailed occurrence of relaxation
mechanism that could provide useful information about the structure and composition of biological tissues in
a more precise way.
1 INTRODUCTION
Electrical impedance spectroscopy (EIS) has been
widely used to characterize the electrical response of
a material by a transfer function that contents
information in terms of its electrical properties and
mechanisms involved on electrical conduction and
polarization. Several EIS techniques can be found in
literature for several applications. It has been used in
electrochemistry (Barsoukov and Macdonald, 2005)
or state of charge in batteries (Osaka, et al., 2012). In
biomedical applications different EIS techniques has
been developed for the characterization of biological
samples as: bone tissue (Ciuchi, et al., 2010), liver
tissue in the cases of steatosis disease (Parramon, et
al., 2007) and in liver samples of patients with
colorectal cancer (Prakash, et al., 2015), as well as
gastric tissue for cancer study (Keshtkar, et al., 2012).
In these works, 1 Hz to 1 MHz frequency range
for measurements is used because it has been
demonstrated that ionic transport of species and
polarization of most of the biological tissues occurs at
this spectral range for the well-known and tissue
dispersions (Martinsen, et al, 2002).
Impedance is represented by a complex quantity
′′, that is a function of the angular
frequency. The real part (
) represents the
resistance, while the imaginary component (
′)
represents the reactance. If an oscillating electric
current is applied to the material under study
one can measure the corresponding voltage drop
thus the complex impedance is calculated as:
/
(1)
Commonly, experimental impedance data are
fitted at some specific frequencies based on classical
EIS models in terms of equivalent electric circuits
such as Debye and Cole-Cole (Barsoukov and
Macdonald, 2005). Nevertheless, these
methodologies need the a priori knowledge of some
material properties. Alternatively, the distribution of
relaxation time (DRT) method has been used for
impedance data interpretation (Dion & Lasia, 1999),
commonly used in electrochemistry (Saccoccio, et
al., 2014). Its main goal is to identify relaxation times
from EIS measurements, and as a result, a time scale
representation of the complex impedance, can be
obtained.
EIS measurements for biological tissue can give
out information about its structure and composition,
224
Ramà rez-Chavarrà a R., Sà ˛anchez-PÃl’rez C. and Matatagui D.
Analysis of Impedance Spectroscopy Measurements of Biological Tissue using the Distribution of Relaxation Times Method.
DOI: 10.5220/0006253902240228
In Proceedings of the 10th International Joint Conference on Biomedical Engineer ing Systems and Technologies (BIOSTEC 2017), pages 224-228
ISBN: 978-989-758-216-5
Copyright
c
2017 by SCITEPRESS – Science and Technology Publications, Lda. All rights reserved

nevertheless, data interpretation represents a
challenge because of the inhomogeneous nature of the
tissue, thus several relaxation mechanisms are
involved. In this work, we propose the application of
DRT method to better analyze the electrical response
of formaldehyde fixed biological tissues from EIS
measurements in the range of 100 Hz to 1 MHz.
2 THEORETICAL
BACKGROUND
Studying biological tissues over a broad frequency
range can contain information about their electrical
properties revealing their physiology. As discussed in
(Martinsen, et al., 2002) a biological tissue can be
represented in terms of an equivalent electrical
circuit, consisting of an electrode-tissue contact
resistance
in series with a parallel resistive-
capacitive representation of a cell, where the
extracellular material acts as a resistor (R) and the
cellular membrane as a capacitor (C). The
inhomogeneity nature of a tissue implies a number
of such RC circuits connected together in series as
represented in Figure 1. Thus, according to these
electrical behaviour, multiple relaxation times
appears, each one associated to the
circuit, or
material.
Figure 1: Equivalent electric circuit for a biological tissue.
In circuit theory, a circuit is described in terms
of the transfer function
,according to,
1
1
(2)
where , represents the constant time of the
circuit. So, the physical relaxation time can be related
with the constant time of the equivalent circuit
associated to a certain material. The characteristic
frequency of this circuit
1/2, represents a
maximum of the reactance′′ on a Bode plot.
2.1 DRT Method
Experimentally, if the frequency related impedance
data are measured on a logarithmic scale
(Macutkevic, et al., 2004), the equivalent impedance
of the circuit shown in Figure 1 is,
ln
1
ln
(3)
where the term
ln
is a distribution function that
joins up the relaxation times. Using a regularized
regression approach (Tikhonov, et al., 1995),
ln
can be described as a sum of Dirac distributions
ln at relaxation times (Saccoccio, et al.,
2014), under these assumptions a discretized form of
is given by:
ln
lnln
(4)
with
being the
amplitude of the Dirac function
at its correspondent
. Eq. (4) is physically
equivalent to having circuits. Combining Eq. (3)
and Eq. (4), the impedance DRT model (Winterhalter,
et al.,1999) is,
lnln
1
ln
(5)
where
and
can be extracted by multiplying
by the complex conjugate
∗
.
DRT is estimated by fitting
against
involving the minimization of:
(6)
in order to obtain the vector , this last used to
compute the value of
ln
in Eq. (4).
In this work, DRT algorithm was implanted on an
open source software with special optimization and
robust mathematics functions. As a final result DRT
analysis is given in terms of the distribution function
in a time scale plot.
For DRT validation, we simulate three parallel
generalized circuits separately, including a
resistor
200 Ω for each one. Next, these three
circuits were placed together in series. We performed
EIS and DRT analysis for the simulated circuits. In
Table 1, we summarize the R and C values used for
each circuit and their corresponding theoretical
calculation for relaxation time and characteristic
frequency.
Table 1: Data for simulated RC circuits.
Circuit
Ω
nF μs
(kHz)
200.0 48.0 9.6 17.0
100.0 1000.0 100.0 1.6
56.0 22.0 1.2 130.0
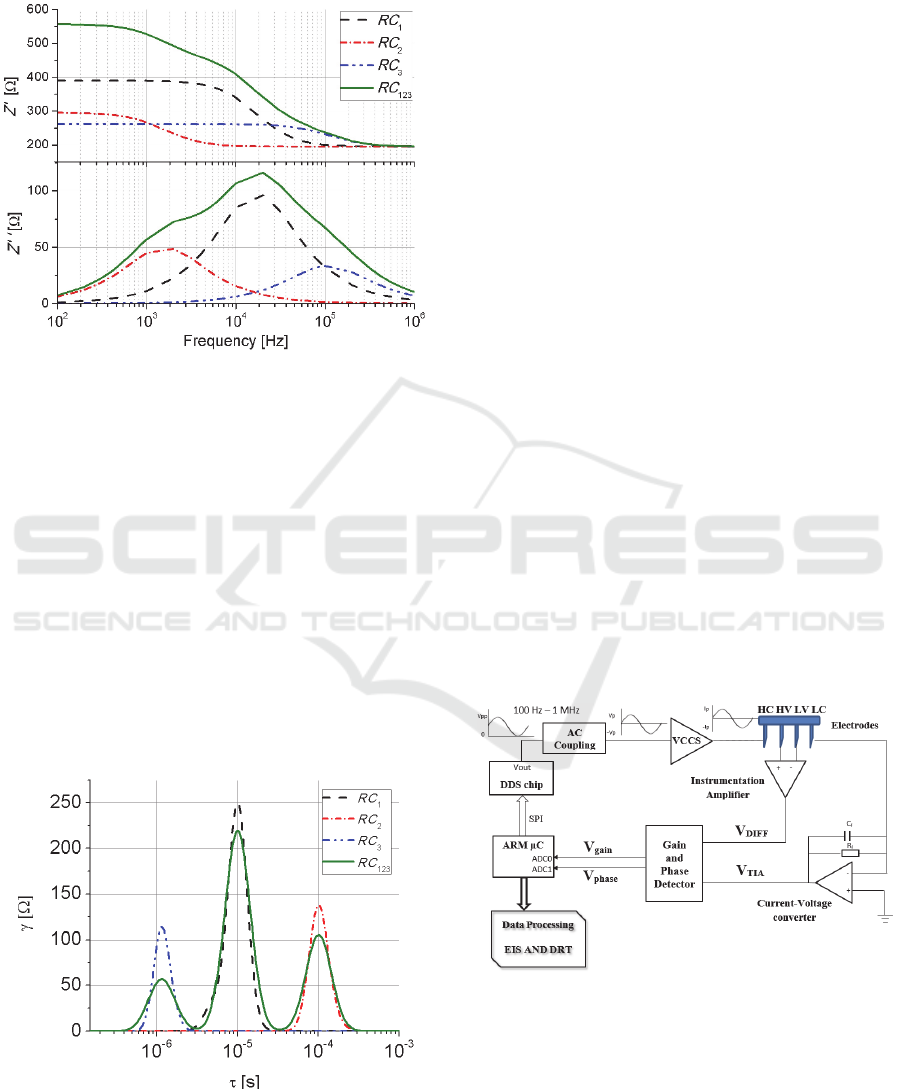
For cases on Table 1, Bode plots for the calculated
values of
and ′′ are shown in Figure 2. Also we
Analysis of Impedance Spectroscopy Measurements of Biological Tissue using the Distribution of Relaxation Times Method
225
consider the case when the three circuits are
connected together in series
.
Figure 2: Bode diagram for
and ′′for the simulated
circuits described on Table 1 and the three circuits
placed in series.
One can see that values of
are modified as the
RC elements are different for each circuit and also the
inflection point changes corresponding to the
frequency (
) at which
′ has it maximum value.
The
has a maximum for
′ at
17.0 kHz
that relates to that of circuit RC
1.
Nevertheless, one
can expect three values for
, but Bode plot
representation does not clearly permit to identify all
of them.
We utilize the DRT method described above to
process EIS data on Figure 2. The distribution
function of relaxation times is plotted (Figure 3) as
a function of the constant time for the circuits RC
1
,
RC
2
, RC
3
, and RC
123
.
Figure 3: DRT plot as a function of for the circuits
described on Table 1 and the three circuits connected in
series.
It can be seen that each maximum is centred at
9.3 µs,
100.2µs and
1.3µs, agreeing
with theoretical parameters on Table1 with a time
scale accuracy less than 5%. Numerical results show
that the time domain DRT analysis gives a more
precise interpretation of EIS data than that done by
frequency domain analysis.
3 MATERIALS AND METHODS
3.1 Animal Tissue Sampling
For tissue samples, a male WISTAR rat, 6 weeks age
and 190-220 g weight, was used. After sacrifice, the
spleen, lung and kidney were collected whole and put
in formaldehyde solution at 3.8% for 72 hours.
3.2 EIS Measurement System
We measure the tissue samples using a compact and
low cost EIS system, designed by our group of work,
capable to perform data processing on line that
usually is not included in classical impedance
analysers or LCR meters.
The EIS system operates with an alternating
current of 400 µA constant amplitude in the range of
100 Hz to 1 MHz for electrical loads from 10 Ω to
10kΩ. Figure 4 shows a scheme of the operation
principle in which a 32-bit microcontroller (ARM
CORTEX M-4) is the central processing unit with an
integrated 16 bit Analog to Digital Converter (ADC)
and DSP core.
Figure 4: Scheme of the operation principle for the EIS
system.
A sinusoidal excitation signal is generated using a
digital direct synthesizer (DDS) chip. Two electronic
processes are used for AC coupling of the input signal
and feeding into a voltage controlled current source
(VCCS) unit. The current is injected to the tissue
BIODEVICES 2017 - 10th International Conference on Biomedical Electronics and Devices
226
sample through the high current (HC) electrode and
measured from low current (LC) electrode by a low-
noise 65 MHz bandwidth transimpedance amplifier
(TIA). The TIA output voltage signal (V
TIA
) is
proportional to the measured current. A differential
voltage (V
DIFF
) at the sample is read out by a wide
band instrumentation amplifier. Then, the signals
V
TIA
and V
DIFF,
are compared in a gain and phase
detector circuit whose outputs are proportional to the
magnitude ratio (
) and phase difference (
).
These two last voltages are digitalized and processed
on line in order to obtain the complex impedance,
where the impedance magnitude
|
|
, in ohms, is
calculated as follows:
|
|
⋅10
(7)
where
510Ω, is the feedback resistor of the TIA
circuit. The phase angle , in degrees, is obtained by:
900mV
10mv/deg.
90deg.
(8)
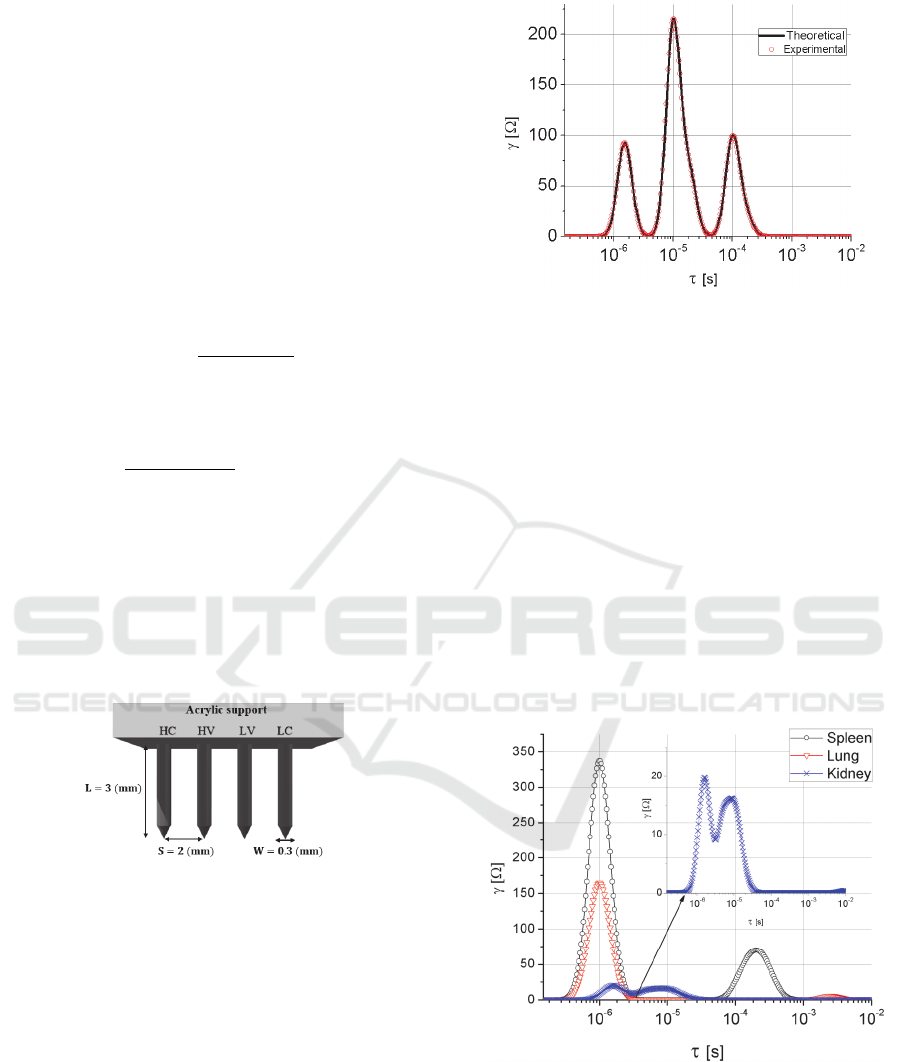
EIS measurements of biological tissue are
performed using four stainless steel needle electrodes,
fixed on an acrylic support as shown in Figure 5.
According to the dimensions of the four electrode
array, the geometric factor (Littwiz, et al., 1990)
obtained is of 4/5. Penetration depth of
electrodes is 3 mm and it is controlled using a vertical
micro positioning stage for accurate measurements.
Figure 5: Schematic of the four electrode array used for the
EIS measurements.
4 EXPERIMENTAL RESULTS
4.1 RC Calibration Circuit
To validate the EIS system, the
circuit was
experimentally constructed and measured exhibing
an acurracy of 1% for both, magnitude and phase.
Once impedance data were collected they were
processed using the DRT algorithm. Figure 6 show
the DRT results including for comparison theoretical
values of Figure 3.
Figure 6: DRT analysis for theoretical and experimental
EIS data for the
circuit.
DRT results exhibit three peaks, corresponding to
each one of the three circuits involved in the
circuit, being
9.2 µs,
100.2 µs and
1.3
µs. It can be seen that DRT for experimental data well
agree with theoretical values, with a maximum error
of 1% among them.
4.2 Biological Tissue Measurements
Electrical impedance measurements were done for
WISTAR rat tissue samples of kidney, lung and
spleen. After EIS was applied to the tissues,
experimental data was collected and then processed
with the DRT algorithm. Experimental results are
presented in Figure 7.
Figure 7: DRT analysis from measured EIS of biological
tissue samples.
From DRT analysis of measured tissues, Figure 7
shows the resultant distributions functions versus the
time scale for each tissue. For kidney, there are two
main peaks, corresponding to the relaxations times,
= 1.61 µs and
=8.29 µs, it is important to notice
Analysis of Impedance Spectroscopy Measurements of Biological Tissue using the Distribution of Relaxation Times Method
227

that both are closely separated in the time scale, as
shown in the inset plot. For the lung tissue, DRT
analysis also exhibits two relaxation processes
centred at
=1.0 µs and
=2.0 ms, where clearly,
the first one is where the distribution function has
more weight and can be taken as the main fingerprint
of the lung. Finally, spleen tissue has two relaxation
times associated,
=1.0 µs and
=0.2 ms, it can be
noted a more weighted distribution around
than
that at
as in the case of lung tissue.
5 CONCLUSIONS
This work proposes an alternative analysis to EIS
measurements, based on DRT method, which gives a
more precise way to found the characteristic electrical
processes involved on a tissue, whose are related with
its structure and composition. Impedance
measurement system exhibits a measurement
accuracy less than 1%, whereas DRT algorithm
shows a maximum temporal error of 5%. We present
preliminary results about distinguishing the
relaxation times associated to different tissue
samples. Due to the high temporal resolution and
accuracy of DRT analysis, it could be applied to
characterize the electrical response of biological
tissues, that can be useful in the study of some
pathologies.
ACKNOWLEDGEMENTS
This research is supported by the grants UNAM-
DGAPA-PAPIIT IT-100515 and IA-103016. R G
Ramírez-Chavarría thanks CEP-UNAM and
CONACYT for his Ph.D. studies grant.
REFERENCES
Barsoukov, E. and Macdonald, J. R., 2005. Impedance
Spectroscopy: Theory, Experiment, and Applications.
John Wiley & Sons. New Jersey, 2
nd
edition.
Ciuchi, I. V., Curecheriu, L. P, Ciomaga, C. E., Sandu A.
V. and Mitoseriu L., 2010. Impedance Spectroscopy
characterization of bone tissues. Journal of Advanced
Research in Physics 1(1), 011007.
Dion, F. and Lasia, A., 1999. The use of regularization
methods in the deconvolution of underlying
distributions in electrochemical processes. Journal of
Electroanalytical Chemistry 475, pp. 28-37.
Keshtkar, A., Slehnia, Z., Somi, M. H. and Eftekharsadat,
A. T., 2012. Some early results related to electrical
impedance of normal and abnormal gastric tissue.
Physica Medica 29, pp. 19-24.
Littwiz, C., Rghab, T. and Gaddes, L., 1990. Cell constant
of the tetrapolar conductivity cell. Medicine & Biology
Engineering & Computing 28, pp. 587-590.
Macutkevic, J., Banys, J., and Matulis, A., 2004.
Determination of the distribution of relaxation times
from dielectric spectra. Nonlinear Analysis 9, pp. 75-
84.
Martinsen, O. G., Grimnes, S. and Schawn, H. P., 2002.
Interface phenomena and dielectric properties of
biological tissue. Encyclopedia of Surface and Colloid
Science, pp. 2643-2652.
Osaka, T., Momma, T., Mukoyama, D. and Nara, H., 2012.
Proposal of novel equivalent circuit for electrochemical
impedance analysis of commercially available lithium
ion battery. Journal of Power Sources 205, pp. 483-
486.
Parramon D., Erill, I., Guimerà A., Ivorra A., Muñoz, A.,
Sola A., Fondevila, C., García-Valdecasas, J. C. and
Villa, R., 2007. In vivo detection of liver steatosis in
rats based on impedance spectroscopy. Physiological
Measurement 28, pp. 813-828.
Prakash S., Karnes M. P., Sequin E. K., West J. D.,
Hitchcock, C. L., Nichols, S. D., Bloomston, M.,
Abdel-Misih, S. R., Schmidt, C. R., Martin Jr, E. W.,
Povoski, S. P. and Subramaniam, V. V., 2015. Ex vivo
electrical impedance measurements on excised hepatic
tissue from human patients with metastatic colorectal
cancer. Physiological Measurement 36, pp. 315-328.
Saccoccio, M., Wan, T., Chen, C. and Ciucci, F., 2014.
Optimal Regularization in Distribution of Relaxation
Times applied to Electrochemical Impedance
Spectroscopy: Ridge and Lasso Regression Methods -
A Theoretical and Experimental Study. Electrochimica
Acta 147, pp. 470-482.
Tikhonov, A., Goncharski, A., Stepanov, V., and Yagola,
A., 1995. Numerical methods for the solution of ill-
posed problems, Kluwer Academic Publishers.
Winterhalter, J., Ebling, D., Maier, D., and Honerkamp, J.,
1999. Analysis of admittance data: Comparison of a
parametric and a nonparametric method. Journal of
Computational Physics 153, pp. 139-159.
BIODEVICES 2017 - 10th International Conference on Biomedical Electronics and Devices
228
