
Measuring Physical Activity of Older Adults
via Smartwatch and Stigmergic Receptive Fields
Antonio L. Alfeo, Mario G. C. A. Cimino and Gigliola Vaglini
Department of Information Engineering, Università di Pisa, largo Lazzarino 1, Pisa, Italy
luca.alfeo@ing.unipi.it, {mario.cimino, gigliola.vaglini}@unipi.it
Keywords: Elderly Monitoring, Smartwatch, Physical Activity, Stigmergy, Neural Receptive Field.
Abstract: Physical activity level (PAL) in older adults can enhance healthy aging, improve functional capacity, and
prevent diseases. It is known that human annotations of PAL can be affected by subjectivity and inaccuracy.
Recently developed smart devices can allow a non-invasive, analytic, and continuous gathering of
physiological signals. We present an innovative computational system fed by signals of heartbeat rate, wrist
motion and pedometer sensed by a smartwatch. More specifically, samples of each signal are aggregated by
functional structures called trails. The trailing process is inspired by stigmergy, an insects’ coordination
mechanism, and is managed by computational units called stigmergic receptive fields (SRFs). SRFs, which
compute the similarity between trails, are arranged in a stigmergic perceptron to detect a collection of
micro-behaviours of the raw signal, called archetypes. A SRF is adaptive to subjects: its structural
parameters are tuned by a differential evolution algorithm. SRFs are used in a multilayer architecture,
providing further levels of processing to realize macro analyses in the application domain. As a result, the
architecture provides a daily PAL, useful to detect behavioural shift indicating initial signs of disease or
deviations in performance. As a proof of concept, the approach has been experimented on three subjects.
1 INTRODUCTION AND
MOTIVATION
Resistance and physiological reserves decrease in
older people, resulting in a risk of adverse health
effects. This state of vulnerability is called frailty
(Fontecha, 2011) and is assessed taking into account
the physical activity level (PAL), among other
factors (Fontecha, 2013). Nowadays, physicians
detect frailty by means of specialized questionnaires
and physical tests performed in dedicated facilities.
However, the number of pre-frail elder people,
which identifies a high risk of progressing to frailty,
is increasing beyond the facilities potential. On the
other hand, human-driven test scores may be
insufficient and inaccurate for detecting physical
habits (Boletsis, 2015), and can be affected by
certain degree of subjectivity (Jansen, 2015).
Today the great availability of general purpose
wearable devices offers a new opportunity for non-
invasive healthcare monitoring. Some watch-like
systems have been already developed to monitor
specific user’s physical activities, exploiting heart
rate and motion signals. Actually, much work has to
be done before such systems can be regularly
managed: the detection of a specific physical activity
usually implies complex techniques, including
machine learning and probabilistic modelling. For a
widespread adoption the system should be highly
flexible, handle uncertainty, and allow a
personalization of what to monitor and how to notice
it. In this paper we propose to use a smartwatch to
detect the physical activity level rather than a
specific physical activity. This approach can provide
enough benefits to warrant widespread adoption. For
this purpose, we studied a suitable computational
architecture with adaptive setting and configuration.
In the proposed architecture, the input samples are
managed by computational units called Stigmergic
Receptive Fields (SRFs), organized into a multilayer
connectionist architecture (Cimino, 2009), and
adapted to contextual behavior by means of the
Differential Evolution algorithm.
The paper is structured as follows. Section 2
discusses the research works dealing with the use of
smartwatch for activity monitoring. In Section 3, an
ontological and architectural view of our system is
presented. Section 4 covers the experimental studies
on three case studies. Finally, Section 5 summarizes
conclusions and future work.
724
Alfeo, A., Cimino, M. and Vaglini, G.
Measuring Physical Activity of Older Adults via Smartwatch and Stigmergic Receptive Fields.
DOI: 10.5220/0006253307240730
In Proceedings of the 6th International Conference on Pattern Recognition Applications and Methods (ICPRAM 2017), pages 724-730
ISBN: 978-989-758-222-6
Copyright
c
2017 by SCITEPRESS – Science and Technology Publications, Lda. All rights reserved

2 RELATED WORK
In the literature, some studies have recently proved
that is possible to distinguish amongst different
human activities, as well as to measure the physical
effort, through wearable device and data-driven
classification techniques (Abbate, 2012).
In (Bonomi, 2010) 30 healthy subjects have been
monitored for 14 days, using: (i) a triaxial
accelerometer for movement registration to calculate
the activity counts per day; (ii) a laboratory
equipment (indirect calorimetry) to calculate the
total energy expenditure in free living conditions;
(iii) a respiration chamber to measure during an
overnight stay the sleeping metabolic rate. The
activity energy expenditure and the physical activity
level are determined from total energy expenditure
and sleeping metabolic rate. A direct linear
association was observed between the activity
counts per day and the physical activity level. A
multiple-linear regression model predicted 76% of
the variance in total energy expenditure, which is a
very high accuracy for predicting free-living energy
expenditure.
Guiry et al. (2014) gathered samples from 10
subjects, each equipped with a smartphone and a
smartwatch, exploiting all available sensors (tri-axial
accelerometer, tri-axial magnetometer, tri-axial
gyroscope, GPS, light and pressure sensors).
Subjects were asked to perform specific physical
activities during three different gathering phases. In
the proposed approach, data samples are first pre-
processed via Principal Component Analysis.
Subsequently, the data set is used to classify the
physical activities, by using five well-known
learning algorithms: C4.5, CART, Naïve Bayes,
Multi-Layer Perceptrons and Support Vector
Machines. Results show that the system correctly
classifies the activities with a percentage of 95%
when using a smartphone and 89% when using a
smartwatch.
Parkka et al. (2007) estimate the intensity of
physical activity attaching accelerometers and
gyroscopes to ankle, wrist and hip. The results are
compared to metabolic equivalent measures obtained
by means of a portable system used for testing
cardiopulmonary exercise. Experiments are made
with 11 subjects carrying out everyday tasks,
including ironing, vacuuming, walking, running, and
cycling on exercise bicycle (ergometer). The authors
have calculated a linear correlation between
accelerometers signals and metabolic equivalent up
to 0.86.
Zhu et al. (2015) estimate physical activities
energy expenditure using wearable devices in
different activities: walking, standing, climbing
upstairs or downstairs. More specifically, a
Convolution Neural Networks is used to
automatically detect important features from data
collected from triaxial accelerometer and heart rate
sensors. The results are compared with the state-of-
the-art of linear regression and artificial neural
networks applied to specific activities, obtaining a
mean square error of 1.12 which is about 35% lower
than existing models.
In this paper we apply two strategies for
improving the state of the art.
a) Computational strategy. The bio-inspired
paradigm of emergent systems (e.g. manifested by
societies of insects) is exploited for spatio-temporal
data granulation. With this paradigm, the single data
sample embodies a domain-agnostic micro-behavior,
interacting with other samples. The principles of
connectionism are also applied to achieve new levels
of abstraction without explicit knowledge encoded
(Barsocchi, 2015). The purpose is to enable the
production of macro-behavior phenomena as an
emergent process of evolution of interconnected
processing units.
b) Application strategy. The purpose is to
generate continuous behavioral data through
general-purpose and non-intrusive devices. To detect
behavioral patterns used in broad-spectrum
assessment: behavior shift to discover initial signs of
disease or deviations in performance.
Thus, the detection of explicit user activities and
diagnosis of specific diseases are not within the
scope of our approach. The next section presents an
ontological view of the approach and a core set of
functionalities.
3 CORE CONCEPTS AND
FUNCTIONAL DESIGN
This section unfolds the core concepts and their
relationships in an ontological view. In Fig. 1 base
concepts are enclosed in grey ovals and connected
by properties (represented as black directed edges),
whereas specialized concepts are enclosed in white
ovals and connected to base concepts by the is-a
property (represented as white directed edge). More
specifically, an older adult performs a physical
activity, which is measured by many behavior
patterns. The older adult wears a smart watch,
which gathers the physiological signals: pedometer,
Measuring Physical Activity of Older Adults via Smartwatch and Stigmergic Receptive Fields
725
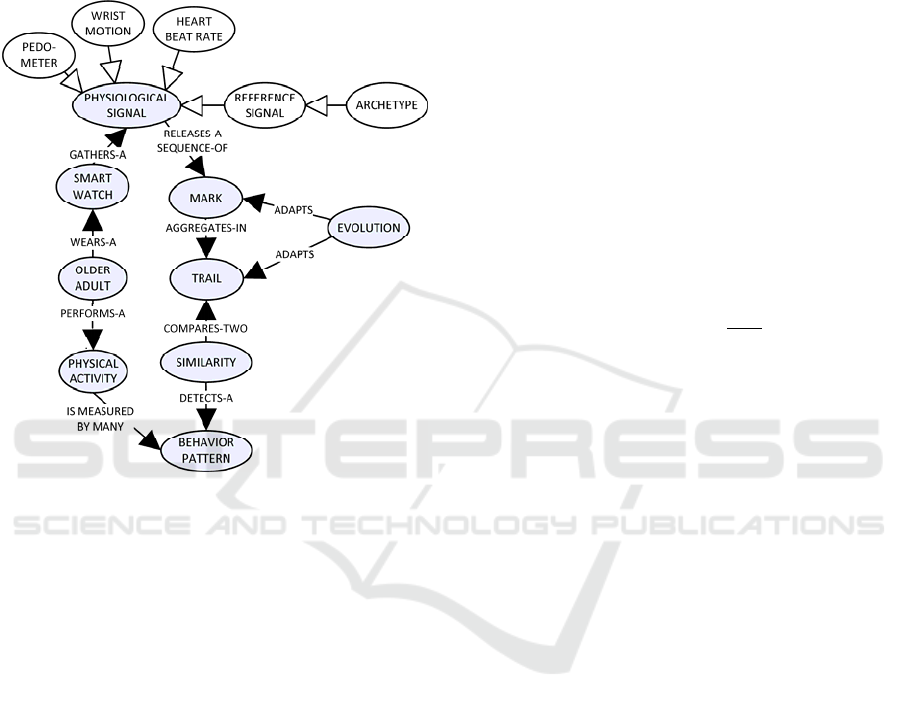
wrist motion, and heartbeat rate. A reference signal
is a specific kind of physiological signal, an
archetype is a special kind of reference signal. A
physiological signal releases a sequence of marks,
which aggregates in trails. Evolution adapts mark
and trail. Similarity compares two trails, and detects
a behavior pattern.
Figure 1: Ontological view of the proposed approach.
More specifically, the behaviour pattern is
detected by a computational unit called Stigmergic
Receptive Field (SRF), shown in Fig. 2. An SRF
periodically takes samples of a type of physiological
signal. A min-max normalization of the continuous-
valued samples is assumed. Normalized samples
d(k) feed the clumping process, which is a kind of
soft discretization of the samples to a set of
parametrized regions of interest. The clumping
process is implemented by a multi-sigmoidal
function, characterized by a couple of inflection
points, i.e.,
I
and
i
, for each region of interest.
After clumping, each sample
d
C
(k) enables the
release of a mark in a computer-simulated spatial
environment. A mark is a trapezoid characterized by
intensity 1, width
and 2
, and position. The
position corresponds to the value of the sample
d
C
(k). Marks M(k) aggregates in the trail T(k), whose
intensity is subject to a temporal evaporation. This
means that a quantity
of T decreases after a step of
time. As a consequence, after a certain time an
isolated mark disappears, whereas consecutive
samples close to a specific region of interest (clump)
will superimpose, increasing the trail intensity. In
practice, the trail can be considered as a short-term
and a short-size action memory.
The Trail captures a coarse spatio-temporal
structure in a segment of the domain space (multi-
step sliding time window), robust to noise and
variability of samples at the micro-level (Avvenuti,
2013). Subsequently, a degree of similarity can be
computed comparing two trails generated with
different sample streams. At the first level of
processing, a segment of the current time series and
a segment of an archetype series are compared by
means of similarity. The similarity between two
trails T
A
and T
B
is the cardinality of the intersection
divided by the cardinality of the union of the trails,
i.e., T
A
T
B
/ T
A
T
B
.
An archetype is a pure form time series which
embodies a behavioural class. An example of class
in our domain is “Variable-High heartbeat”, which
means that the heartbeat shows some sudden
increases of level over time. Other class provided as
a basis of archetypes are Low, Variable-Low,
Medium, Variable-High and High.
After the calculation of similarity, the SRF
carries out the activation, which increases/decreases
the rate of similarity according to a sigmoid with
two inflection points. The term activation is taken
from neural sciences and it is related to the
requirement that a signal must reach a certain level
before a processing layer can fire to the next layer.
Each SRF should be properly parameterized to
enable an effective samples aggregation and output
activation. For example, short-life marks evaporate
too fast, preventing aggregation and pattern
reinforcement, whereas long-life marks cause early
activation.
The Adaptation uses the Differential Evolution
(DE) algorithm to adjust the parameters of the SRF
(Cimino, 2015), in order to minimize the fitness
function, which is computed over a training set of N
signals. More in detail, the DE adapts: (i) the
clumping inflection points
1
,
1
,
2
,
2
; (ii) the
mark width ε (iii); the trail evaporation δ; (iv) the
activation inflection point
A
,
A
. The adopted
fitness function is the mean square error, computed
as difference between desired and actual output
value, evaluated on the training set: =
∑
(
−′
)
/.
In Fig. 2, d
̄
(k) and d(k) are the
data samples of the reference and current signal,
respectively. Both signals periodically feed the SRF,
and are processed in parallel up to the similarity,
where they are compared.
The modules of the reference signal are
represented as grey shadow of the corresponding
ICPRAM 2017 - 6th International Conference on Pattern Recognition Applications and Methods
726
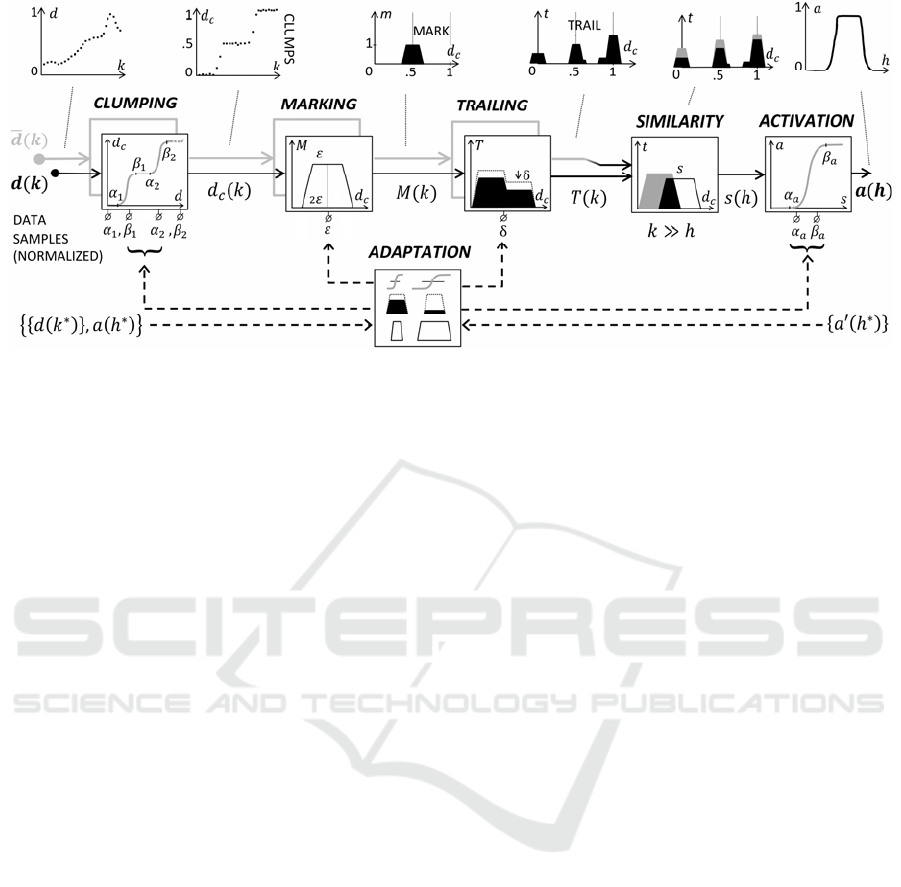
Figure 2: Structure of a Stigmergic Receptive Field.
modules of the current input segment. The training
set, on the bottom, is denoted by asterisks: it is a
sequence of (input, desired output) pairs, represented
on the left. Overall, the SRF plays the micro-pattern
detection.
An SRF can be also used in a multi-layered
architecture, thus providing further levels of
processing to realize a macro analysis. A collection
of SRFs specialized on different archetypes is
arranged into a connectionist topology, making a
Stigmergic Perceptron (Fig. 3). The Stigmergic
Perceptron detects the similarity between an ordered
collection of reference signals and the current input
samples, by forming a linear combination of the
SRFs with the highest similarity, represented as a
circular selector in Fig. 3. The output of each SRF is
calculated as a mean of the outputs (represented as
1-to-5 in Fig.3) weighted by the similarities. Each
Stigmergic Perceptron is dedicated to a kind of
sensor: heart rate, wrist motion and pedometer.
Subsequently, the outputs of the three Stigmergic
Perceptron are fused via a weighted sum, in order to
obtain a combined classification of the effort of each
activity segment. Weight are set up via Linear Least
Square Method, (Hager, 2012) using a training set
made by the multi-sensory input and the expected
effort for each type of physical activity.
Finally, the real value representing the current
activity segment PAL, it is passed to another SRF
aimed to analyze physical activities as a macro-
pattern, i.e., the daily PAL. Again, this SRF
computes a macro-level similarity between two daily
time series: the current and a reference one. An
example of class is a Low PAL Day, in which user
does not perform any intense physical activity.
Similarly, a linear combination of similarities among
each archetype (Low, Medium and High) represents
the daily PAL assessment.
4 EXPERIMENTAL STUDIES
To show the effectiveness of the approach, we
carried out experiments on three subjects, aged 60,
74, 79, who will be referred to as “A”, “B”, and “C”,
respectively. To monitor the PAL of subject A, four
weeks of heart-rate, pedometer and accelerometer
signals have been gathered, via smartwatch. We ask
subject A to keep a diary to annotate begin, end,
type and effort of activities performed during each
day, as well as the perceived daily effort. After an
early visual inspection of the signals, via mouse-
based panning in a computer generated figure, and
of the corresponding diary entries, the sliding
window at the micro-level of pre-processing has
been set to 6 minutes. Moreover, a training set of
signals which clearly match the physical activities of
the diary has been selected.
Since the parameters have a different sensitivity,
the adaptation process of the SRFs is made on a two-
phase protocol: (i) the global training phase,
determining an interval for the evaporation rate of
each SRF, which is the most sensitive parameter;
more specifically, the interval is determined
considering the narrowest interval including the
fitness values above the 90th percentile; (ii) the local
training phase, made for each SRF separately, by
using the interval generated in the first phase; the
intervals for the other parameters can be statically
assigned on the basis of application domain
constraints; the training set for each ith SRF is
made by half signals belonging to the ith archetype,
Measuring Physical Activity of Older Adults via Smartwatch and Stigmergic Receptive Fields
727
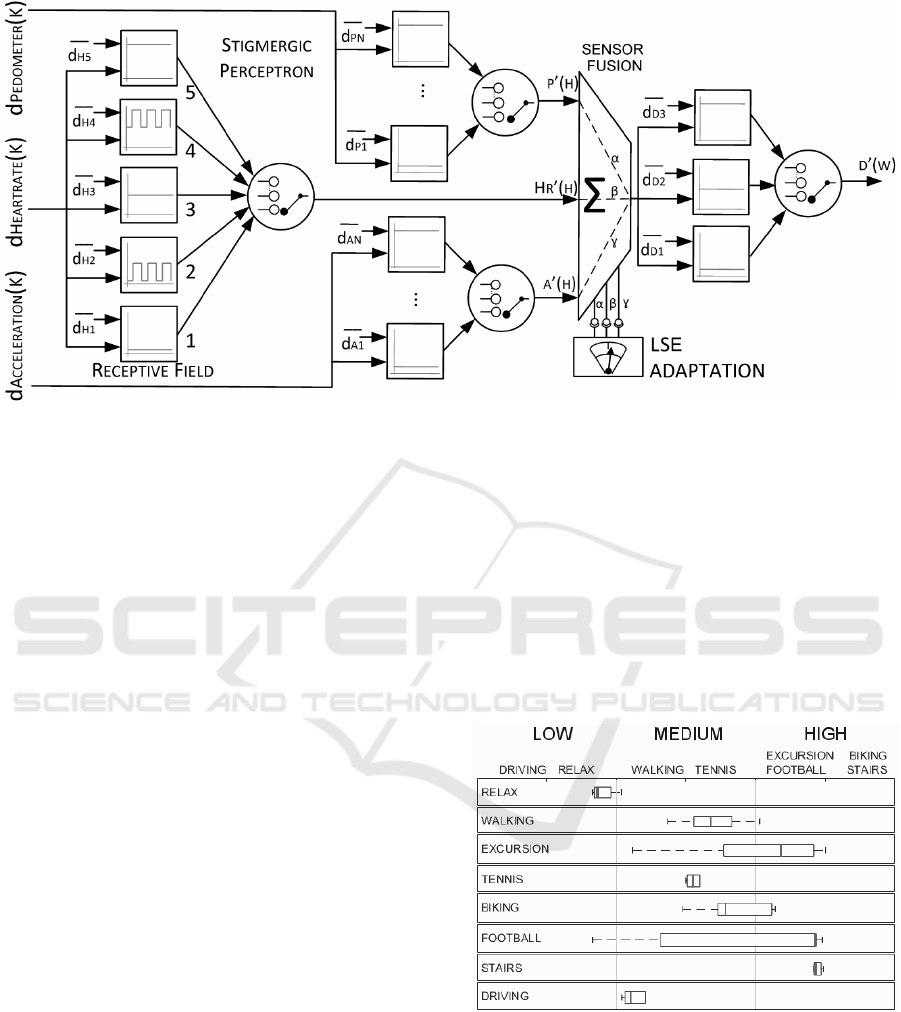
Figure 3: Topology of a multilayer architecture based on Stigmergic Perceptrons.
and half signals belonging to the i-1th and i+1th
archetypes.
As target similarity for the fitness function, the
values 1 and 0 have been used for similarity and
dissimilarity, respectively. As a fitness function, the
Mean Square Error is calculated between the
similarity computed by the system and the target
similarity, for each SRF.
Once the Stigmergic Perceptron have been
trained, their outputs, P'(h), HR'(h), and A'(h) in
figure, are then provided to the sensor fusion
module, which models the mapping from sensor-
driven archetypes to the PAL via a linear
combination. The weights are determined through
the standard Least Square Error optimization, which
minimizes the error with respect to the
corresponding entries in the diary. After the fusion, a
further Stigmergic Perceptron is trained to classify
the PAL according to the following archetypes: Low
(1), Medium (2), and High (3).
Fig. 4 shows a boxplot of the PALs of Subject A.
Here, each input-output pair is calculated over a 6
minute windows, for 165 total windows.
More specifically, Subject A is a healthy and
active 60 years man. He works and practises several
sports. He does not present any frailty symptom, and
is not under drug therapy. His activities data were
been collected through smartwatch for a time period
of 4 weeks of summer 2016. The activities
performed and annotated on the diary spread from
walking to excursion, as reported in Fig. 4. The
output provided by the system as a PAL is a real
number in the interval [1,3], to represent any
combination of the classes Low, Medium, High. In
Fig. 4, each row comprises the samples related to a
specific activity; each column represents a different
PAL. On the top of each column, the activities with
the expected PAL are also included. In practice, any
activity involves a different life cycle with more or
less different PALs (e.g. a recover process). In each
row, the left and right side of the box represent the
first and third quartiles of the distribution, the band
inside the box is the second quartile (the median),
while the ends of the whiskers represent the
maximum and minimum of the distribution.
Figure 4: Physical Activity Levels of the Subject A over
four weeks.
Overall, the fitting between the expected and the
calculated PALs for subject A is good: the Mean
Square Deviation over 165 time windows is 0.326.
Indeed, we remark that relax, walking, virtual tennis,
and stairs activities are mostly included in the
expected class. Not surprisingly, excursion and five-
a-side football are partially spread on the adjacent
ICPRAM 2017 - 6th International Conference on Pattern Recognition Applications and Methods
728
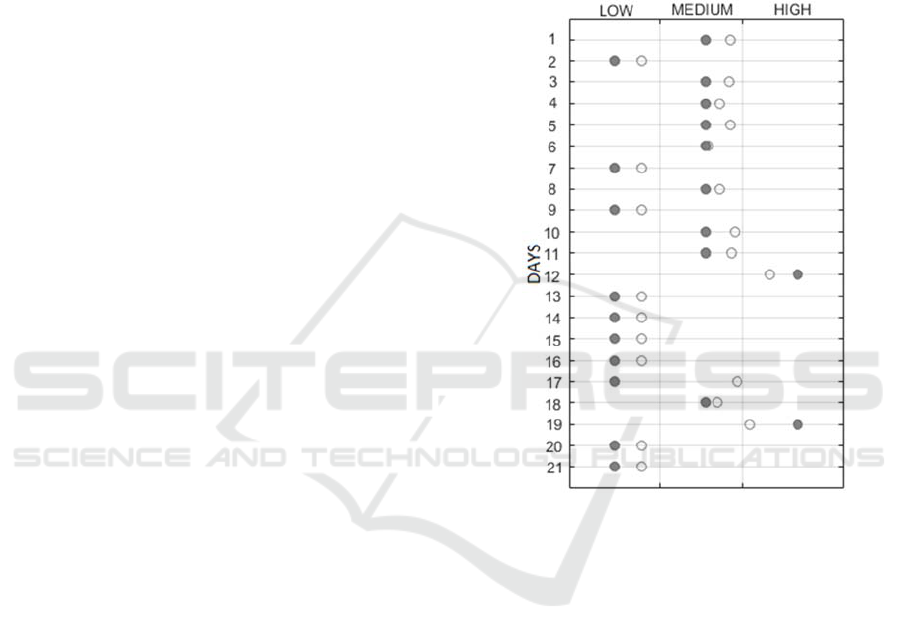
class, since the development of this kind of activities
involves recovery processes with a lower physical
activity level. Similarly, the biking activity is
expected to range from medium to high PAL,
depending on the speed and the road slope. In
contrast driving, which is an activity with constant
PAL, is entirely included in the Medium PAL and
not, as expected, in the Low. A deep investigation
into the levels of processing shows that the most
error for driving is located in the sensor fusion. In
general, depending on the traffic and anxiety levels,
driving may be an activity with high cognitive load,
leading to a high heartbeat rate. In addition wrist
acceleration is constantly high.
However, driving is not a physical activity. Since
wrist motion and heartbeat rate may be both high
when driving, the pedometer should play a more
important role in decision. For this purpose, the
linear combination of features used as the decision
function is not a good induction system. We expect
that a tree-like structure for the decision function
could better distinguish situations in which one
sensor can better play the role of discriminator. A
comparative study can be proficiently handled as
future work.
Since the purpose of the system is to assess
physical activity on a daily basis, Fig. 5 shows the
daily PAL computed by the system (white circles)
along with the expected PAL (black circles). It is
computed as the average PAL of the time windows
of the day. Here we remark that, in 21 days, there is
only one misclassification, on day 17. A deep
investigation has shown that the error is derived by
the driving activity, which is relevant for day 17. We
remark that other 3 days in which driving was not
the main activity are not affected by misclassifica-
tion. Overall, the Mean Square Deviation with re-
spect to the expected daily PAL is 0.158. The system
was trained using 9 days (43%) of this data set.
In order to investigate the system behavior on
older subjects, we have involved other two subjects
into the experimentation. A problem is that older
subjects are usually less active and less prone to
manage a detailed diary. For this reason, we used the
training carried out with the subject A for the initial
roll-out of the system on the two subjects. The
experimentation was made on three types of activity:
relaxing, walking, and stairs climbing, and the diary
entries were collected by the observer during direct
observation. Although the number of activities and
the gathering time are not relevant, results are very
promising.
More specifically, subject B is a 74 years old
man. He is retired, and is not physically active. He
does at most 30 minutes of walking per day, for 5
days per week. He practises gardening, and does not
present any frailty symptom. Occasionally he had
some fall (recently, when taking the bus) without
injuries. He is not under drug therapy. The data, on
14 time windows, were gathered on spring 2016.
Each activity effort was classified by subject B as
Low for Relax, High for Walking and Stairs
climbing. The system performance is measured by a
Mean Square Deviation of 0.0533.
Figure 5: Daily PAL assessing in Subject A.
Subject C is a sedentary 79 years old man. He is
retired. He is not a very active individual: he walks
for less than 15 minutes per day, for 5 days per
week. He periodically does medical examinations,
and is under drug therapy for blood pressure and
cholesterol lowering therapy. The data, on 12 time
windows, were gathered on summer 2016. The
subject C classified his activity effort as Low for
Relax and High for Walking and Stairs Climbing.
The system performance is measured by a Mean
Square Deviation of 0.0996.
We remark that although both subjects have
classified the walking activity effort as high, which
is different than subject A, the system has correctly
measured the walking. Actually, the direct
observation of subjects B and C has clearly shown
that walking requires some degree of physical effort
for them. The early results show that our system
assesses PAL on how the activity is performed,
despite of activity type.
Measuring Physical Activity of Older Adults via Smartwatch and Stigmergic Receptive Fields
729

5 CONCLUSIONS
In this paper an innovative computational architectu-
re for broad-spectrum assessment of the physical
activity level of older adults is presented. The
detection strategy is founded on stigmergic compu-
ting, a bio-inspired mechanism of emergent systems,
which requires a continuous data gathering through
general-purpose and non-intrusive devices, such as
smartwatch. The architectural design is first
presented. Then, the system experimentation is
discussed on three subjects, making possible the
initial roll-out of the approach in real environments.
Experimental studies show promising results. A
clinical trial could be interesting to validate the
approach.
The system performance can be further impro-
ved exploiting more sensors and investigating a tree-
like structure for the decision function, in order to
better distinguish situations in which one sensor
plays the role of discriminator.
ACKNOWLEDGEMENTS
This work was partially supported by the PRA 2016
project “Analysis of Sensory Data: from Traditional
Sensors to Social Sensors” funded by the University
of Pisa.
REFERENCES
Avvenuti, M., Cesarini, D., Cimino, M.G.C.A. (2013).
MARS, a multi-agent system for assessing rowers'
coordination via motion-based stigmergy, Sensors,
MDPI, 13(9), 12218-12243.
Abbate, S., Avvenuti, M., and Light, J. (2012). MIMS: a
minimally invasive monitoring sensor platform. IEEE
Sensors Journal, 12(3), 677-684.
Barsocchi, P., Cimino, M.G.C.A., Ferro, E., Lazzeri, A.,
Palumbo, F. and Vaglini, G. (2015). Monitoring
elderly behavior via indoor position-based stigmergy,
Pervasive and Mobile Computing, Elsevier Science,
23, 26-42.
Boletsis, C., McCallum, S., and Landmark, B. F. (2015,
August). The use of smartwatches for health
monitoring in home-based dementia care. In
International Conference on Human Aspects of IT for
the Aged Population (pp. 15-26). Springer
International Publishing.
Bonomi, A. G., Plasqui, G., Goris, A. H., and Westerterp,
K. R. (2010). Estimation of Free Living Energy Ex-
penditure Using a Novel Activity Monitor Designed to
Minimize Obtrusiveness. Obesity, 18(9), 1845-1851.
Cimino, M. G. C. A., Pedrycz, W., Lazzerini, B.,
Marcelloni, F. (2009). Using Multilayer Perceptrons as
Receptive Fields in the Design of Neural Networks
Neurocomputing, Elsevier Science, 72(10-12) 2536-
2548.
Cimino, M. G. C. A., Lazzeri, A. and Vaglini, G., 2015,
Improving the analysis of context-aware information
via marker-based stigmergy and differential evolution,
Proceeding of the international Conference on
Artificial Intelligence and Soft Computing (ICAISC
2015), in Springer LNAI, Vol. 9120, Part II, pp. 1-12,
2015.
Fontecha, J., Hervás, R., Sánchez, L., Navarro, F. J., and
Bravo, J. (2011, December). A proposal for elderly
frailty detection by using accelerometer-enabled
smartphones. In 5th International Symposium of
Ubiquitous Computing and Place Intelligence.
Fontecha, J., Navarro, F. J., Hervás, R., and Bravo, J.
(2013). Elderly frailty detection by using
accelerometer-enabled smartphones and clinical
information records. Personal and ubiquitous
computing, 17(6), 1073-1083.
Guiry, J. J., van de Ven, P., and Nelson, J. (2014). Multi-
sensor fusion for enhanced contextual awareness of
everyday activities with ubiquitous devices. Sensors,
14(3), 5687-5701.
Hager, G. D. (2012). Task-directed sensor fusion and
planning: a computational approach (Vol. 99).
Springer Science and Business Media.
Jansen, F. M., Prins, R. G., Etman, A., van der Ploeg, H.
P., de Vries, S. I., van Lenthe, F. J., and Pierik, F. H.
(2015). Physical activity in non-frail and frail older
adults. PloS one, 10(4), e0123168.
Parkka, J., Ermes, M., Antila, K., van Gils, M., Manttari,
A., and Nieminen, H. (2007, August). Estimating
intensity of physical activity: a comparison of
wearable accelerometer and gyro sensors and 3 sensor
locations. In 2007 29th Annual International
Conference of the IEEE Engineering in Medicine and
Biology Society (pp. 1511-1514). IEEE.
Zhu, J., Pande, A., Mohapatra, P., and Han, J. J. (2015,
October). Using Deep Learning for Energy
Expenditure Estimation with wearable sensors. In
2015 17th International Conference on E-health
Networking, Application and Services (HealthCom)
(pp. 501-506). IEEE.
ICPRAM 2017 - 6th International Conference on Pattern Recognition Applications and Methods
730
