
The Virtual Enterprise Data Warehouse for Healthcare
James P. McGlothlin, Amar Madugula and Ilija Stojic
Fusion Consulting Inc, Irving, TX, U.S.A.
Keywords: Data Warehousing, Business Intelligence, Data Virtualization.
Abstract: Healthcare organizations have access to more data than ever before. Healthcare analytics is a vital tool for
healthcare organizations and hospitals to analyze performance, identify opportunities to improve, make
informed decisions, and comply with government and payor regulations. However, the field of medicine and
the political and regulatory landscape are constantly changing, thus these requirements and opportunities
rapidly evolve. The traditional best practice solution for business analytics is to organize and consolidate the
data into a dimensional data warehouse for analytics purposes. Due to the size of the data, the number of
disparate sources and the volume of analytics needs, the overhead to create and maintain such a data
warehouse is becoming prohibitive. In this paper, we introduce a virtual data warehouse solution that
combines the design and modelling principles of traditional dimensional modelling with data virtualization
and in-memory database architectures to create a system which is more agile, flexible and scalable.
1 INTRODUCTION
In the healthcare industry in the United States, there
has been a rapid and transformational move to
electronic medical records (EMRs). The result of
these technological advancements is that much more
data is available. The challenge every hospital faces
is how to use this vast supply of data to improve and
make better decisions. This problem is magnified by
the ever changing quality metrics, regulatory
requirements, payment and incentive programs,
political programs and environment. Healthcare
organizations must be able to support different
analytics and even operational processes for different
patient populations and payors.
The amount of data available is staggering. Not
only do modern EMRs allow digital access to every
medication administration, order and test result, but
personalized medicine is allowing the use of specific
gene and DNA information to improve patient care.
Additionally, personal electronic sensors and
wearables are allowing healthcare organizations to
analyze patient data even outside of the office or
hospital. The volume of healthcare data is growing at
a rate of 48% annually (Leventhal, 2014).
In addition to the exponential growth of
healthcare data, there is also an exponential growth of
healthcare costs. This is being magnified by increased
life expectancy and a large aging population. Payors
are pushing down these costs through changing
payment models such as pay for performance,
managed care, full risk plans, value based purchasing
and more. With each of these programs comes
different analytics needs and different requirements
for compliance, reimbursement and incentives.
The traditional best practice for analytics has been
to create a dimensional model data warehouse which
organizes the most important enterprise data for
analytics. Sets of business intelligence tools, reports
and dashboards can then utilize these data warehouses
to provide the analytics needs of the organization.
However, this approach is becoming less sustainable
for large organizations in the healthcare industry. The
needs and requirements change too quickly and are
too specialized to allow for development of custom
extract/transform/load (ETL) processes for each
need. The number of data sources is too diverse and
the data varies too much in availability, quality and
format to allow for complete daily extraction into the
data warehouse. The sheer volume of data overloads
the data warehouse and makes the storage, memory
and scalability requirements untenable. In a recent
survey, healthcare data scientists reported that 49%
were having difficulty fitting data into relational
databases, and that data variety was an even greater
challenge (Miliard, 2014).
In this paper, we introduce a solution that
combines the design and advantages of a traditional
McGlothlin J., Madugula A. and Stojic I.
The Virtual Enterprise Data Warehouse for Healthcare.
DOI: 10.5220/0006253004690476
In Proceedings of the 10th International Joint Conference on Biomedical Engineering Systems and Technologies (BIOSTEC 2017), pages 469-476
ISBN: 978-989-758-213-4
Copyright
c
2017 by SCITEPRESS – Science and Technology Publications, Lda. All rights reserved
469
data warehouse with the latest advances in data
virtualization technology. Additionally, we leverage
in-memory databases and column stores to further
accelerate performance and agility. We will describe
our solution, how we are using it to integrate data
from many different sources, and analyze the benefits
of this approach.
2 THE TECHNICAL SOLUTION
Data virtualization is an approach and technology for
integrating multiple sources of data. Our goal with
data virtualization is to abstract the logic of the data
model from the specifics of the data location and
source formatting. This means that applications and
users consuming the data do not need to be aware of
how or where the data is physically stored. This
allows us extreme agility, because we can choose at
any point to consolidate data, move data, transform
data or cache data without any effect on the tools and
users consuming the data upstream.
We implemented our virtual enterprise data
warehouse using the Cisco Data Virtualization (Cisco
DV) platform. Cisco DV supplies data federation to
many types of sources including relational databases,
files, cloud and big data technology solutions such as
Hadoop (Zikopoulos and Eaton, 2011), web services,
and multi-dimensional sources. These sources are
accessed and integrated using advanced query
planning and optimization, parallelization and
distributed joins. However, this data virtualization
platform is for more than just data federation. Our
goal with a DV platform is to create a true single
version of the truth for the enterprise. We chose Cisco
DV because it provides a development environment
to create a logical data model and then map it to the
source systems. Also, it provides a business directory
allowing the data points to be defined and made
available in business terms. This provides the
foundation for a data governance data dictionary for
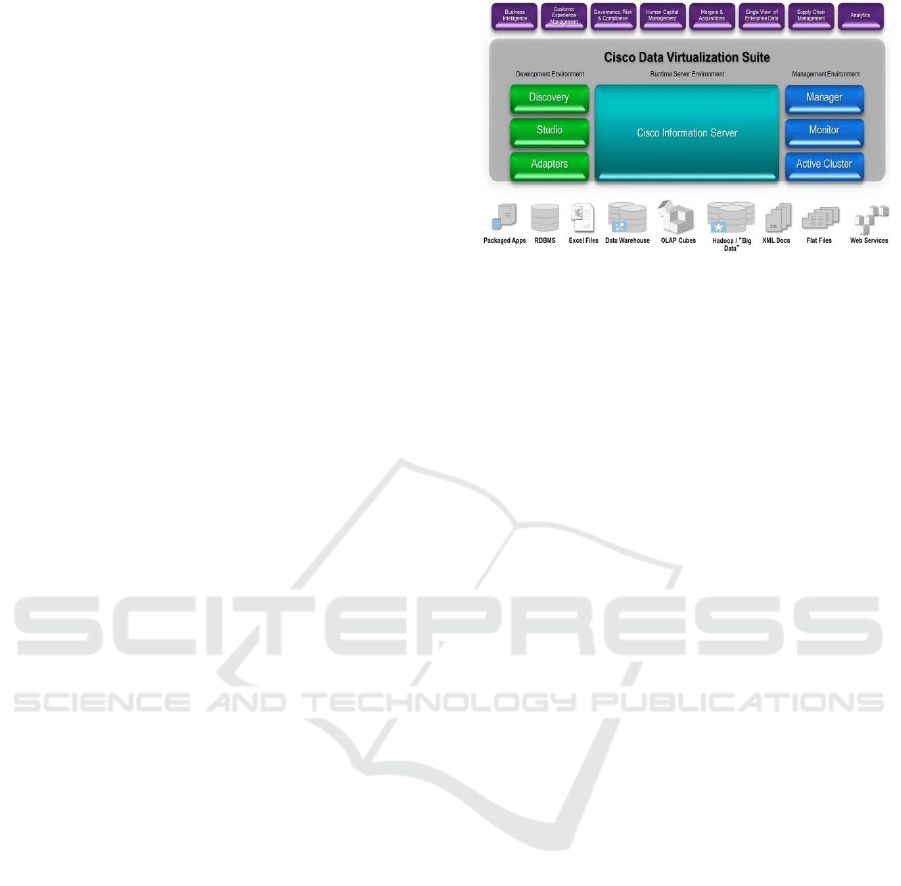
the enterprise. Furthermore, Cisco DV maintains and
persists a metadata repository that defines the data
model as views and the technical details to map the
information view to the underlying data source
system. Since this metadata is persisted with history
and version control, it provides an excellent solution
for data lineage. Our experience is that data lineage
is an absolute requirement to achieve user trust in the
data and user adoption. Figure 1 shows the
architectural diagram of the Cisco DV Suite.
Data virtualization provides some solutions for
performance issues including query optimization and
caching. However, we found that most of the benefits
Figure 1: Cisco Data Virtualization Suite.
of data virtualizations were reduction in ETL
development level of effort, reduction in the time to
market on new projects, improved data management
and governance, and reduction of ETL daily
execution time. These features are important but they
do not address the issue of performance for analytics
to the end user. In fact, depending on the source
system, it is possible that the traditional consolidated
data warehouse, which is designed for analytics
queries, will outperform a virtualized approach. We
consider this a very important problem to solve so we
introduced additional technology to accelerate
performance.
SAP HANA is an in-memory, column store
database appliance designed for analytics data
warehouses (Sikka et al, 2013). Column store
databases perform especially well for analytics
because they optimize read-only access of the data,
whereas traditional database optimize single row
transactions. Because columns are stored together,
there is significantly less local data variety and
therefore more opportunity for data compression.
Also, column stores only retrieve data requested in
the query. In dimensional modelling, generally the
analytics user chooses specific dimensions for
constraints or analysis. Because column stores only
retrieve the information requested, they are especially
well-suited for analytics data warehouse queries
(Stonebraker et al, 2005). This is even more
magnified with self-service reporting, where there is
no way to optimize the report ahead of time because
the user has the option to change the query. Finally,
and most importantly, HANA is completely in-
memory. Therefore, queries are extremely fast.
Because of the column store architecture and
advanced compression technologies, we have found
compression rates ranging from 5x to 47x depending
on the type and sparsity of the data. Figure 2 shows
the architecture of the SAP HANA Platform.
As we stated earlier, data virtualization hides
from the consumer and upstream applications the
HEALTHINF 2017 - 10th International Conference on Health Informatics
470
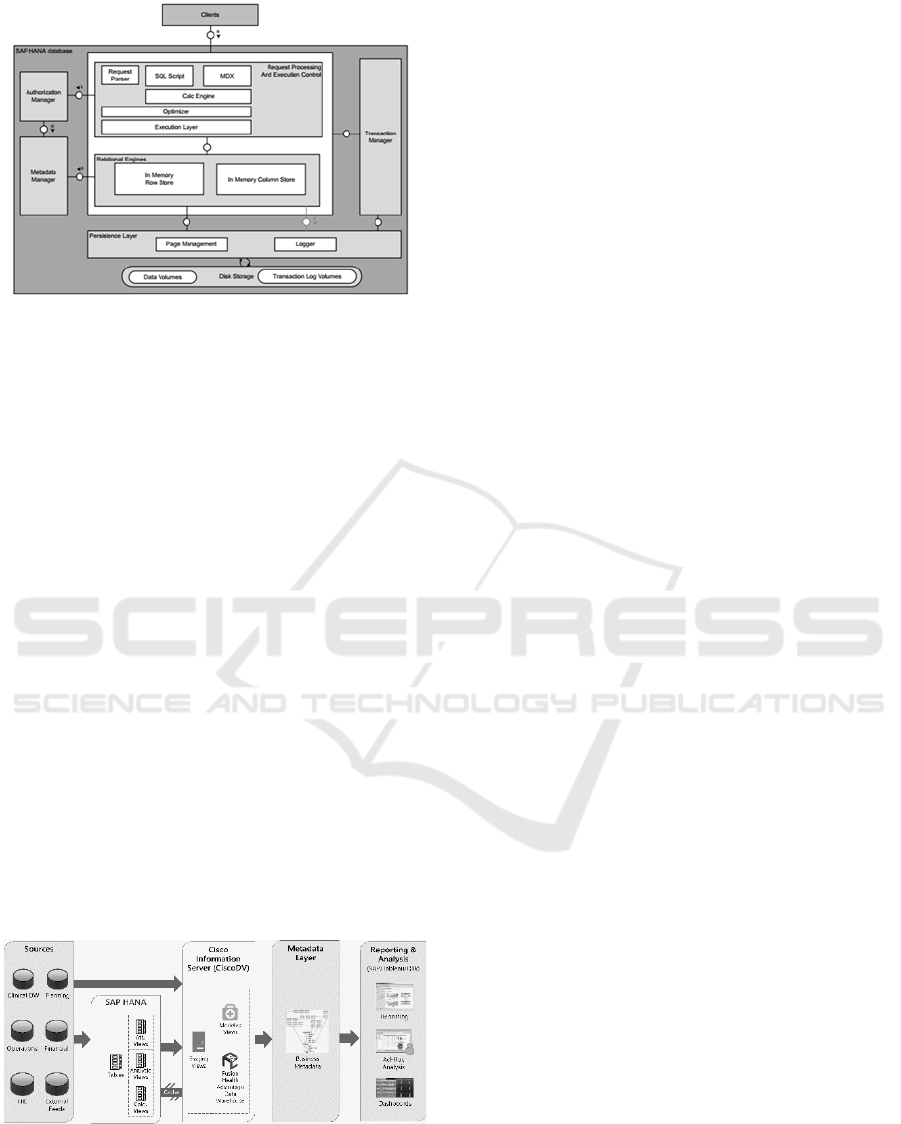
Figure 2: SAP HANA Platform.
physical source of the data. This allows us to move
the most important data to SAP HANA and to adjust
which data is stored in HANA based on optimization
needs. This has been shown to improve some
queries’ performance by over 100x. There is no
impact or change required to the tools, reports or
dashboards. We are terming our use of HANA as
physical cache. Cisco DV handles moving the data
from the original source into HANA so no extra
development effort is required.
We continue to use industry standard Kimball
dimensional modelling design for our virtual
enterprise data warehouse (Kimball, 2011). All of
our data models are defined using facts, dimensions,
bridges and other standard data warehouse design
techniques. We implemented algorithms needed for
data integration such as patient matching, provider
attribution, cross walk tables, and standard code sets.
We created flexible, source-agnostic business model
for healthcare using dimensional modelling. The
primary difference is that this is a logical model, we
are not always physically populating tables that match
the model schema. Instead, we are using data
virtualization views as appropriate. Figure 3 shows
the solution architecture.
Figure 3: Cisco DV/SAP HANA Solution.
3 IMPLEMENTATION
3.1 EMR Data
For a hospital, the most important data source is the
hospital electronic medical record (EMR). Many
EMRs now supply data warehouse and analytics
solutions. Our goal is certainly to leverage these
solutions. However, we have found many instances
where we had to add custom extension tables because
of different processes at our hospital or different
analytics needs. Here are some of many examples:
a. Blood pressure on an office visit to be lowest
rather than last
b. Discharge provider on a hospital visit to be
based on the bill rather than the treatment
team log
c. Provider attribution
d. Quality metrics that look for clinical events
in both clinical documentation and the bill
and claim
e. DRGs to include the secondary DRG coded
on the bill
f. Cancellation reasons for cancelled
appointments or surgeries
g. Different documentation data points for
expected discharge delay reasons
Our challenge is that the vendor does not allow us
to change their tables. We can create our own tables
but now extra logic and table joins is needed when
doing analysis and reports.
We have defined a pure data model and metadata
layer in our virtual data warehouse. In accordance
with traditional Kimball dimensional modelling, our
model matches the business model and analytics
needs, rather than the source (Kimball, 2011). So
even though three or four tables from the EMR
vendor data warehouse and extensions may be
required, it will look like a single table in the virtual
enterprise data warehouse. This allowed us to cover
all of the information in the vendor data warehouse
with 40 less tables and to considerably reduce the
complexity of the queries used by reports and
dashboards.
For example, the vendor data warehouse has fact
tables for hospital visits, billing accounts, and
services. We wish to know the discharge provider
and last service for the hospital visit. For our hospital,
the discharge provider is inaccurate on the hospital
visit fact, but correct as the attending provider on the
hospital account fact. The last service is not the
hospital service on the hospital visit fact, but can be
determined by determining the last service for the
The Virtual Enterprise Data Warehouse for Healthcare
471

patient chronologically. This logic is complex for a
report writer and is very likely to create reporting
errors. Specifically, the discharge provider on the
source table is not the correct discharge provider. We
were able to use data virtualization to create a single
hospital visit fact with the correct values for these
columns for our business. This allows our data
governance team to choose the correct business
definition and us to expose it to the entire enterprise.
The complex logic and the inaccurate columns from
the EMR vendor data warehouse are not exposed to
the user. However, the EMR vendor data warehouse
is still utilized to source the data. This allows us to
create a much better data warehouse for our clinical
EMR data and our end users.
3.2 Other Clinical Sources
With the current focus on preventive care and
population health, it is becoming more imperative to
have all information related to a patient’s health. This
can include data from outside of the hospital’s EMR
including claims, pharmacy and lab data. This can
also include clinical data from independent providers
or Health Information Exchange(s). Furthermore,
hospital networks continue to consolidate, and often
the different hospitals and clinics are using different
EMR systems. One key challenge health care
business intelligence teams face is integrating clinical
and operational data from multiple sources.
Integrating data allows a provider or care coordinator
to be aware of patient office visits, diagnoses, lab
results, prescriptions, images and hospital visits
which occur outside of their primary EMR. This
improves care management and risk assessment,
allows gaps in care to be addressed and makes it
possible to do quality metrics with complete
information. Also, outside data can be used to better
stratify patient risk.
For example, if we have pharmaceutical claims
information, we can know if the patient received their
flu vaccine at the local grocery store, and we can
assess their adherence to medication orders. If we
have information from an affiliated
ophthalmologist’s EMR, we can know whether the
patient received their diabetic eye exam. If we have
claims information, we can know about hospital
admissions while the patient was on vacation. We
can connect with risk stratification engines to know
what potential events the patient is most at risk for,
and what preventive care measures might help avoid
these issues. We can use benchmarks to see how our
admission rates, length of stay, supply cost and other
information compare to others in the industry.
Bringing in these data sources is challenging. We
have to match the patients and providers with those
already in our enterprise data warehouse. We have to
maintain the original source system identifiers, so we
will be able to process updates or additional patient
information in the future. This information comes in
at various times which we do not control, so we
cannot perform a daily extract as easily as our process
for our EMR extraction. The data comes in many
different formats and uses different code sets. So, the
logic needed to conform the data can vary depending
on the source.
We have brought in claims data both from payors
and from network affiliate providers. We have used
custom extracts to bring in specific clinical
information from affiliate providers EMRs. In the
future, we plan to bring in lab and pharmacy data.
We developed logic for patient matching and
persisted the patient matching results and a crosswalk
to the source system in our data warehouse. We then
virtualized all of the other data. The end result was
that we created quality dashboards that examined
patients’ entire health across all of the clinical source
systems. This dashboard only accessed the virtual
metadata abstract layer so the reports did not need any
information about the source systems or formats.
However, we did include metadata about the source
system, so that users could know the data lineage of
the information. This allows a physician at our
hospital to know that his patient had a lab result from
an outside provider.
3.3 Non-clinical Systems
Our hospital has many sources of data which are not
clinical. However, all of these systems provide
increased value when analytics which includes the
clinical data can be provided.
For example, decision support costing systems
allow us to determine the costs associate to a billing
transaction, a surgery, an order or a medication. This
can include fixed and variable costs in many different
accounting buckets such as labor, supply and
overhead. Integrating this data with the clinical data
warehouse lets us analyze costs related to specific
diseases, patient cohorts, locations, providers,
procedures, etc. Because this data is managed in a
different system and is quite large, we do not want to
physically consolidate this data so we are using our
data virtualization platform.
We also have materials management and supply
chain information. This allows us to evaluate
inventory and purchasing contracts. This information
feeds our cost algorithms. There is significant value
HEALTHINF 2017 - 10th International Conference on Health Informatics
472

in making this data available in our data warehouse
for analytic purposes.
Another example is HR information. This
information often involves many different systems
and forms including position information, salary and
benefits information, provider credentialing and time
and attendance. Including time and attendance with
the clinical events performed by the employee allows
us to evaluate productivity. We can analyze wages
and overtime to determine opportunities for improved
resource management, training information and cost.
Other examples of peripheral non-clinical data
include accounts receivable collections information
and budgeting information.
3.4 Clinical Support Systems
There is a vast amount of clinical information
available in hospitals which many not be in the central
EMR. This includes case management systems
which monitor physician reviews, expected
discharges, avoidable days, etc., statistical systems
which are used for clinical details such as Apache
(Knaus et al, 1981) and Prism (Murray et al, 1988)
critical care evaluation techniques, lab systems
which have more detailed information about
specimens collected or blood units supplied,
radiology systems which have detailed information
about images, and clinical engineering systems for
oncology, pathology, cath labs, etc. These systems
vary for each hospital we have worked with.
Generally, we have found it is not necessary to
bring in all of the data from these ancillary systems.
However, often specific key data points are very
important to our data warehouse. We have used data
virtualization to target and pull out specific data
elements which augment data structures we already
have in our data warehouse.
3.5 Benchmarks
Every hospital and healthcare organization wants to
know how it is performing relative to its peers. This
provides valuable insight identifying opportunities
for achievable improvement. There are hundreds of
sources for benchmarks of all different varieties.
Examples include quality benchmarks like Medicare
Stars ratings and Pay for Performance percentiles,
financial benchmarks like supply cost for OR in the
region, benchmarks like Centers for Medicare and
Medicaid Services (CMS) length of stay by DRG.
These are simple benchmarks but there are much
more complicated clinical benchmarks and whole
companies which special in providing benchmark
information. We plan to use data virtualization to
integrate these benchmarks into the enterprise data
warehouse so we can show opportunities, targets and
concerns in our dashboards and visualizations. We
have brought in many of the simple ones, and plan to
bring in more comprehensive and detailed
benchmarks in the future such as critical care length
of stay by service and comorbidity.
3.6 Patient Experience
It is important for a hospital to monitor patient
satisfaction. Patient satisfaction is measured through
customer surveys. Generally, these surveys are
outsourced so they can be objective, fair and
consistent. Analyzing the results of this external
information can provide the hospital valuable insight
into improvement opportunities.
3.7 Precision Medicine
Precision medicine uses patient information to tailor
personalized treatment. For example, analysing
patients’ genomes can allow the most effective cancer
treatment medication and therapy to be chosen. There
is considerable research funding being applied to
precision medicine and it is considered a very
significant development for improving healthcare
treatment. (Jameson and Longo, 2015)
Clinical information such as medications
administered, medication reactions, diagnoses,
pathology results, and precise imaging information is
vital to properly tailor a personalized medicine
approach. So, important information exists in the
enterprise data warehouse to identify the appropriate
patient cohorts and monitor the progress of treatment.
However, precision medicine almost always
involves gene analysis. Clearly, genome databases
are huge and cannot be consolidated physically into
our data warehouse. Thus, the data virtualization
approach is absolutely vital to implementing
precision medicine.
3.8 FHIR
Fast Healthcare Interoperability Resources (FHIR) is
a framework for next generation intercommunication
between healthcare data systems. FHIR uses RESTful
(representational state transfer) application
programming interfaces (APIs) and defined data
points and elements (resources) to exchanging
information electronically. FHIR is a standard
managed by the HL7 organization, the major
standardization organization for healthcare data
The Virtual Enterprise Data Warehouse for Healthcare
473

(Bender, 2013).
Cisco DV supports web services as a source for
the enterprise data warehouse include RESTful APIs
and XML resources. As such, we can integrate data
platforms which support FHIR using this standard.
4 BENEFITS
In addition to allowing us to integrate so many
different sources, our virtual enterprise data
warehouse approach solves many problems we have
encountered in our traditional healthcare data
warehouses.
4.1 ETL Performance
Because of the complexity of the healthcare data and
EMR, we have found the daily process of extracting
the data time-consuming. Best practice requires us to
have multiple data warehouses for production,
development and user acceptance testing. Generally,
they source from the same operational data store for
the EMR. It has been a constant challenge to have
this ETL finish in a timely manner. If we were to
increase the logic in this data warehouse
transformation, the ETL time would grow. If we were
to bring other sources into the physical data
warehouse, the ETL time would definitely grow. Data
virtualization allows us to avoid bringing other data
sources into our physical data warehouse. It also
allows us to move some of the logic out of the
physical data warehouse and into the abstraction
layer.
4.2 Scalability
Healthcare information is very detailed. A week long
hospital stay can have as much as 10,000 separate
data points documented. There is a challenge both on
disk space and ETL load time to get all this data into
the data warehouse. This problem is magnified when
data outside the organization such as claims
information and affiliate provider data is brought in
and integrated. The growth in this data can be hard to
predict as can the additional data needs of the
organizations which are constantly evolving.
Clearly, the virtual data warehouse reduces the
physical disk space requirement by leaving some data
in place. Moreover, it is inherently scalable. Because
the data transformation is not tied to the data storage
and consumers of the data are not connected to the
data storage, we can easily move where the data is
stored. This allows us the flexibility to integrate cloud
solutions or to choose new technologies at a future
time without needing to make final decisions now.
The organization is given the flexibility to change
databases or use big data technologies in the future
without impacting the architecture or the data
consumers.
4.3 Tool Agnostic
Many business intelligence tools such as SAP provide
a metadata layer. However, our experience is
different tools are required for different purposes.
Many hospitals use both SAP tools and Tableau, Qlik
or other visualization tools. In the past, it was
necessary to recreate the metadata layers and security
for each tool set or risk inconsistencies between
applications. In our virtual data warehouse solution,
the metadata is persisted in the data virtualization
layer and consumed by all of our business intelligence
tools.
4.4 Security
Few things are more important to healthcare
organizations than security. Compliance and privacy
regulations are very strict. The organization must
define who can see each piece of data. This includes
object level security (can the user see this type of data
at all based on their role) and row level security (can
the user view this specific data element based on the
value - such as location, patient, provider). The data
virtualization layer provides a single place to define
and enforce security which will then be consumed
consistently across the organization.
4.5 Data Availability
Our source data becomes available at different times.
Some data such as census we have enabled for almost
realtime access. Much of the EMR data is available
daily. Some external data such as claims may only be
provided monthly. Some calculated data is only
updated quarterly. By disconnecting the source from
the abstraction layer, we can have greater control over
when data is refreshed and can support on-demand
access, custom extracts, and pipeline push
consumption.
Additionally, it is important to make the data
always available and consistent to the user. We want
to avoid restricting access during loads, but we never
want to provide partial or inconsistent information.
The data virtualization layer gives us a place to
manage this. Generally, we can provide stale data or
cached data during updates.
HEALTHINF 2017 - 10th International Conference on Health Informatics
474

4.6 Data Governance
Data governance is a methodology and process for
managing information as an asset. As part of the data
governance program, the hospital chooses which data
points are important, a standard name and definition
for that data point, a correct source of truth, and who
should be allowed to see the data. Data governance
and metadata management is vital to obtaining “a
single version of the truth”, which is a important yet
difficult goal. The virtual data warehouse gives all
analytics and reporting users a single place to go to
obtain data. The data and logic can be defined in an
organized manner. The data dictionary provides the
definition in business terms and the data lineage in
technical terms. Users and data stewards can search
the data dictionary so that data is used consistently
rather than extracted repeatedly. All business
intelligence tools can source the data from the data
virtualization layer allowing the logic and naming to
be consistent across the organization.
5 RESULTS AND CONCLUSION
We have implemented our data virtualization
approach at several major hospitals and continue to
expand these projects. We have been able to
successfully deploy the virtual data warehouse and
enable access to the physical EMR data warehouse
quite quickly. Then, we grow and adjust this model to
bring in the other sources important to the enterprise
analytics. All of our projects are still growing but we
have seen very encouraging early results including
faster project development times, user adoption of the
metadata, improved data governance implementation
and significant reduction in model complexity.
With the growth in healthcare data in both volume
and variety, and the growth in analytics needs, the
traditional data warehouse and analytics approach is
simply not agile enough to scale for the needs of the
healthcare industry. By introducing data
virtualization and in-memory persistent caching, and
by preserving the dimensional model foundation of
the data warehouse approach, we assert that we have
created a solution that is sufficiently agile to scale and
grow with the needs of the modern hospital.
REFERENCES
Leventhal, R, 2014. Report: Healthcare Data is Growing
Exponentially, Needs Protection. In Healthcare
Informatics.
Miliard, M, 2014. Data variety bigger hurdle than volume.
In Healthcare IT News.
Sikka, V., Färber, F., Goel, A., Lehner, W., 2013. SAP
HANA: the evolution from a modern main-memory
data platform to an enterprise application platform. In
Very Large Databases.
Stonebraker, M., Abadi, D, Batkin, A. et al, 2005. C-Store:
A Column-oriented DBMS. In Very Large Databases.
Kimball, R, 2011. The data warehouse toolkit: the
complete guide to dimensional modelling. Wiley
Computer Publishing.
Bender, D, 2013. HL7 FHIR:An agile and RESTful
approach to healthcare information exchange. In
CBMS.
Zikopoulos, P, Eaton, C, 2011. Understanding Big Data:
Analytics for Enterprise Class Hadoop and Streaming
Data. McGraw-Hill Osborne Media.
Ellisman, M. and Peltier, S., 2003, December. Medical data
federation: The biomedical informatics research
network. In The Grid (Vol. 2).
Bloom, K. and Cms Collaboration, 2014. CMS Use of a
Data Federation. In Journal of Physics: Conference
Series (Vol. 513, No. 4, p. 042005). IOP Publishing.
Kahn, B.K., Strong, D.M. and Wang, R.Y., 2002.
Information quality benchmarks: product and service
performance. Communications of the ACM, 45(4),
pp.184-192.
Tesch, T. and Levy, A., 2008. Measuring service line
success: the new model for benchmarking: the service
line model benefits nearly all stakeholders involved in
healthcare delivery. But how is its success measured?.
Healthcare Financial Management, 62(7), pp.68-75.
Schneider, Polly. "How Do You Measure Success?." In
Healthcare Informatics 15.3 (1998): 45-56.
Raghupathi, W. and Raghupathi, V., 2014. Big data
analytics in healthcare: promise and potential. Health
Information Science and Systems, 2(1), p.1.
Goth, G., 2007. Virtualization: Old technology offers huge
new potential. IEEE Distributed Systems Online, 8(2),
p.3.
Feldman, B., Martin, E.M. and Skotnes, T., 2012. Big Data
in Healthcare Hype and Hope. October 2012. Dr.
Bonnie, 360.
Hopkins, B., Cullen, A., Gilpin, M., Evelson, B., Leganza,
G. and Cahill, M., 2011. Data virtualization reaches the
critical mass. Forrester Report.
Lupşe, O.S., Vida, M.M. and Tivadar, L., 2012. Cloud
computing and interoperability in healthcare
information systems. In The First International
Conference on Intelligent Systems and Applications
(pp. 81-85).
Koufi, V. and Vassilacopoulos, G., 2008. Context-aware
access control for pervasive access to process-based
healthcare systems. Studies in health technology and
informatics, 136, p.679.
Knaus, W.A., Zimmerman, J.E., Wagner, D.P., Draper,
E.A. and Lawrence, D.E., 1981. APACHE-acute
physiology and chronic health evaluation: a
physiologically based classification system. Critical
care medicine, 9(8), pp.591-597.
The Virtual Enterprise Data Warehouse for Healthcare
475

Pollack, Murray M., Urs E. Ruttimann, and Pamela R.
Getson. "Pediatric risk of mortality (PRISM) score."
Critical care medicine 16.11 (1988): 1110-1116.
Jameson, J.L. and Longo, D.L., 2015. Precision medicine—
personalized, problematic, and promising. Obstetrical
& Gynecological Survey, 70(10), pp.612-614.
HEALTHINF 2017 - 10th International Conference on Health Informatics
476
