
Deep Learning-based Prediction Method for People Flows and Their
Anomalies
Shigeru Takano
1
, Maiya Hori
1
, Takayuki Goto
1
, Seiichi Uchida
2
, Ryo Kurazume
2
and Rin-ichiro Taniguchi
2
1
Center for Co-Evolutional Social Systems, Kyushu University,
744, Motooka, Nishi-ku, 819-0395, Fukuoka, Japan
2
Department of Advanced Information Technology, Graduate School of Information Science
and Electrical Engineering, Kyushu University, 744, Motooka, Nishi-ku, 819-0395, Fukuoka, Japan
takano@inf.kyushu-u.ac.jp, maiya-h@ieee.org, tygoto@soc.ait.kyushu-u.ac.jp, {uchida, kurazume}@ait.kyushu-u.ac.jp,
rin@limu.ait.kyushu-u.ac.jp
Keywords:
People Tracking, Anomaly Detection, Prediction of People Flow, Deep Learning.
Abstract:
This paper proposes prediction methods for people flows and anomalies in people flows on a university cam-
pus. The proposed methods are based on deep learning frameworks. By predicting the statistics of people
flow conditions on a university campus, it becomes possible to create applications that predict future crowded
places and the time when congestion will disappear. Our prediction methods will be useful for developing
applications for solving problems in cities.
1 INTRODUCTION
Smooth tra nsportation of people, materials and vehi-
cles enhances the vitality of city life. To service a di-
versified society for future generations, transfer needs
should be supported by provid ing not only conventio-
nal pub lic traffic services but also new transportation
services that can be adapted to city requirements, such
as car- and bicycle- sharing services and autonomou s
car services. As these new transportation service s are
developed, it is essential to construct a personal mob i-
lity support system by combining ser vices appropria-
tely to provide smooth and efficient transportation ad-
justed to personal characteristics and needs.
To understand the characteristics and needs of mo-
vement within a city, it is necessary to first observe
peoples activities using various sensing devices. To
realize a sustainable society, various smart city frame-
works have been proposed (Vilajosana et al., 2013),
(Cheng et al., 2015), (Al Nuaimi et al. , 2015), and de-
monstration experiments are being conducted all over
the world. To achieve a co-evolutional society, the
Center for Co-Evolutional Social Systems at Kyushu
University aims to develop a new urban operating sy-
stem (Fig. 1) that supports efficient, speedy, and se-
amless movement of people and materials, includ ing
energy and inf ormation . As part of this project, we
have developed pole-type sensor nodes that can mea-
sure people’s activity, and we are conducting demon-
stration experiments on our university campus using
these sen sor nodes. It is reasonable to predict that the
activity state for a local person living in a city is the
same as usual. However, it is difficult to optimally
predict the actions of visitors. Furthermore, events
such as conferences, festivals, and accidents will be
associated with some un usual an d difficult to predict
the behaviors of both visitors and locals. Our goal is
to sen se and predict people’s behavior in real time.
This paper proposes prediction methods for pe-
ople flows and an omalies in p eople flows on our cam-
pus. The proposed methods are based on dee p lear-
ning (LeCun et al., 2015). In our people flow pr e -
diction method, we convert people flow data measu-
red by our sensor nodes to statistics for m ovemen t di-
rections per unit time, and learn models that pr e dict
future statistical data from past data. Moreover, we
develop a k-nearest neighbor (k-NN) based anomaly
detection method (Goldstein and Uchida, 2016) for
people flows in real time, where the anom aly d ata are
accumulated over the long-ter m. By usin g the sto-
red people flow and anomaly data, our an omaly pre-
diction method learns a mo del for predicting an ano-
maly value for the next short time period. Predictin g
the statistics for people flow conditions on campus
makes it possible to create applications that predict
the next crowded place and the time when congestion
676
Takano, S., Hori, M., Goto, T., Uchida, S., Kurazume, R. and Taniguchi, R-i.
Deep Learning-based Prediction Method for People Flows and Their Anomalies.
DOI: 10.5220/0006248806760683
In Proceedings of the 6th International Conference on Pattern Recognition Applications and Methods (ICPRAM 2017), pages 676-683
ISBN: 978-989-758-222-6
Copyright
c
2017 by SCITEPRESS – Science and Technology Publications, Lda. All rights reserved
will disappear. Therefore, our prediction metho ds are
useful for developing a personal mobility support sy-
stem for a smart city.
The rest of the paper is organized as follows.
We introduce the pole-type sensor nodes and explain
the people flow and anomaly detection methods in
Section 2. Section 3 describes the methods of peop le
flow and an omaly prediction. Section 4 presents a n
experimental environment and some exper imental re-
sults. Section 5 concludes the pape r.
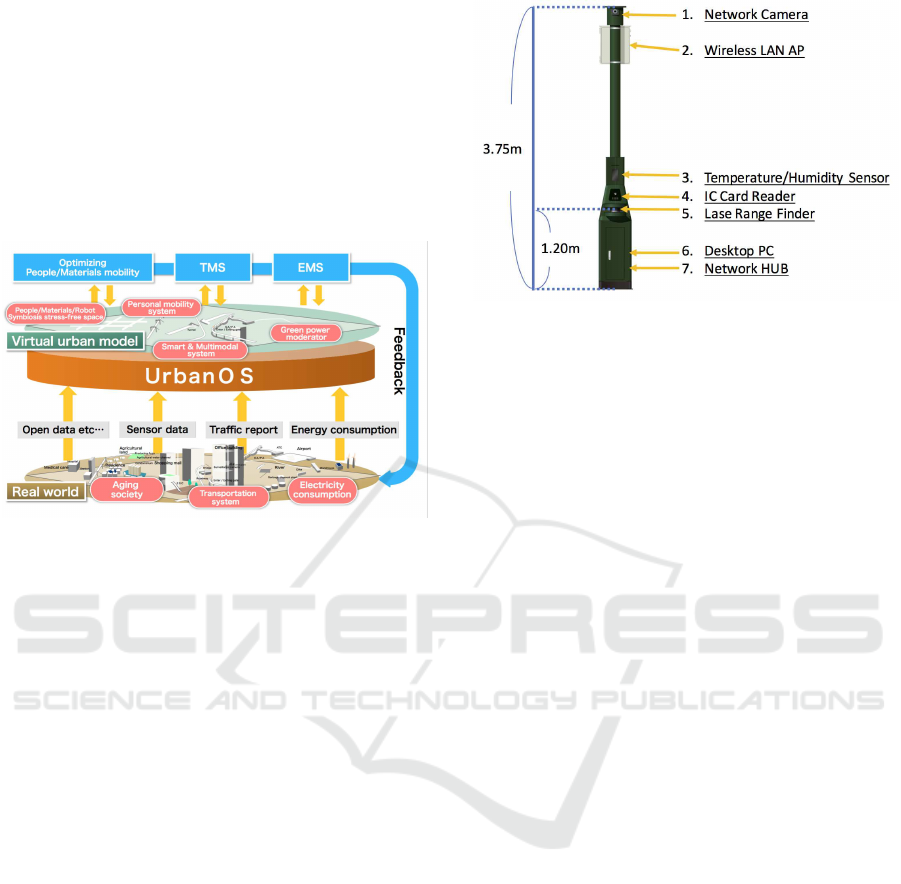
Figure 1: Overview of an urban operating system.
2 PEOPLE FLOW DETECTION
AND ANOMALY DETECTION
2.1 Petit Sensor Box
A petit sensor box (P-Sen) is a pole-type sensor node
equippe d with multiple sensors for measuring peop-
les activity. The height of a P-Sen is approxima-
tely 37 50mm, the width is 450mm and the de pth is
500mm. An overview of a P-Sen is shown in Fig. 2.
The sensors in a P-Sen are a network camera, a wi-
reless LAN access point (WLAN-AP), an integrated
circuit (IC) card reader, a temperature and hu midity
sensor and a laser range finder (LRF). To integrate the
sensor data and to transport them to ou r cloud server,
each P-Sen contains a desktop PC and a network hub.
Because of the amount of raw data captured by the
network camera and the LRF, the feature-extracted
data are transmitted to the cloud server through the
WLAN-AP.
In the following sub-sections, we explain in detail
the sensor data obtained by each of the sensors in a
P-Sen.
2.1.1 Network Camera
A network camera is put on the top of each P-Sen at a
height of 3.75 m from th e ground. The angles of view
Figure 2: Overview of a P-Sen.
are 85
◦
and 68
◦
in the horizontal a nd vertical directi-
ons, respec tively. The viewing ang le can be extended
by the pan-tilt functions. The image is captured at 30
frames per second, and the resolution can be selected
from several standard forma ts (1280 ×960, 640 ×480
and 320 × 240 pixels).
2.1.2 Wireless LAN Access Point
We construct a wireless sensor n etwork (WSN) using
the WLAN-APs in each of the P-Sens. This WSN c an
be used to send the sensor data collected by the P-Sens
to the cloud server. Moreover, we can collect Wi-Fi
probe requests that are broadcast by nearby mobile
devices. Because the collected probe r equests in c lude
the media access con trol (MAC) address of the mobile
device, we can count the number of devices around
the P- Sens.
2.1.3 IC Card Reader
The IC card reader in each P-Sen collects log data
whenever a user touches the reader with their IC card,
which in our case is the identification card for our uni-
versity. Using the log data from the IC card reader, w e
know when the user is on campus.
2.1.4 Temperature and Humidity Sensor
Our sensor can measure the temperature and humidity
around the P-Sen. The measured data a re sent to the
cloud ser ver every minute.
2.1.5 Laser Range Finder
The LRF is set at a height of 1.0 m from the ground
and the range of the scan angle is fro m −95
◦
to +95
◦
.
The LRF can measure the distance between a P-Sen
and people or materials that are over a heig ht of 1.0
m. The step angle is 0.125
◦
, and th e number of steps
is 1520.
Deep Learning-based Prediction Method for People Flows and Their Anomalies
677
2.2 People Flow
Each P-Sen is equipped with multiple sensors that
can measure people flow. Using the network camera
in a P-Sen, we can imple ment people detection by
applying image processing such as background sub-
traction to the captured images. H owever, there are
privacy issues concerning facial image processing in
public spaces.
By analyzing the request signal collected by the
wireless LAN, it is possible to count the number of
surrounding wireless terminals. Because th e tim ing
of the reque st signal depen ds on the settings of va-
rious terminals, it is possible to estimate the number
of people around the P-Sen. We may also ne ed to
consider th e encryption of MAC addresses from the
viewpoint of privacy.
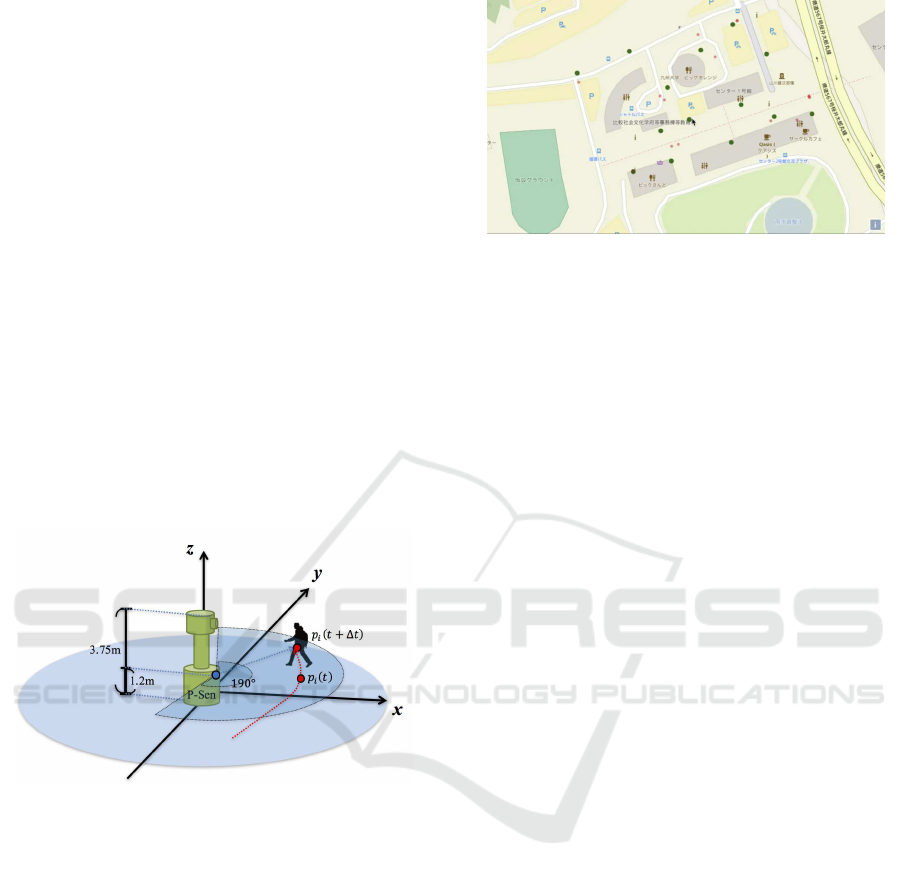
Using the LRF, we can measure the distance be -
tween a P-Sen and a human or ma terials accurately.
Moreover, as shown Fig. 3, it is possible to measure
the direction in which pe ople ar e moving with high
accuracy, and we do not need to consider privacy is-
sues.
Figure 3: People flow measurement area using the LRF in a
P-Sen.
Therefore, we use the LRF in each P-Sen to ana-
lyze people flow on campus. In this paper, we o btain
location information for people and objects in front
of each P-Sen at 0.1 second intervals by applying a
people and ob je c t detection method (Kurazume et al.,
2008) to the raw data sensed by the LRF.
Figure 4 shows an example of people flow measu-
red by a P-Sen on our campu s. In Fig. 4, th e loc ations
of the 14 P-Sens and the detected people are indicated
by the red and green points, respectively.
Figure 4: An example of people flow on our campus.
2.3 Anomaly Detection
We develop an on line anomaly detection algor ithm
based on the k-NN algorithm (Goldstein and Uchida,
2016) and calculate anomalies in people flows on our
campus in real time. In this paper, we divide the mea -
surement area in front of each P- Sen into 18 (= 3 ×6)
blocks and learn the anomaly detection model using
72-dim ensional vectors generated from the p ass fre-
quency in four directions every 10 minutes as shown
in Fig. 5. First, for recent 20 0days records in the
dataset, the k-nearest-neighbors at each block have to
be found. Then, an anomaly score is compute d using
the distance to the k-th-nearest-neighbor in each of 18
blocks.
This method can be used to learn an an omaly de-
tection model without train ing data. An example of
anomaly detection re la te d to people flows on our cam-
pus is sh own in Fig. 6, where the red regions indicate
an anomaly and the density of the red color represents
the anomaly score.
3 METHOD
We propose a method for predicting future people
flow that uses ca mpus people flow data collected over
a long period and deep learning. In addition, we pr o-
pose a convolutiona l neural network (CNN) based le-
arning model for directly pr e dicting future anomalies
using images genera te d by past people flow data.
3.1 Imaging of People Flow
In this sub-section, we consider a method for imaging
people flow in a short time period. Our ima ging pr o-
cess is based on the detected point passing frequency
in four dire c tions fo r the time pe riod T . The resolu-
tion of the image is W × H pixels.
We define a detected pe rson’s location at time t
to b e P
i
(t) = (x
i
(t),y
i
(t)), where i is a local ID given
ICPRAM 2017 - 6th International Conference on Pattern Recognition Applications and Methods
678
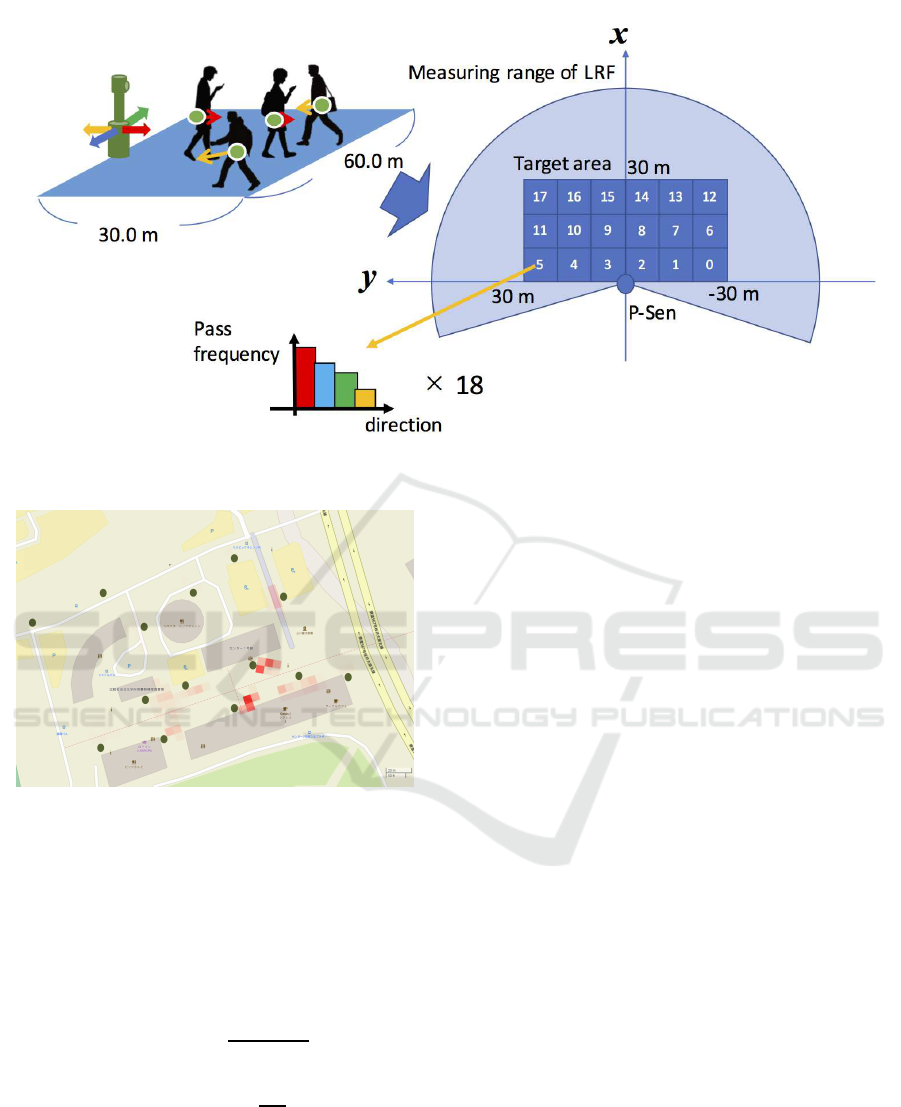
Figure 5: Quantization of people flow data.
Figure 6: An example of anomaly detection.
by the P-Sen to eac h detected person or object. The
coordinates x
i
(t) and y
i
(t) are quantized a s integers so
that 0 ≤ x
i
(t) ≤ H and 0 ≤ y
i
(t) ≤ W .
The measu red trajectory P
i
(t),t ∈ T , is divided
into sub-trajectories with a moving distance of 1.0
m. The travel time for each sub-trajectory is ∆t, and
the distance L
i
(t) and the dir ection θ
i
(t) from P
i
(t) to
P
i
(t + ∆t) are written as
L
i
(t) =
q
∆x
2
i
+ ∆y
2
i
,
θ
i
(t) = arctan
∆x
i
∆y
i
,
where
∆y
i
= y
i
(t + ∆t) − y
i
(t),
∆x
i
= x
i
(t + ∆t) − x
i
(t).
In each of the four quantized directions for the
time period T , the f our-channel image data I
T
d
,d =
1,2,3, 4, are g enerated by calculating the passing fre-
quency for the midpoint of the sub-trajectory. The
quantized direction d is determined using θ
i
(t) as fol-
lows:
d =
1, −π/4 ≤ θ
i
(t) < π/4,
2, π/4 ≤ θ
i
(t) < 3π/4,
3, 3π/4 ≤ θ
i
(t) < 5π/4,
4, 5π/4 ≤ θ
i
(t) < 7π/4.
(1)
The proposed algorithm for imaging people flow
data is sh own in Fig. 7.
3.2 People Flow Prediction
To p redict people flow, we propo se a learning model
based o n a discrete neural network (DNN) as shown in
Fig. 8. First, we generate images with 72 = 4 × 6 × 3
(4 ×W × H) pixels for each ten- minute (T ) period by
applying the pr oposed imaging algorithm to the pe-
ople flow data as described in sub-section 3.1. Using
the past people flow data at times t − 1 and t − 2, we
learn an hou rglass-ty pe DNN tha t can predict future
people flow data at time t. T he pair of 72-dimensiona l
vectors at times t − 1 and t − 2 is used as a n input to
the DNN, and the future people flow at tim e t is pre-
dicted by th e DNN.
3.3 Anomaly Prediction
We propose a CNN based anomaly prediction method
for people flow data. The proposed method uses four-
channel images, each of which is 60 × 30 (W × H)
pixels and covers a ten-minute period as described in
Deep Learning-based Prediction Method for People Flows and Their Anomalies
679
INPUT: P = {P
i
(t)| All trajectories at the time pe-
riod T }
OUTPUT: I
T
d
,d = 1,2, 3,4
for d = 1 to d = 4 do
for all (x, y) ∈ W × H do
I
T
d
(x,y) = 0
end for
end for
for all t ∈ T do
N
t
← Number of Local ID at Time t
for all i ∈ N
t
do
for all p
i
(t) ∈ P
i
(t) do
Compute θ
i
(t) of p
i
(t)
if −π/4 ≤ θ
i
(t) < π/4 then
d = 1
else if π/4 ≤ θ
i
(t) < 3π/4 then
d = 2
else if 3π/4 ≤ θ
i
(t) < 5π/4 then
d = 3
else if 5π/4 ≤ θ
i
(t) < 7π/4 then
d = 4
end if
end for
(x,y) ← (p
i
(t) + p
i
(t + ∆t))/2
I
T
d
(x,y)+ = 1
end for
end for
Figure 7: Algorithm for imaging of people flow.
Figure 8: Hourglass-type DNN.
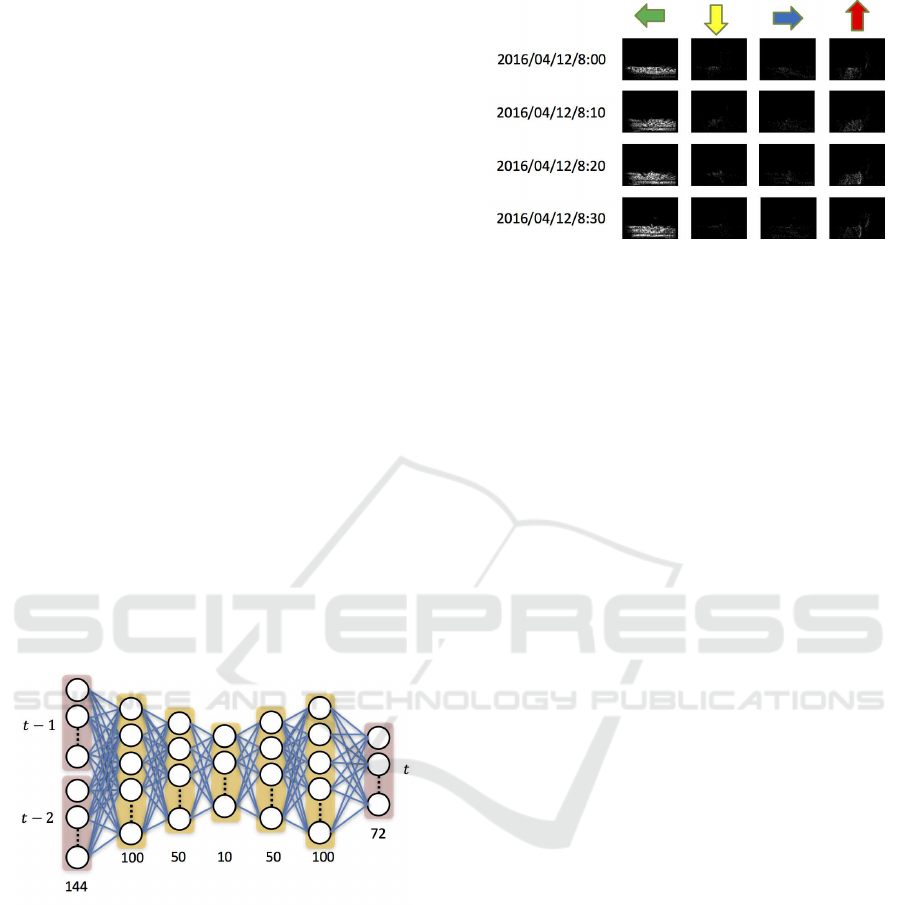
sub-section 3.1. Figure 9 shows an example of four-
channel people flow images.
In the proposed method, a set of people flow ima-
ges is generated using the campus peop le flow data
collected over a long period. We learn a CNN based
anomaly prediction m odel as shown in Fig. 10.
We use eight-channel image data, each of which
is 60 × 30pixels, generated by combining people flow
images at times t − 1 and t − 2 as the inputs to the
CNN, and obtain an 18 -dimensiona l anomaly pre-
diction vector for people flow at time t.
Figure 9: An example of people flow images.
4 EXPERIMENTS
4.1 Environment
We install 14 P-Sens in the central zon e o f the Ito
Campus of Kyushu University, and conduct experi-
ments using the measu rements of activity on cam-
pus. The population of this central area in the day-
time is over 5000. Therefore, there are some pla-
ces where cong estion occurs during ru sh hours and at
lunch time, such as around the restaurants, stores and
bus stops. Our first task is to develop an application
for congestion prediction at certain places on campus
using the sensor data obtained by th e P-Sens.
Figure 1 1 shows th e loca tions of the P-Sens in the
central are a of the campus. We place a P-Sen on ea ch
of the 14 red po ints shown in Fig. 11 facing in the
direction of the arrow. We construct a WSN by con-
necting the P-Sens. To collect and send the sensor
data to our analysis server, the fourth and tenth P-Sens
are connected to the core nodes, which a re linked to
the Internet. Because of this WSN and th e core nodes,
we can obtain sensing data from o ur analy sis server in
real time.
4.2 Results
We first conduct experiments to pre dict future people
flow using statistics from the accumulated people flow
data. In this experiment, the training data was accu-
mulated from April 20 16 to July 20 16 (4 months) by
P-Sen #10. Because this four month period is the first
semester for our university, the activities of m any stu-
dents were measured by the P- Sens. The test da ta
was accumulated during the month of October 2016,
which is the start of the second semester after sum-
mer vacation. Applying the proposed method des-
cribed in su b-section 3.2, we obtain the people flow
prediction mode l. The mean squared error (MSE ) for
the trainin g a nd validation sets by epoch ar e shown in
ICPRAM 2017 - 6th International Conference on Pattern Recognition Applications and Methods
680
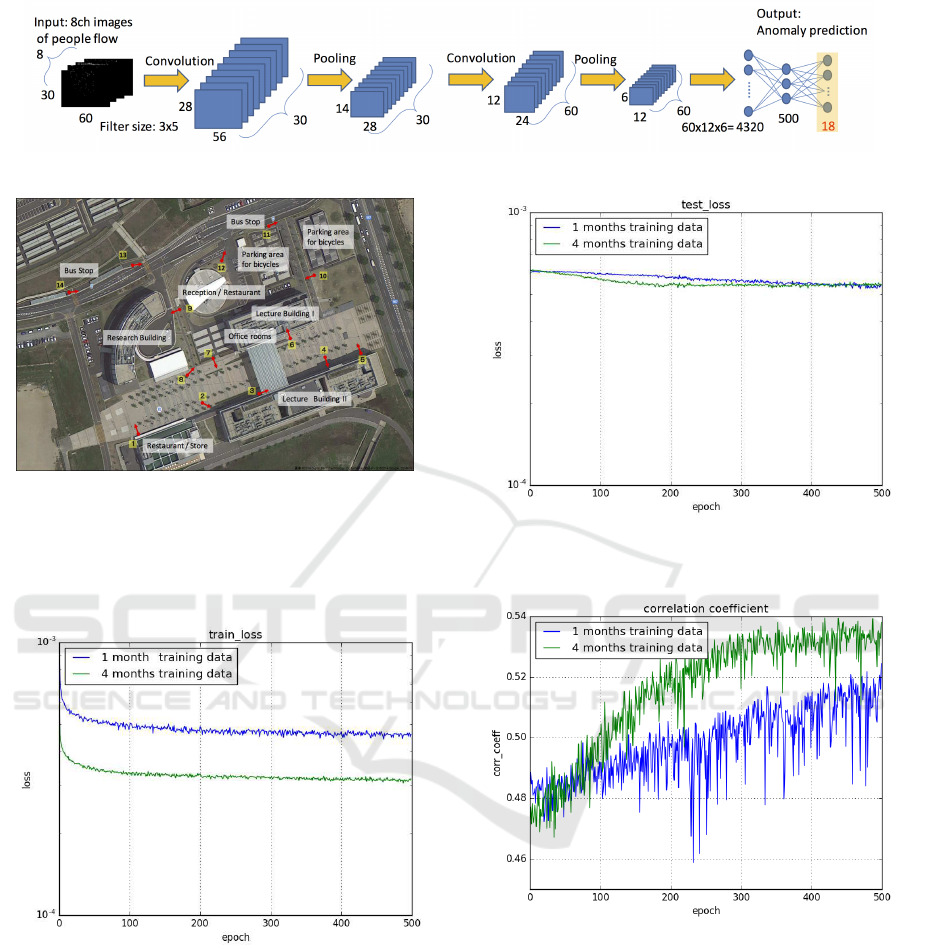
Figure 10: CNN for anomaly prediction.
Figure 11: The l ocations of the P-Sens.
Fig. 12 and Fig. 13. To estimate the accuracy of the
prediction, the mean correlation coefficient for each
epoch was also computed and is shown in Fig. 14.
Figure 12: MSE for the training set by epoch for people
flow prediction.
A second experiment was performed along using
data from the same place and period to learn and eva-
luate th e proposed anomaly prediction model descri-
bed in sub-sectio n 3.3, The MSE for the training and
validation sets by epoch are shown in Fig. 15 and Fig.
16. To estimate the accu racy of the prediction, the
mean correlation coefficient for each epoch was also
computed a nd is shown in Fig. 17.
Figure 13: MSE for t he validation set by epoch for people
flow prediction.
Figure 14: Mean correlation coefficient by epoch for people
flow prediction.
4.3 Discussion
The proposed prediction model is a data-driven sy-
stem realized by an unsupervised learn ing technique.
Our method can learn a model without the preparation
of training da ta in advance. In pa rticular, our experi-
ments suggest that prediction accuracy is improved
by using long-term training data a s shown in Fig. 17.
However, further verification of this is necessary.
In our feasibility study, each prediction model was
learned and verified using training data c ollected over
Deep Learning-based Prediction Method for People Flows and Their Anomalies
681
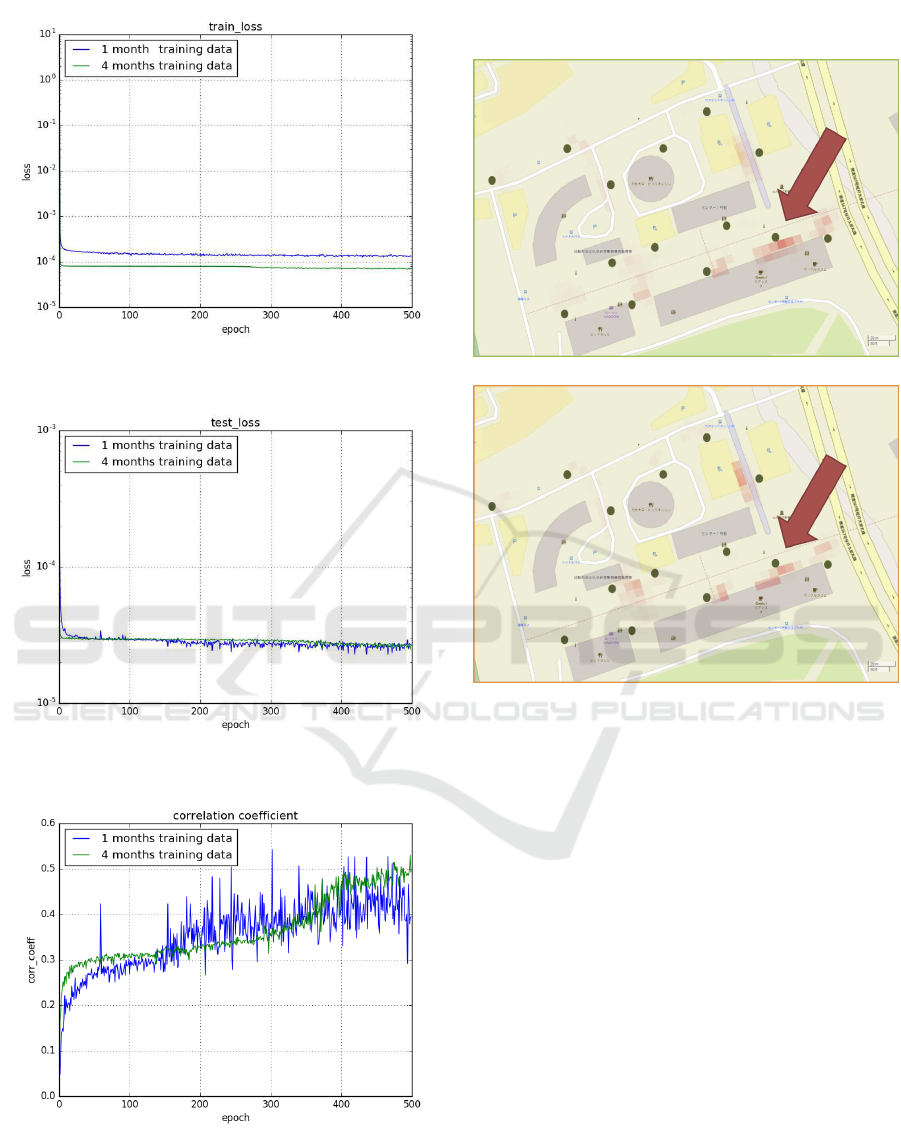
Figure 15: MSE for the training set by epoch for anomaly
prediction.
Figure 16: MSE f or the validation set by epoch for anomaly
prediction.
Figure 17: Mean correlation coefficient by epoch for ano-
maly prediction.
a short period (one month ) or over a long period (eight
months). We succeeded in predicting an anoma ly va-
lue tha t is close to the true value by using the long-
term prediction model as shown in Fig. 18.
(a) True anomaly
(b) Predicted anomaly
Figure 18: A n example of anomaly prediction.
5 CONCLUSIONS
In this paper, we have proposed learning metho ds ba-
sed on deep learning f or predicting people flow and
anomalies in people flow from data collected on our
campus. Our experiments show that we can learn mo-
dels for predicting people flow by using long-term
data accumulated at our university. In the future, we
plan to perform more analysis experiments and deve-
lop mobile applications for giving feedback on pre-
diction r e sults to our students.
ACKNOWLEDGMENTS
This research is supported by The Japan Science and
Technology Agency (JST) thr ough its “Center of In-
novation Science and Technology based Radical In-
novation and Entrepreneurship Program (COI Pro-
gram)”.
ICPRAM 2017 - 6th International Conference on Pattern Recognition Applications and Methods
682

REFERENCES
Al Nuaimi, E., Al Neyadi, H., Mohamed, N., and Al-
Jaroodi, J. (2015). Applications of big data to smart
cities. Journal of Internet Services and Applications,
6(1):25.
Cheng, B., Longo, S., Cirillo, F., Bauer, M., and Kovacs, E.
(2015). Building a big data platform for smart cities:
Experience and lessons from santander. In 2015 IEEE
International Congress on Big Data, pages 592–599.
Goldstein, M. and Uchida, S. (2016). A comparative eva-
luation of unsupervised anomaly detection algorithms
for multivariate data. PLoS ONE, 11(4).
Kurazume, R., Yamada, H., Murakami, K., Iwashita, Y.,
and Hasegawa, T. (2008). Target tracking using sir
and mcmc particle filters by multi ple cameras and la-
ser range fi nders. In Proceedings of the IEEE/RSJ In-
ternational Conference on Intelligent Robots and Sys-
tems, pages 3838–3844.
LeCun, Y., Bengio, Y., and H inton, G. (2015). Deep lear-
ning. Nature, 521(7553):436–444.
Vilajosana, I., Llosa, J., Martinez, B., Domingo-Prieto, M.,
Angles, A., and Vilajosana, X. (2013). Bootstrapping
smart cities through a self-sustainable model based
on big data flows. IEEE Communications Magazine,
51(6):128–134.
Deep Learning-based Prediction Method for People Flows and Their Anomalies
683
