
Anomaly Detection for an Elderly Person Watching System using
Multiple Power Consumption Models
Maiya Hori
1
, Tatsu ro Harada
1,2
and Rin-ichiro Taniguchi
1,3
1
Center for Co-Evolutional Social System, Kyushu University, Fukuoka, Japan
2
Research and Education Center of Carbon Resources, Kyushu University, Fukuoka, Japan
3
Graduate School of Information Science and Electrical Engineering, Kyushu University, Fukuoka, Japan
maiya-h@ieee.org, harada@cm.kyushu-u.ac.jp, rin@kyudai.jp
Keywords:
Safety, Anomaly Detection, P eople Activity Recognition.
Abstract:
We propose an anomaly detection method for watching elderly people using only the power data acquired by a
smart meter. In a conventional system that uses only power data, a warning is i ssued if the power consumption
does not increase after the wake-up time or when the amount of power does not change for a long time. These
methods need to set the wake-up time and power threshold for each user. Furthermore, wrong warnings are
issued while residents are out of the home. In our method, multiple common power consumption models are
created for each household for each short time zone, and a watching system is constructed by regarding the
gaps between these models and newly observed data as anomaly values. This can be automatically applied to
various situations such as “during sleep,” “during home activity” and “time zone for frequently going out in
the daytime.”
1 INTRODUCTION
According to a survey by the Cabinet Office, Govern-
ment of Japan (Cabinet Office, Governm ent of Japan,
2016), the to ta l population of Japan is 127.1 million
as of October 20 15. The population of elderly people
aged 65 a nd over is 33.92 million, which accounts for
26.7% of the total pop ulation. I t is estimated that the
aging rate will co ntinue to rise, reaching 39.9% in
2060, and at which time approximately 1 in 2. 5 pe-
ople will be ag e d 65 or over. Given this back groun d,
the development of a watching system that can recog-
nize an emergency situation involving the elderly is
desired from families living apart from the eld erly,
operators of nur sin g care services, and so on. Vari-
ous watching systems have been proposed and most
of them can notify the warning using a personal com-
puter, a smar tphone or by e-mail.
Various methods have b een proposed to detect an
anomaly in residents. Many systems monitor the lives
of elderly people by way of the installation o f various
sensors in houses and the performance of sensing in
real time (Doi et al., 2006) (Ota et al., 2011). Camera
and infrared sensors are representative examples, and
it is possible to monitor the behavior of residents with
high accuracy using these methods (Doi et al., 2006).
However, th e se methods have privacy problems, and
it cannot be said th a t the mental burden of residents
is small. Some systems monitor residents’ behavior
using sensors installed on electrical househo ld appli-
ances and doors frequently used in everyday life, such
as toilet doors and electric pots (kondo, 2 011) (Na-
kano and Ueno, 201 4). Residents can use watching
services while living their daily life. However, th e re
is a possibility th at detection may be delayed or mis-
recogn ition may occ ur when services are not used for
a long time. Nakano et al. (Nakano and Ueno, 2016)
created a watching system by estimating whether re si-
dents directly oper ated electrical equipment using the
full-load current o f househo lds measured every mi-
nute. This method took into account the living con-
ditions of reside nts by estimatin g the operating con-
dition of equipmen t deeply related to the daily living
behavior of residents. However, in formation on the
characteristics of electric appliances used in the home
is needed in advance. Because the afo rementioned
methods require the installation of new sensors, they
are difficult to use immediately in various households
at present.
Therefore, in this research, we propose an ano-
maly detection method for watching the elderly that
uses only power c onsumption data obtained every 30
minutes from a smart meter installed in each house-
hold. A smart meter is a device that can measur e the
Hori, M., Harada, T. and Taniguchi, R-i.
Anomaly Detection for an Elderly Person Watching System using Multiple Power Consumption Models.
DOI: 10.5220/0006247006690675
In Proceedings of the 6th International Conference on Pattern Recognition Applications and Methods (ICPRAM 2017), pages 669-675
ISBN: 978-989-758-222-6
Copyright
c
2017 by SCITEPRESS – Science and Technology Publications, Lda. All rights reserved
669

amount of electricity used and it has the communi-
cation functionality to allow remote meter reading. In
Japan, along with liberalization of electr ic ity retail sa-
les, the installation of smart meters in each household
is progressing, and it is planned that the installation in
all households will be c ompleted by the end of fiscal
year 2024 (Ministry of Economy, Trade and Industry,
). Our proposed method does not require the installa-
tion of new sensors and it can be applied to all house-
holds where smart meters are installed. Furthermore,
because only electric power data is used, the mental
burden of residents is small.
In a conventiona l system that uses o nly power
data, a warnin g is issued if the power consumption
does not increase after the wake-up time or when the
amount of power doe s not change for a long time.
These methods need to set the wake-up time and po-
wer threshold fo r each user. Furthermore, wrong
warnings are issued while residents are out of the
home. Additiona lly, because of the characteristics of
the method, it takes time to detect an anomaly.
There are many conventiona l methods for de-
tecting an anomaly with re spect to measurement data.
A k-nearest neighbor (k-NN) algorithm (Dasarath y,
1990) is one o f the anomaly detection methods that
detects an outlier va lue. Its advantage is that supervi-
sed data is not necessary for anomaly detection. By
applying these to power data, it is possible to detect
the tim e of power usage that is different from d a ily
life as an anomaly; however, this will not work as a
watching system.
In our method, the problems are overcome by defi-
ning features specialized for watching. The routine of
residents’ activities is learned automatically without
setting parameters o n the lifestyles for each re sident
by constructing different power consumption models
for each time zone. Furthermore, when newly obser-
ved da ta deviates from the generate d mode l, a war-
ning of an a nomaly is issued so that it is p ossible to
quickly detect an emergency situation.
2 ANOMALY DETECTION FOR
AN ELDERLY PERSON USING
MULTIPLE POWER
CONSUMPTION MODELS
In this study, we detect an anomaly for the watching
system when the fluctuation of the power consump-
tion is small and different from usual. As a re sult,
unlike a conventional method, even when the power
consumption is large, when the fluctuation of power
is sm a ll a nd it differs from usual consumption, it is
Figure 1: Flow of the proposed method.
detected as an anomaly. Furthermore, during sleep or
a time zone that the re sid ent often goes out, even when
the fluctuation of power is small, it is not detected as
an a nomaly.
Figure 1 shows the flow of the pro posed met-
hod. Fir st, power consumption d ata obtained from the
smart meter every 30 minutes is used for input. Next,
feature vectors are ge nerated using an index called a
non-ac tivity level. By accumulating this featur e vec-
tor, a c ommon distribution model is created, and the
gaps in the model are calculated for use as an anomaly
score. Finally, the transition of the anomaly score is
displayed for the eld erly per son watching system. De-
tails of e ach feature are described b elow.
2.1 Features for Anomaly Detection
To d etect an anomaly in the elderly, an index that in-
creases as the fluctuation of power decreases is neces-
sary. As an index that inc reases as the fluctuation of
power decreases, the reciprocal of the absolute value
of the power change can be considered:
v
t
=
1
|c
t
− c
t−1
|,
(1)
where c
t
represents the power consumption observed
at time t. When there is no power change, the value of
v
t
diverges to infinity. Therefore, when v
t
is used as
an index for watching, it can be detected only when
the power change is close to zero. Even if it is an ano-
maly, however, a minute change occurs in the electri-
cal power. A dditionally, in this case, it is necessary to
perform anomaly detection appropriately.
Therefore, in this study, we define the non-activity
level N
t
as
N
t
=
1
1 + exp(− av
t
),
(2)
ICPRAM 2017 - 6th International Conference on Pattern Recognition Applications and Methods
670
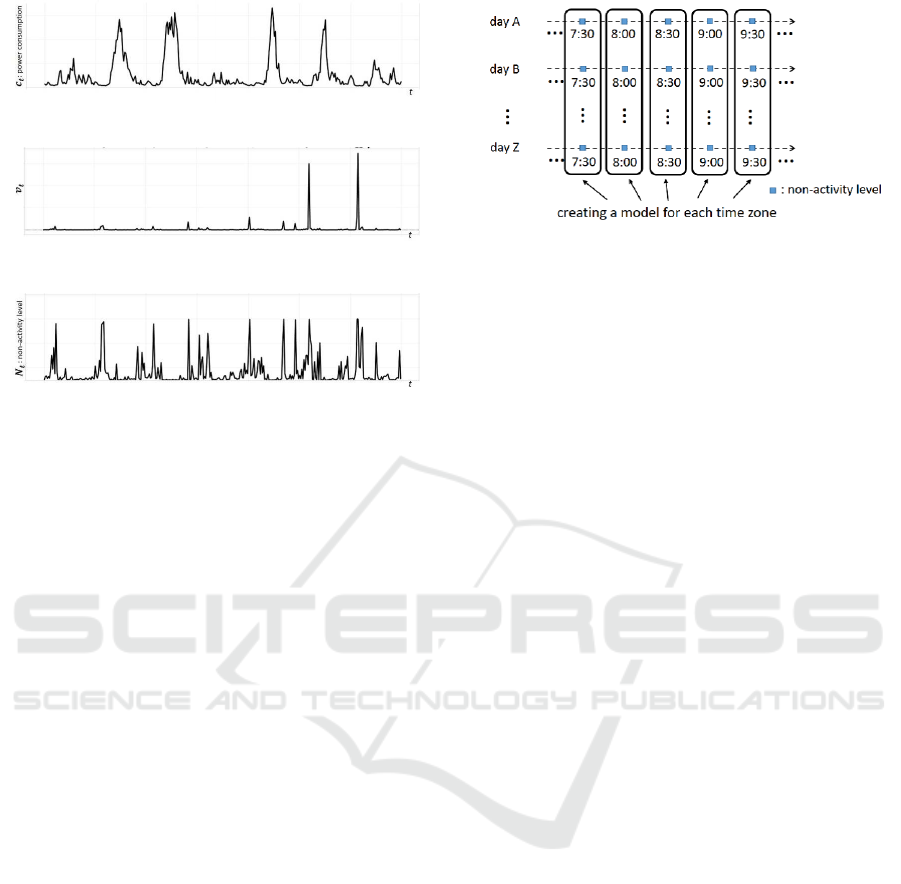
(a) Time series data wi th respect to the power consumption
of a household for a week.
(b) v
t
calculated by Equation (1) with respect to the time
series data of (a).
(c) Non-activity level calculated by Equation (2) with re-
spect to v
t
of (b).
Figure 2: Relationship between power consumption data
and the non-activity level.
Even if v
t
diverges to infinity, that is, when there is
no power change, N
t
converges to one. Furthermore,
by adjusting the coefficient a, it is possible to approx-
imate the value when there is no power change , even
when the electric power slightly changes. As a re-
sult, it is possible to detect an anomaly even when a
minute change occurs in electrical power when an el-
derly person is in an eme rgency situation. Note that
it is possible to detect an anomaly in a short time by
calculating N
t
at the sam e frequency as data acquisi-
tion.
Figure 2 shows an example of the relationship be-
tween actually observed power consumption data and
the non-a ctivity level. Figure 2 (a ) shows time se-
ries data with respect to the power consumption of
a household for a week. It can be observed that the
power consumption is large durin g the da y. Figure 2
(b) shows v
t
calculated by Equation (1) with respect
to the time series data of (a). As shown in this ex-
ample, v
t
has a large value when the change in the
power consumption in ( a) is close to zero. However,
even if this value is used for anomaly detection, it can
be de te cted only when the change in the power con-
sumption is close to zero. As a result, an anomaly
cannot be detected whe n a minute change occurs in
the power consumption . By contrast, (c) in Figure 2
is an example of plotting the non-activity level shown
in the expression (2). Particularly for the example of
a = 10, w e observe th at N
t
has a relatively large value,
even if there is a small change in the power consump-
tion. Common power consumption mode ls for each
time zone are constructed using the non-ac tivity level
Figure 3: Creation of multiple power consumption models.
calculated in this manner, and anomaly detection is
performed by the k-NN algorithm.
2.2 Creation of Multiple Common
Power Consumption Models
In our method, common power consumption models
are created and anomaly detec tion is pe rformed si-
multaneously with power measurement by regarding
the gaps between these models and newly observed
data as anomaly scores. The power consumption mo-
dels are created for each househ old to respond to the
diversity of residents’ behavior. If only one activity
model is generated by treating the non-activity le-
vels in all time zones, an anomaly cannot be detected
because many phenomena with a small power fluc-
tuation are observed during sleep. It is conceivable
to construct a model that assumes specific behaviors,
such as “during sleep,” “during home activity” and
“time zone for frequently going out in the daytime.”
However, it is difficult to assume all types of behavi-
ors because behaviors have diversity, and it is difficult
to address temporal deviations in customary behavior.
Therefore, in th is research , as shown in Figure
3, multiple mo dels are built for the same tim e zone
on different days. Because power consumption data
is acquired every 30 minutes, 48 models are genera-
ted for each household. The models described here
are not defined by mathematical expressions; they are
merely distributions of the non-activity levels. Mo-
dels that depend on the activity of a resident are crea-
ted for each time zone.
Figure 4 shows an example of the difference of
the distributions of the non-activity levels among dif-
ferent time zones. This is a visualization of the data
accumulated for three months for the non-activity le-
vels acq uired by a particular household. In this fi-
gure, the higher the density, the higher the observa-
tion freque ncy of the value, and conversely, a sparser
density indicates more unusual phenomena. Figure 4
(a) shows the distribution of th e non-activity levels at
Anomaly Detection for an Elderly Person Watching System using Multiple Power Consumption Models
671
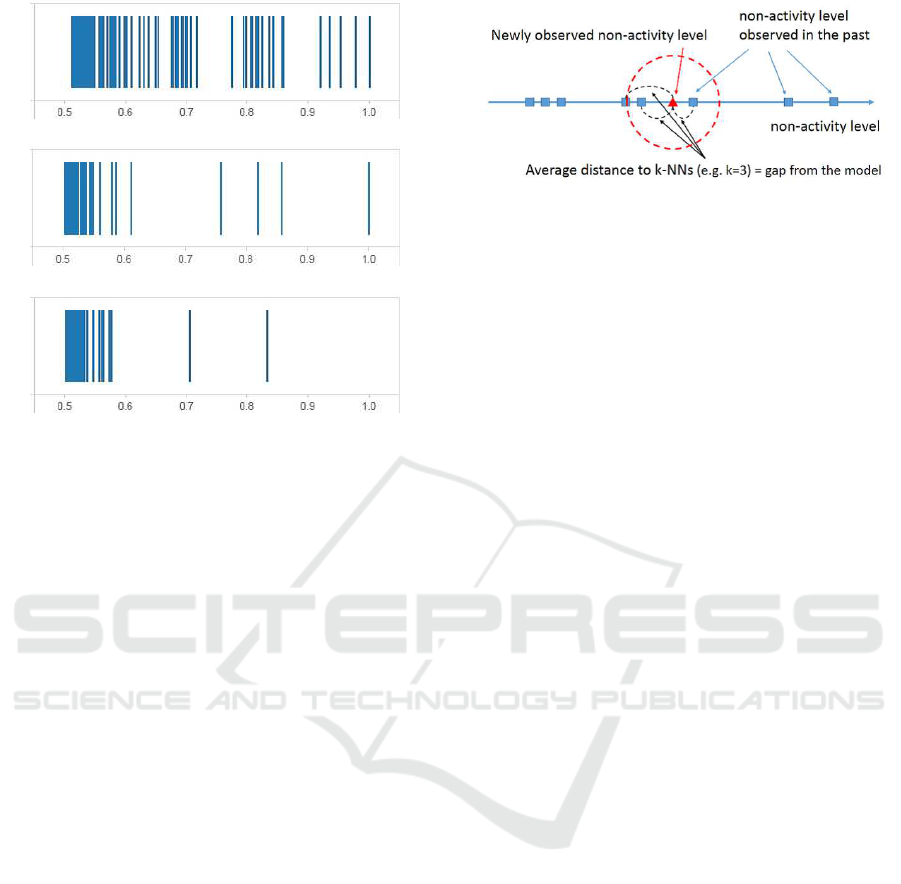
(a) Distribution of non-activity levels at 2:30 am.
(b) Distribution of non-activity level s at 7:30 am.
(c) Distribution of non-activity levels at 12:30 pm.
Figure 4: Difference of the distributions of the non-activity
level s among different time zones.
2:30 am. We know that the resident of this house-
hold goes to bed at this time on a daily basis. It is
found that the frequency at which the non-activity le-
vel shows a high value is high. Figure 4 (b) shows the
distribution of the non-activity levels at 7:30 am. We
know that the resident of this household has already
woken up at this time. It is understood that the fre-
quency at wh ich the non-activity level shows a high
value is not as high compared with case (a). Figure 4
(c) shows the distribution of the n on-activity levels at
12:30 pm. It is known that the resident of this hou-
sehold does not go ou t on a daily basis during this
time. It is found that th ere is almost no frequency for
which the non-activity level shows a high value. In
this method, for examp le , when a h igh value o f the
non-ac tivity level is newly observed during this time
zone, it is detected as an anomaly. As a result, it is
possible to respond flexibly to various activities wit-
hout explicitly defining the behavior of the reside nt,
such as “during sleep,” “during home activity” and
“time zone for frequently going out in the day time.”
In the above examples, N
t
(scalar) was used as
an index for the distribution models; however, in
our method, instead of N
t
, multidimensional vectors
{N
t
, N
t−1
, N
t−2
···} can be used. This makes it possi-
ble to detect anomalies on a long-term basis.
By configuring only the data at the time of th e nor-
mal pattern a s the accumulated past data, the advan-
tage is tha t there is no need to manually pre pare the
supervised data as observed in general m achine lear-
ning. Addition a lly, because of the characteristics of
the proposed method regarding setting the gaps f rom
Figure 5: An example of anomaly detection based on k-NN.
the non-activity level N
t
is used as an index of distribution
and this example shows an example when k = 3.
accumulated past data as anomalies, it is theoretically
possible to perform a calculation even if there are few
accumulated data. Furthermore, by automatically de-
leting past old data when constructing models, even
if the resident’s life routine changes, it is possible to
adapt flexibly.
2.3 Anomaly Detection Based on the
k-NN algorithm
In our method, multiple common power consumption
models are created for each hou sehold for each short
time zone, and a watching system is constructed b y
regarding the gaps between these models and n ewly
observed data as anomaly values. In the k -NN based
method, for the newly observed data, k nea rest neig-
hbor data is selected from the accumulated past data.
Next, we calculate the average distance from tho se k
data and use this as the anomaly score.
Figure 5 shows an example when k = 3. If the
newly observed data is anomaly data, the average dis-
tance increases, and if it is no rmal data, it decreases.
Parameter k is determined experimentally, but if you
set k to be small in gen eral, it becomes sensitive to
anomaly data , and conversely, it becomes insensitive
if it is set large.
In the above examples, the non-activity level N
t
(scalar) is used as an index for distribution mo-
dels, but if, instead of N
t
, multidimension a l vectors,
{N
t
, N
t−1
, N
t−2
···}, are used, th e distributions be-
come multidimention.
3 EXPERIMENTS
In this experiment, to show the effectiven ess of th e
proposed method, we verified whether anomaly de-
tection was properly performed by using actual po-
wer consumption data. The target was the power c on-
sumption data of an elderly single-person household
for three months from July 1 to September 30. The
ICPRAM 2017 - 6th International Conference on Pattern Recognition Applications and Methods
672
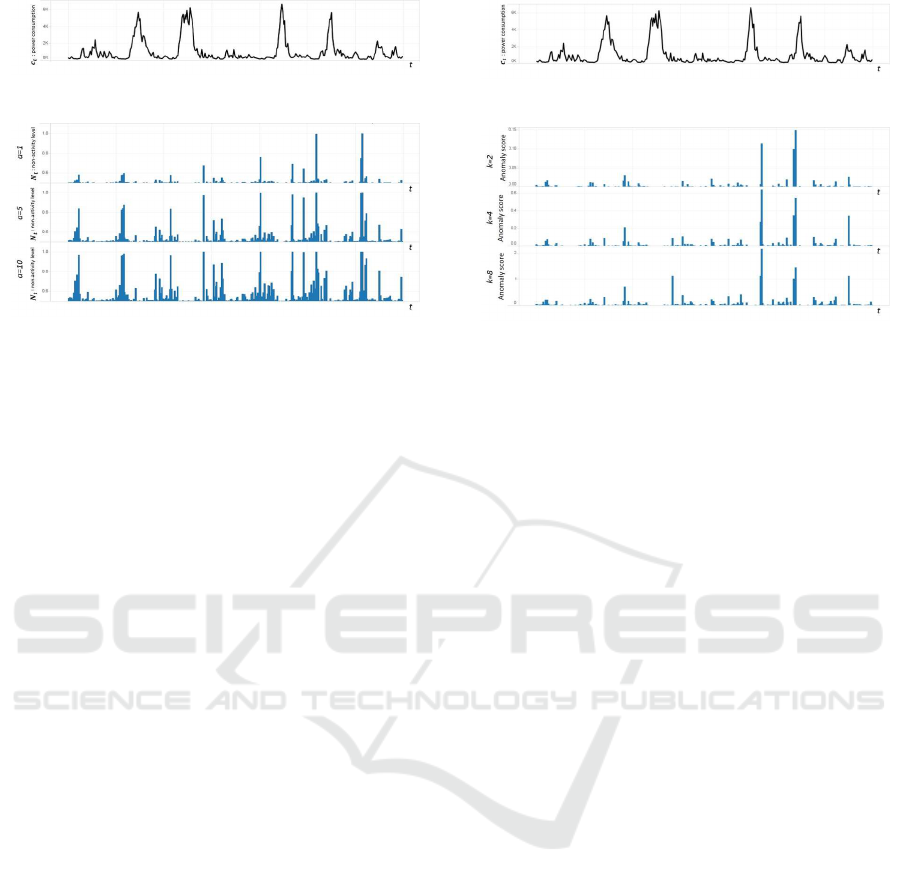
(a) Example of power consumption data for one week for
the target household.
(b) Comparison result of the non-activity levels. The upper
row of the figure shows the result of a = 1, the middle
row shows the result of a = 5 and the lower row shows the
result of a = 10.
Figure 6: Comparison result when a in Equation (2) is chan-
ged.
power consumption data was acquired by a smart me-
ter every 30 minutes.
First, as a preliminary expe riment, the comp arison
result when a in Equation (2) is changed is shown. Fi-
gure 6 shows data for one week for the target house-
hold.
Figure 6 (a) shows an example of power consump-
tion data for one week for the target household. Fi-
gure 6 (b) shows the comparison result of the non-
activity levels when a in Equation (2) is changed. The
upper row of the figure shows the result of a = 1,
the middle row shows the result of a = 5 an d the lo-
wer row shows the result of a = 10. It can be ob-
served that the non-activity level is large as a incre-
ases, even if there is a minute power chang e. When
a = 1, the non-activity level is small when there is a
minute power change. For anomaly detection, a was
found to require a somewhat larger value because a
minute change occurs in electrical power when an el-
derly person is in an emergency situation. Ther efore,
for all subsequent experiments, we used a = 10.
Next, a s a preliminary experiment, the com pari-
son result when k of th e k-NN algorithm changed is
shown. Figure 7 sh ows o ne wee k’s data for the hou-
sehold of the same subjec t as the previous prelimi-
nary experiment. Figur e 7 (a) shows an example of
power consum ption data for one week fo r the target
household. Figure 7 ( b) shows the comparison result
of the anomaly scores when k of the k-N N algorithm
is c hanged . The upper row of the figure shows th e re-
sult of k = 2, the middle row sh ows the result of k = 4
and the lower row shows the result of k = 8. In this ex-
periment, the total number of data of the accumulated
non-ac tivity levels is 91. If k = 1, the data is sensitive
(a) Example of power consumption data for one week for
the target household.
(b) Comparison result of the anomaly scores. The upper
row of the figure shows the result of k = 2, the middle row
shows the result of k = 4 and the lower row shows the result
of k = 8.
Figure 7: Comparison result when k of the k-NN algorithm
is changed.
to an anomaly, and conversely if k = 8, the data be-
comes insensitive to an anomaly. For all subseq uent
experiments, we used k = 4.
Figure 8 shows the results of the anomaly scores
on a particular day.
Figure 8 (a) shows an example of a small anomaly
score. This is a pattern that is comm on in everyday
life. Figure 8 (b) shows an example of a small ano-
maly score. In this case, although the fluctuation of
power is small, similar patterns were obser ved for the
same time zon e . This sh ould not be detected as an
anomaly because this is a typical pa ttern tha t occur-
red during sleep. Figure 8 (c) shows an example of a
small anomaly score. In this case, although the po-
wer consumption is less than usual, the fluctuation
of power is large. This case may be incurred when
not using equipm ent that consumes large amounts o f
electrical power, such as coolin g and heating equip-
ment. Figure 8 (d) and (e) show examples of large
anomaly scores. In th ese cases, the fluctuation of po-
wer is small even tho ugh it is different from usua l.
This case may be incurred when the elderly person
does not get up in the morning. Figure 8 (f ) shows an
example of a large anomaly score. In this case, the
power consumption is large; however, the fluctuation
of power is small. For the elderly watching system, it
is important to jedge as an anomaly in this case.
The above results ar e visu alized in real time and
shown to the families living apart from the elderly pe-
ople, operators of nursing care services, an d so on. Fi-
gure 9 shows the transition of the anomaly score over
three months. It is understood that a high anomaly
score is observed approximately 30 times in th ree
months. Vigilance is necessary, especially when the
Anomaly Detection for an Elderly Person Watching System using Multiple Power Consumption Models
673
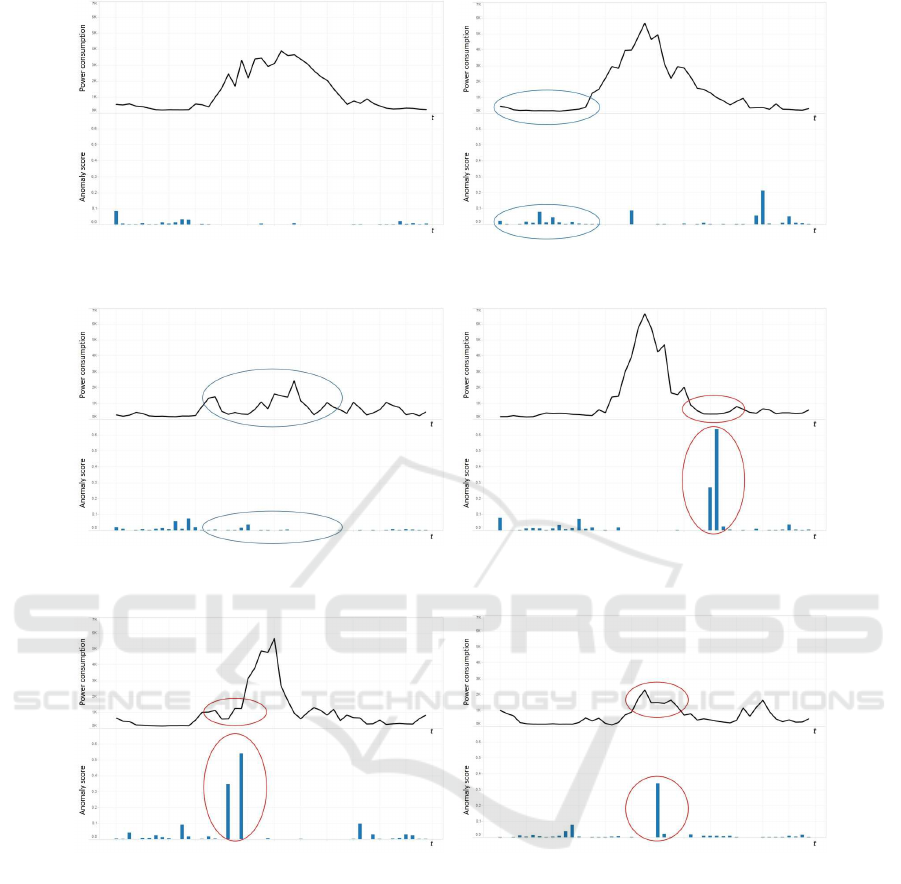
(a) Example of a small anomaly score. This is a pat-
tern that is common in everyday life.
(b) Example of a small anomaly score. In this case,
although the fluctuation of power is small, similar
patterns have been observed at the same time zone.
(c) Example of a small anomaly score. In this case,
although the power consumption is less than usual,
the fluctuation of power is large.
(d) Example of a l arge anomaly score. In this case,
the fluctuation of power is small even though it is dif-
ferent from usual.
(e) Example of a large anomaly score. In this case,
the fluctuation of power is small even though it is dif-
ferent from usual.
(f) Example of a large anomaly score. In this case,
the power consumption is l arge, but the fluctuation
of power is small.
Figure 8: Examples of anomaly scores estimated by the proposed method. Each upper row shows the power consumption
data of one day and each lower row shows the result of anomaly score.
anomaly score is high continuously.
4 DISCUSSION
As shown in Figure 8, it is possible to automati-
cally detect anomalies for various patterns by con -
structing multiple com mon power consumption mo-
dels for each time zone and using the k-NN method
to r egar d the g a ps between these models and newly
observed d a ta as anom aly scores. Detecting a speci-
fic pattern is possible with the conventional method;
however, not only it is necessary to set parameters for
each household, but also only some typical patterns
can be detected. Although our method has two va-
riable parameter s, a in Equation (2) and k of the k-
NN a lgorithm, it is no t necessary to change these in
particular, and the parameters determined during the
preliminar y expe riment c an also be applied to other
households.
A limitatio n of the proposed method is th a t an
ICPRAM 2017 - 6th International Conference on Pattern Recognition Applications and Methods
674
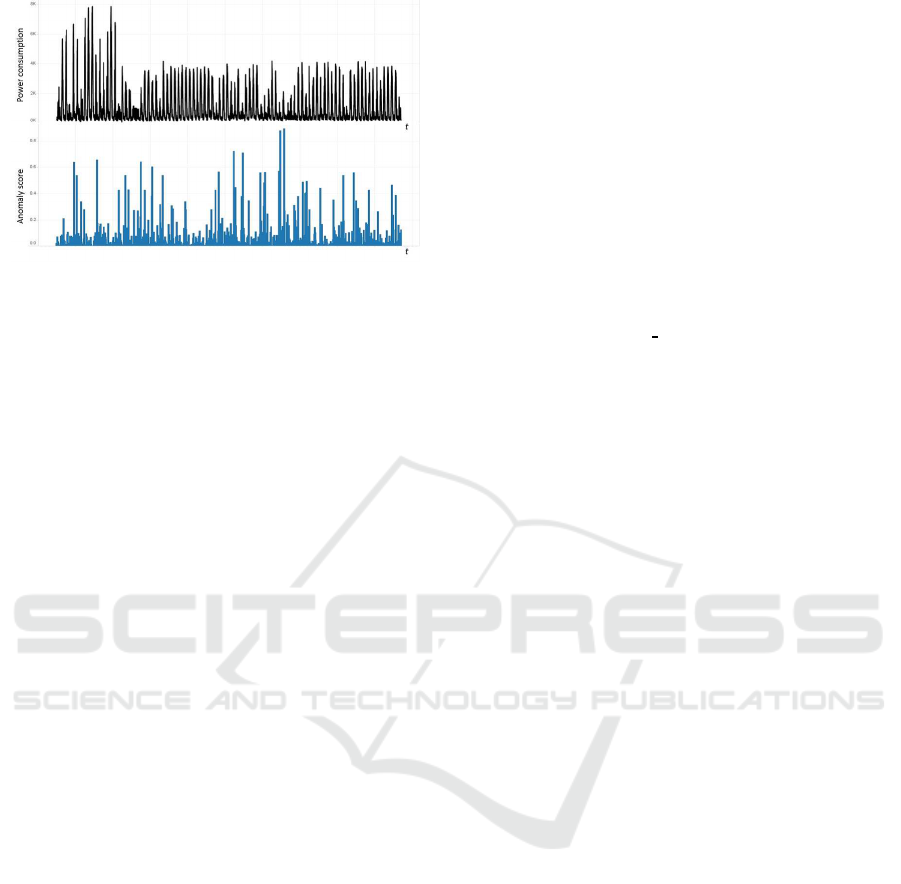
Figure 9: Transition of the anomaly score.
anomaly is barely detected w hen various power con-
sumption patterns are observed. This is one of th e
limitations of the k-NN algorithm, which ma kes th e
gaps from the normal pattern anomalous. To over-
come this limitation, it is necessary to arrange the
data when constructing a normal pattern model. Be-
cause there are four seasons in one year in Japan, and
a person ’s life pattern gradually changes in each sea-
son. We believe that it is possible to respond to these
changes using data from approximately three months
in the near future, that is, not using all past data, when
generating the distribution model. Hence, in the ex-
periment, we used data for three months fro m July 1
to September 30. Thus, it is possible to respond au-
tomatically when a life pattern changes for reasons
other than the influence of the season.
5 CONCLUSIONS
We p roposed an anomaly detection method for wat-
ching elderly people using only the power data acqui-
red by a smart meter. Multiple common power con-
sumption models were constructed for each time zone
and an omaly detection for watching the elderly was
condu c te d using th e k-NN algorithm to regard the
gaps between these m odels and newly observed data
as anomaly scores. As a result, it was possible to re-
spond flexibly to various activities without explicitly
defining the behavior of the resident, such as “during
sleep,” “during home activity” and “time zone for fre-
quently going out in the daytime.”
A future task is to conduct demonstration expe-
riments on elder ly people and implement social ex-
periments in cooperation with local governments. To
operate in the real world , we will need to properly set
the timing to notify u s of an anomaly by considering
the opinions of families living apart from the elderly
and operators of nursing care services.
ACKNOWLEDGEMENTS
This research was supported by the Japan Science
and Technology Agency (JST) through its Center of
Innovation: Science and Tech nology Based Radi-
cal Innovation and Entrepreneurship Program (COI
STREAM).
REFERENCES
Cabinet Office, Government of Japan (2016).
Annual report on the aging society.
http://www8.cao.go.jp/kourei/whitepaper/w-
2016/zenbun/28pdf
index.html.
Dasarathy, B. V. (1990). Nearest Neighbor: Pattern Classi-
fication Techniques. IE EE Computer Society.
Doi, M., Inoue, H., Aoki, Y., and Oshiro, O. (2006). Video
surveillance system for elderly person living alone by
person tracking and fall detection. IEEJ Transactions
on Sensors and Micromachines, 126(8):457–463.
kondo, S. (2011). Safety confirmation system for elderly
single-person household with sensor systems. IEEJ
Transactions on Electronics, Information and Sys-
tems, 131(7):1293–1297.
Ministry of Economy, Trade and Industry.
http://www.meti.go.jp/english/index.html.
Nakano, Y. and Ueno, T. (2014). Sensor data classification
for indoor situations using the multifunctional outlet.
IEEJ Transactions on Electronics, Information and
Systems, 134(7):949–955.
Nakano, Y. and Ueno, T. (2016). Watching system for
aged single person based on electricity use. IEEJ
Transactions on Electronics, Information and Sys-
tems, 136(6):767–774.
Ota, K., Otsu, M., Ota, Y., and Kajiwara, A. (2011).
Elderly-care motion monitoring sensor using ultra-
wideband radio. IEEJ Transactions on Electronics,
Information and Systems, 131(9):1547–1552.
Anomaly Detection for an Elderly Person Watching System using Multiple Power Consumption Models
675
