
A Low Cost Wireless System to Monitor Plantar Pressure using
Insole Sensor: Feasibility Approach
Renato Varoto
1
, Gustavo Casagrande Oliveira
2
, Adolfo Victor Freire de Lima
2
,
Matheus Missola Critter
2
and Alberto Cliquet Jr.
1,2
1
Department of Orthopedics and Traumatology, University of Campinas (UNICAMP), Campinas, Brazil
2
Department of Electrical and Computer Engineering, University of São Paulo (USP), São Carlos, Brazil
Keywords: Plantar Pressure Monitoring, Insole Pressure Sensor, Baropodometry, Java Application, Bluetooth Device.
Abstract: Plantar pressure analysis is an important strategy applied in clinical, orthopaedics, sports and rehabilitation
studies. In this context, this work describes the development and application of wireless system to monitor
plantar pressure. This system is composed by a data acquisition module based on low cost electronic
instrumentation, high resolution insole flexible pressure sensor and Java application for data real-time
visualization. To verify the feasibility and effectiveness of the system, workbench tests were realized and a
healthy subject performed pilot trials based on static and dynamic activities on the biomechanics platform.
According to the preliminary results, this system is effective to show the interaction between the foot and
floor in static and dynamic conditions, presenting a measurement range of pressure of 0-300kPa and rapid
response, among other features. Thus, this system is a feasible tool for quick and practical mapping of plantar
pressure.
1 INTRODUCTION
Plantar pressure monitoring is an important tool
applied in clinical, sports and rehabilitation studies.
The systems that include this technology can identify
pathologies, characterize gait cycles and evaluate
standing posture (Hills et al., 2001; Girard et al.,
2010; Bellizzi et al., 2011; Kaercher et al. 2011;
Chapman et al., 2013; Ledoux et al., 2013; Robinson
et al., 2013; Melvin et al., 2014).
Many researchers have developed self-
constructed plantar pressure measurement systems
(Castro and Cliquet, 2000; Smith et al., 2002; Saito et
al., 2011; Crea et al., 2014; Motha, Kim and Kim,
2015; Tan et al., 2015). However, the development of
these self-constructed devices requires time and a
validation procedure. An alternative is the use of
commercial pressure measurement systems.
Nowadays, some commercial systems stand out in
the analysis of motion and gait. Freemed
Baropodometric Platform (Sensor Medica SAS,
Guidonia Montecelio, Rome, Italy) allows assessing
balance, and detecting the foot loads and patient's
posture during walking/running and standing.
The Medilogic Insole (T&T Medilogic
Medizintechnik GmbH, Schönefeld, Brandenburg,
Germany) uses flexible insoles with up to 200
resistive sensors to detect the plantar pressure
distribution. This system is an acceptable tool for
measuring ground reaction forces in work activities,
except for kneeling positions (Koch et al., 2016).
The Pedar System (Novel GmbH, Munich,
Bavaria, Germany) is a measuring system for
monitoring pressure between the foot and footwear.
Elastic insoles with up to 99 capacitive sensors that
cover the entire plantar surface detect the pressure.
The F-Scan System (Tekscan, Inc., Boston, MA,
USA) employs flexible tactile resistive sensor (up to
954 sensels) to obtain dynamic information about foot
function and gait.
Flexible tactile sensor for measuring pressure
distribution consists of two flexible substrates joined
by adhesive and dielectric layers. Electrodes of both
substrates establish a matrix of rows and columns,
and each intersection forms a sensing element (SE)
that changes its electrical resistance (R
s
) when force
is applied to it (Test & Measurement, 2014; Podoloff
et al., 1991).
For flexible pressure sensor is recommended to
follow the 100/70 Rule. Thus, 100% of the force
should be concentrated within the sensing area of
Varoto R., Oliveira G., de Lima A., Critter M. and Cliquet Jr. A.
A Low Cost Wireless System to Monitor Plantar Pressure using Insole Sensor: Feasibility Approach.
DOI: 10.5220/0006246402070214
In Proceedings of the 10th International Joint Conference on Biomedical Engineering Systems and Technologies (BIOSTEC 2017), pages 207-214
ISBN: 978-989-758-216-5
Copyright
c
2017 by SCITEPRESS – Science and Technology Publications, Lda. All rights reserved
207
sensor, and 70-85% of the sensing area should be
loaded. It is advisable to use a load actuator to
distribute and to point the load (Flexiforce® Force
Sensor Design & Integration Guide, 2015).
Price, Parker and Nester (2016) evaluated
Medilogic, F-Scan and Pedar systems in relation to
validity and repeatability. According to them, Pedar
system presented greatest accuracy and repeatability
when compared to Medilogic and F-Scan systems.
Using bench tests and subjects walking on a
treadmill, McPoil, Cornwall and Yamada (1995)
compared Emed (Novel GmbH, Munich, Bavaria,
Germany) and F-Scan systems. High level of validity
and reliability were reached by Emed whereas F-Scan
was not satisfatory for certain measurements. Similar
results were obtained by Hsiao, Guan and Weatherly
(2002) through bench experiments.
This paper describes the development and
application of wireless system to monitor plantar
pressure. The system is composed by a data
acquisition module based on low cost electronic
instrumentation (less than US$20.00), high resolution
flexible pressure sensor and Java application for data
visualization. This system was designed for quick and
practical mapping of plantar pressure, representing an
auxiliary tool for orthopaedics and biomechanical
studies. To verify the feasibility of the system,
workbench tests were realized and a healthy subject
performed pilot trials based on static and dynamic
activities on biomechanics platform.
2 MATERIAL AND METHODS
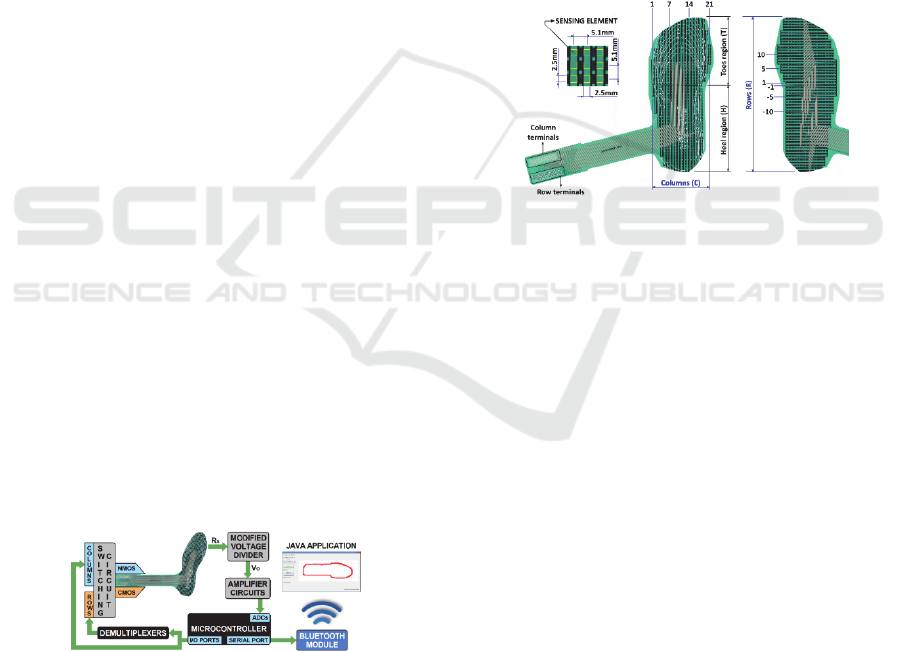
The system is composed by insole pressure sensor,
data acquisition module and Java application. The
microcontroller associated with the switching circuit
selects a SE, doing a scanning procedure, and
performs analog to digital conversion of voltage from
amplifier circuits (Figure 1).
Figure 1: Block diagram of the system.
The switching circuit, including modified voltage
dividers, convert R
s
into voltage (V
O
). Furthermore,
the microcontroller provides serial data to Bluetooth
module that sends it to Java application.
2.1 Insole Pressure Sensor and
Apparatus for Characterization of
Its Sensing Element
In this work, Medical Sensor 3000 (Tekscan, Inc.,
Boston, MA, USA) was used as insole pressure
sensor. This sensor presents a foot-shaped area, and it
can be trimmed to some sizes according to the
reference lines. Top substrate has 60 electrodes that
extend in widthwise in relation to the foot (rows). In
lengthwise direction, bottom substrate presents two
electrode sets - named as toes region (T) and heel
region (H) - with 21 and 18 electrodes, respectively
(columns). For convenience, columns were numbered
from terminal side and rows were numbered from the
border of two regions of bottom substrate, positive
values for T and negative values for H (Figure 2).
Figure 2: Bottom and top views of Medical Sensor 3000.
Columns and rows have width of 2.5mm and
inter-electrode spacing of 5.1mm. The intersections
between columns and row in sensor area create 954
SEs with area of 6.25mm
2
. Force applied to opposite
sides of the sensor changes the resistance of pressure-
sensitive resistive material of each SE as a function of
the force magnitude (Medical Sensor 3000; Podoloff
et al., 1991).
Medical Sensor 3000 trimmed for U.S. footwear
size 8 (26cm) were available for the developed
system. Thus, this sensor presents 52 rows (1 – 23 and
-1 – -29) and 29 columns (T3 – T18 and H4 – H16)
monitored by electronic circuit.
According to the 100/70 Rule, a squared load
actuator of 4.84mm
2
(PVC) was used to concentrate
and to point the load within the SE. This load actuator
was fixed on SE analyzed by double-sided tape
(Figure 3a).
The structure showed in figure 3c was built in
digital precision weight scale AS2000C (Marte
Científica, São Paulo, SP, Brazil) to allow application
of loads on the sensor, avoiding shear forces. For this,
a polymer sleeve associated with a shaft of 50mm was
fixed on its top (Figure 3b). The lower end of the shaft
acts on the load actuator, while the upper end receives
BIODEVICES 2017 - 10th International Conference on Biomedical Electronics and Devices
208
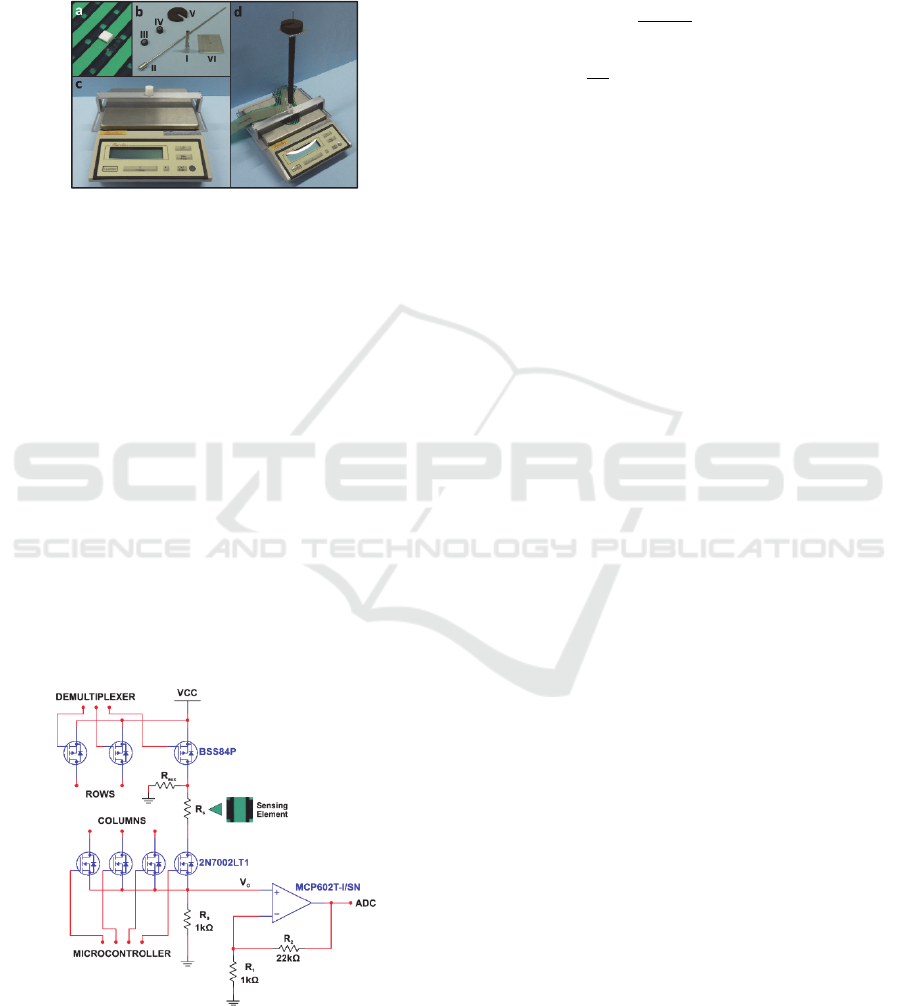
the support of loads. The applied loads resulting from
the weight of: the support (7.3g), 10 blocks of 5g
(
+0,7g
-0,4g
), 15 blocks of 10g (
+0.4g
-1.0g
), support plate of 21.4g
and two blocks of 100g (±0.1g). Moreover, the load
due to the weight of the shaft (12.8g) was also
considered.
Figure 3: a) Load actuator fixed on SE; b) I - shaft, II -
support of loads, III - 5g block, IV - 10g block, V - 100g
block, VI - support plate; c) Custom built structure in
weight scale; d) All loads applied to the SE; sensor fixed on
weight scale plate.
Thus, 30 load levels were used for the
characterization of SE (Figure 3d). The weight scale
determined the exact value of each level during the
application.
2.2 Data Acquisition Module
Data acquisition circuit was based on the modified
voltage divider associated with the noninverting
amplifier (Figure 4). As noted in the workbench tests
(described hereafter) a linear relationship can be
adopted between applied pressure and electrical
conductance (C
s
) of the SE, and the R
s
varies between
dozens of MΩ and 100kΩ for pressure range of 0 to
900kPa.
Figure 4: Schematic of data acquisition circuit, including
switching circuit to select each SE. Whole circuit has eight
sets with four NMOS and one operational amplifier.
About the modified voltage divider, V
O
is given
by equation 1. Since R
0
is much lower than R
s
the
equation 2 can be adopted. Thus, V
O
is proportional
to C
S
, which establishes a linear relationship between
applied pressure and V
O
. The noninverting amplifier
provides a gain of 10V/V.
V
O
=
R
0
R
0
+R
S
VCC
(1)
V
O
=
1
R
S
R
0
VCC = C
S
R
0
VCC (2)
MOSFETs form the switching circuit. The
electronic switching that selects the SE of insole
pressure sensor is made by row and column. The rows
and columns are energized when PMOS (null base
voltage) and NMOS (positive base voltage) are turned
on, respectively. Thus, R
S
is selected when both
switches are closed.
The microcontroller ATmega48 (Atmel
Corporation, San Jose, California, USA) triggers both
switches of each data acquisition circuit. It was used
four ports (PD6, PB7, PD5 and PB6) to select the
column, and each port was associated to an NMOS.
To determine the row, four ports (PB0, PB1, PB2
and PB3) act in four inputs of two demultiplexers, and
two ports (PB4 and PD7) enable one of these
demultiplexers. Each one of 32 outputs of
demultiplexers was associated to one PMOS.
Finally, the operational amplifiers provides an
amplified signal for each 10-bit analog to digital
converter (ADC0 to ADC7) of the microcontroller.
In addition to selecting row and column, when the
microcontroller is powered on, three functions are
initialized: ADCs, I/O ports (configured as outputs)
and serial port.
In relation to the serial port, the following
configurations were set: double transmission speed,
data transmission enabled, no parity, asynchronous
communication, one stop bit and word of 8 bits.
Moreover, according to the maximum baud rate of
Bluetooth module (115.2kbps), the baud rate was set
to 111.1kbps (clock of 8MHz).
The Bluetooth module HC-06 (Guangzhou HC
Information Technology Co., Ltd., Guangzhou,
Guangdong, China) transmits data from the
microcontroller to other devices. This module
receives a serial word in its RX port and sends it to
paired devices. The transmission protocol is based on
a start byte (255) followed by a data vector, it being
made the synchronization between the transmitter and
receiver for each start byte.
Entire electronic circuit was mounted on two
double-face printed circuit boards, which also work
as custom-built connector for insole pressure sensor.
A Low Cost Wireless System to Monitor Plantar Pressure using Insole Sensor: Feasibility Approach
209

Two demultiplexers, 32 PMOS and SMD resistors
were mounted in the top board. Bottom board
received the microcontroller, 32 NMOS, four
operational amplifiers and Bluetooth module. Data
acquisition module is powered by one 9V battery.
2.3 Java Application
The software written in Java Programming Language
creates an image corresponding to the applied
pressure in sensor. The BlueCove Application
Programming Interface (API) used allows receiving
data from the data acquisition module. This API is a
Java library for Bluetooth.
This software consists of two main classes. The
PalmilhaThird class contains the main method, which
runs when the software is started. It creates a visible
window that displays the program’s graphic user
interface (GUI) by invoking the constructor of the
second main class, JFrame. JFrame specifies all the
methods and components that will be available in the
program’s GUI. It also has two inner classes:
Bluetooth, which handles Bluetooth communication,
and MainPanel, which creates an image representing
the SEs inside the GUI.
JFrame’s constructor invokes the initComponents
method, which initializes all the components of the
GUI and configures its layout. Among the GUI’s
components, there are buttons that invoke methods.
In the image, which is also a component of the GUI
and is created by the MainPanel inner class, each
pixel represents one SE, and its value and color are
associated with the acquired pressure data, ranging
from white (null pressure) to full intensity red
(maximum pressure). MainPanel calculates the
difference between the SE output value and the
associated reference value. The bigger the difference,
the more intense the red color of the pixel will be.
Using RGB triplet, the colors belong to red scale from
(255,255,255) to (255,5,5), that is, green and blue
intensity values are associated and vary according to
the pressure.
This application reads data provided from the
Bluetooth connection and refreshes the images
(25Hz) simultaneously, because it is composed in
threads. Control of the image’s pixels is performed in
the tmain thread, which is created by the JFrame’s
constructor and runs parallel to the bt thread. This
thread is created using the Bluetooth inner class after
a connection to a Bluetooth device was established.
Bluetooth has methods that perform the search for,
establish and close a connection to Bluetooth devices
(through default password 1234 for Bluetooth module
HC-06), and read the SEs output values. The latter
method saves the output values in a vector, for future
comparison with the reference values, and
implements a protocol to accelerate reception of
repeated bytes, as it was observed that the “zero” byte
is received frequently. In this protocol, if a byte is
repeated more than four times, it’s transmitted as a
sequence of 4 bytes. The first byte holds the flag value
(254), the second holds the value of the repeated byte,
and the third and fourth byte hold the MSB and LSB
of the number of times the value was repeated.
2.4 Workbench Tests for Sensor
Characterization and Verification
of System Performance
First stage of workbench tests was based on applying
30 load levels within one SE of sensor. For each load
values the R
s
was measured by means of a digital
multimeter 17B+ (Fluke Corporation, Everett, WA,
USA), allowing to observe the relationship between
pressure and R
s
. This activity was repeated five times,
and mean and standard deviation (SD) were
calculated for the R
s
and pressure. The relationship
between the C
s
and the pressure was also established.
According to the position numbering (row,
column) described previously, analyzed SE was (-
26,11H) – region of heel.
This same procedure was performed for complete
system, that is, insole pressure sensor connected to
the data acquisition module and the software that
displays data acquired by means of wireless
connection. Thus, the pressure employed was
associated to the color intensity of graphic element
that represents the SE.
The Biomechanics Platform OR6-7-1000 (AMTI
Advanced Mechanical Technology, Inc., Watertown,
MA, USA) was used to verify the system
performance (Figure 5). This equipment presents a
sample rate equals to 240samples/s and all data are
processed by low pass filter (10.5Hz).
Figure 5: Biomechanics Platform – sign convention for the
force and moment components defined by AMTI.
A healthy subject fixed the data acquisition
module on his right leg by Velcro strap and placed the
insole sensor pressure in the right footwear. Firstly,
the load due to subject’s body mass was measured.
The verification of system performance was based
on two activities (static and dynamic). During static
BIODEVICES 2017 - 10th International Conference on Biomedical Electronics and Devices
210
activity, the subject transferred his load from the left
lower limb to the right, and returned to the initial
position; nine load levels (Fz) were considered.
Figure 6 shows 7 positions of the subject related to
this activity.
Figure 6: Subject performing static activity.
The dynamic activity was based on a step on the
platform (Figure 7). The moment applied on the Y-
axis (My) was considered to verify the transfer of the
load from the heel to the toes of the right foot.
Figure 7. Subject during dynamic activity.
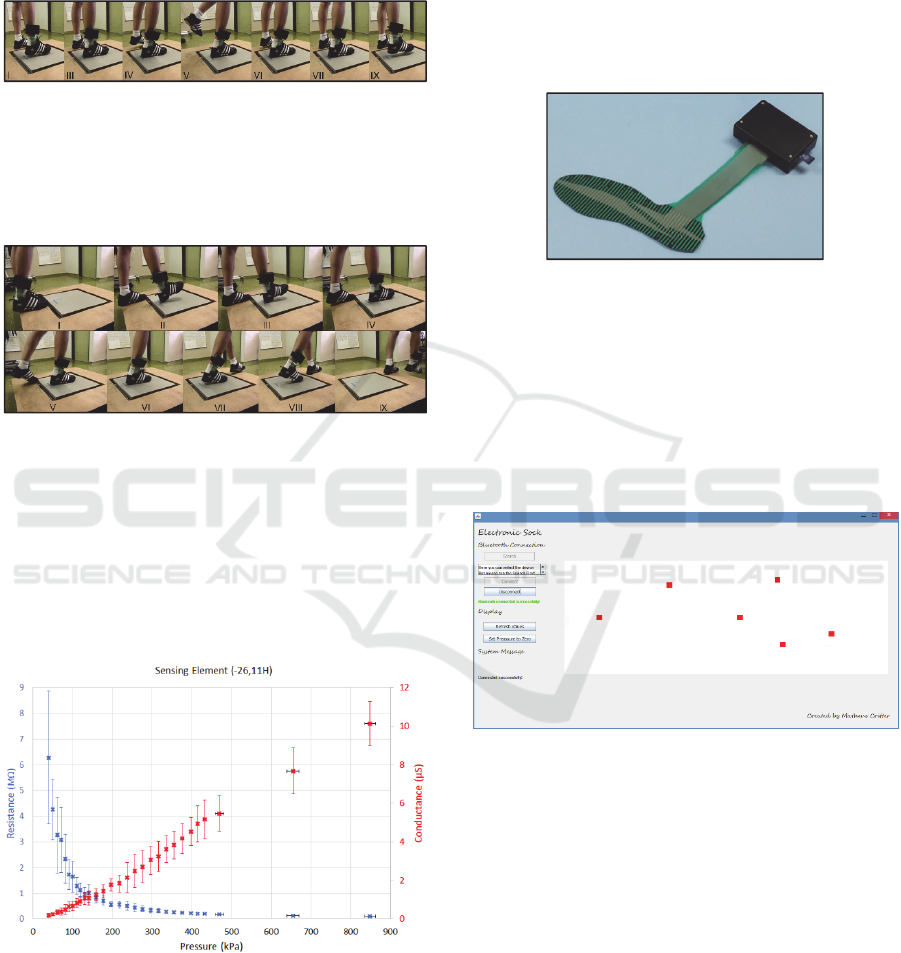
3 RESULTS
Using 100/70 Rule, the SE presented a very high R
s
to zero pressure, allowing it to be considered as an
open circuit. Thus, the C
s
becomes zero. Figure 8
shows the relationship between applied pressure and
R
s
and C
s
.
Figure 8: Characterization of SE in relation to applied
pressure and R
s
and C
s
.
For a better visualization of the other points, the
first point associated with the pressure 25.7(0.4)kPa
was not included in the graph. The respective values
of R
s
and C
s
were 24.7(14.4)MΩ and 0.06(0.05)μS.
Figure 9 shows the wearable device composed by
the data acquisition module with Medical Sensor
3000 embedded in it. The data acquisition module,
which has small dimensions (120x80x33mm) and
low weight (160g and 205g with battery), is fixed to
the user’s leg by a strap and the sensor is inserted into
the footwear during the plantar pressure mapping.
This device consumes up to 42mA and it may be used
bilaterally.
Figure 9: Wearable device: data acquisition module and
Medical Sensor 3000 (215g).
Bluetooth module HC-06 kept the connection up
20m even with two wooden walls between the
transmitter and receiver, without data loss.
In addition to the area intended for the insole
pressure sensor representation, the front panel of Java
application presents buttons related to the Bluetooth
connection and displayed data (Figure 10).
Figure 10: Front panel of Java application showing five
saturated SEs (left foot): (-26,11H), (-13,5H), (1,11T),
(8,4T), (9,16T) and (18,14T).
“Search” button allows finding paired devices.
Device services are selected through the password,
and they are listed in the scroll box. The HC-06
service must be selected and the connection is
established through the “Connect” button. Thus,
status message “Bluetooth not connected…”
becomes “Bluetooth connected successfully!”.
“Set Pressure to Zero” button allows the user to
calibrate the system, setting the reference values, and
the “Refresh Values” button to refresh the pixel
values in the image. The “Disconnect” button
disconnects the system from the Bluetooth device.
For complete system, the sensor saturated at
A Low Cost Wireless System to Monitor Plantar Pressure using Insole Sensor: Feasibility Approach
211
296.4(1.9)kPa, that is, the color intensity of graphic
element became bright red (255,5,5) from this value
during the five measures. In figure 11, the marker
represents the graphic element generated by Java
application. Its color was obtained from the mean
(approximated to integer) of the green and blue
intensity values.
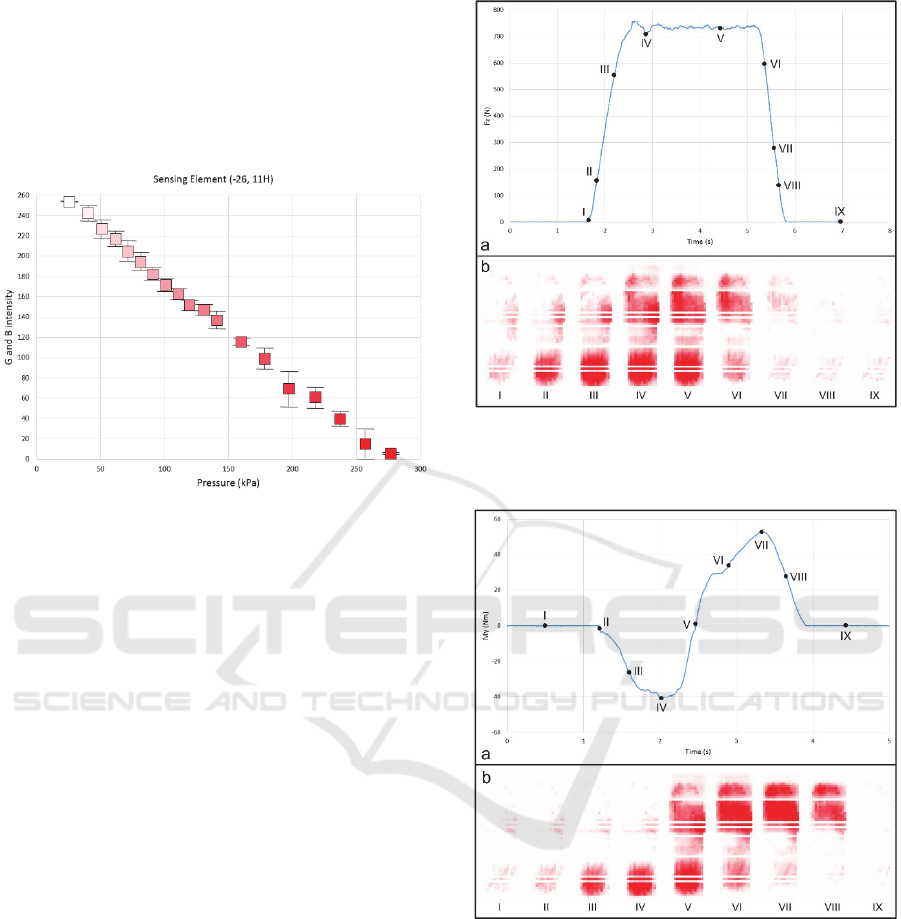
Figure 11: Color of graphic element according to the
employed pressure. Mean and SD were approximated to
integer values.
Synchronized data from the Biomechanics
Platform and the wearable device allowed relating the
plantar pressure with the force and the moment for
static and dynamic activities, respectively. Also
synchronized, the camcorder captured the activity
images. For better visualization, all images of right
foot plantar pressure were mirrored.
As a reference value, the load due to subject’s
body mass resulted in 735.2N applied on Z-axis (Fz)
of Biomechanics Platform. This value was achieved
during static activity, as shown in figure 12 (points IV
and V).
Point I indicates initial contact of right foot with
the platform. The points II and III show the
progressive loading up to the full contact, indicated
by the baseline (points IV and V). In contrast, points
VI, VII and VIII characterize the process of unloading
up to no contact between the foot and the platform
(point IX).
For the step on the platform, the plantar pressure
was associated with applied moment on Y-axis (My).
According to the figure 13, the heel strike occurred in
point II; from there, the pressure applied by heel
increased up to the maximum value (point IV). After
this, the pressure began to be distributed, achieving
the foot flat phase (point V).
Figure 12: Load transfer from the left lower limb to the
right: a) Force measured by Biomechanics Platform; b)
Plantar pressure detected by the wearable device.
Figure 13: Load transfer from the heel to the toes: a)
Moment measured by Biomechanics Platform; b) Plantar
pressure detected by the wearable device.
Following this phase, the pressure exerted by the
heel decreased, while the pressure of the toes and
metatarsal region increased, characterizing the
transfer of the load (points VI and VII). The point
VIII showed the foot on heel off phase – on the verge
of toe off phase.
Points I and IX demonstrated the plantar pressure
for the foot at the limit of no contact and in swinging,
respectively.
BIODEVICES 2017 - 10th International Conference on Biomedical Electronics and Devices
212

4 DISCUSSION
The apparatus built for characterization of the SE
allowed application of loads with high repeatability
up to about 480kPa, as showed in figure 8. Thus, it
can be considered an effective tool for this pressure
range because the SE practically reached the
saturation at this value, although the manufacturer
informs that the pressure capacity is 850kPa (Medical
Sensor 3000).
Considering the mean values, the relationship
between R
s
and pressure is a power function with a
negative exponent. Moreover, a linear fitting is
suitable to the relationship between C
s
and pressure,
facts that are in agreement with the manufacturer and
other studies about flexible pressure sensors
(Yaniger, 1991; Kalamdani, Messom and Siegel,
2006; Flexiforce® Force Sensor Design &
Integration Guide, 2015).
The analysis of the SE showed that for low
pressures, the repeatability of R
s
is poor. According
to the manufacturer, this behavior can be attributed to
the use of a standard multimeter, since most do not
provide a constant voltage. Woodburn and Helliwell
(1996) also reported poor repeatability of the sensor.
This feature has become better from 150kPa.
However, the data acquisition module uses the C
s
,
which presents opposite behavior in relation to R
s
, to
determine the output of electronic circuit. Thus,
repeatability and linearity can be attributed to the
complete system, being confirmed by the results
obtained in workbench tests (Figure 11).
In relation to modified voltage divider, the
transistors used presents low electrical resistance (up
to about 8Ω), when they operate like closed switch.
This value is much lower than R
s
, not interfering in
the performance of the circuit. R
aux
was employed to
ensure rapid discharge of transistor drain voltage,
avoiding interference between adjoining SEs.
The design and development of the entire graphic
platform for visualization and data acquisition also
follows the porting concept. Therefore, the software
for interface and Bluetooth connection was
implemented in Java Programming Language, which
is able to execute the same procedure on different
operating systems (e.g. Windows, Linux). This
feature occurs because Java applications run in a
virtual machine.
The library swing allowed the implementation of
the GUI to display the insole pressure area and to
control the Bluetooth connection. Although swing is
one of the most extensive libraries, its classes and
methods also guarantee compatibility among
computers with different screen resolutions, keeping
the high level of porting both for the execution and
for the visualization of the experiments.
It is important to mention that unlike swing, the
BlueCove is not inherent in the Java development
platform. This library is originally an Intel research
project for Bluetooth communication and it is
currently maintained as an open-source project. In
addition, the computer, which runs the application,
must have Bluetooth capabilities, such as the
hardware and driver installed correctly.
About verification of performance through
activities realized by subject, the system was effective
to characterize the foot pressure applied during both
conditions.
For static activity, the system presented rapid
response, identifying a variation of about 700N in 1s,
with intermediate values also characterized (Figure
12, points I, II, III and IV). In addition, the system
represented the load transfer from the left lower limb
to the right in an appropriate manner. At the moment
that the load was fully applied to the right limb, the
system indicated a higher pressure in the region of the
fifth metatarsal (Figures 6 and 12, point IV). When
the position of the subject was stabilized, the pressure
was distributed throughout the metatarsal region and
the hallux (Figures 6 and 12, point V).
The dynamic activity can be considered a partial
gait cycle, and some phases are identified through
pressure distribution pattern. Considering the right
lower limb, the subject performed the stance phase of
the gait cycle. According to the figures 7 and 13, point
II marks the initial contact (heel strike) and loading
response phase includes point V (foot flat). Midstance
is related to point VI, being followed by the terminal
stance. In this phase occurs heel off (point VIII), and
the stance phase is finished with preswing (toe off).
Finally, the range of pressure measured by the
system is suitable for many applications, e.g., the
mean value of plantar pressure during walking is
140kPa (Keijsers, 2013).
5 CONCLUSIONS
In this paper, the development and application of a
system to monitor plantar pressure based on a
wearable device were described. According to the
preliminary results, this system is effective to show
the interaction between the foot and floor in static and
dynamic conditions, like standing and walking,
respectively. Thus, this system is a feasible auxiliary
tool for clinical, orthopaedics and rehabilitation
analysis. Low cost, high resolution insole flexible
pressure sensor, easy wearability, no discomfort,
A Low Cost Wireless System to Monitor Plantar Pressure using Insole Sensor: Feasibility Approach
213

wireless data transfer, software porting and real-time
visualization of pressure mapping are outstanding
features of this device in relation to other self-
constructed and commercial systems. However, the
sensor is sensitive to temperature and it is necessary
to disassemble the data acquisition module to change
the sensor, e.g., to use a sensor with other size.
ACKNOWLEDGEMENTS
We thank the support by grants from São Paulo
Research Foundation (FAPESP) and National
Council for Scientific and Technological
Development (CNPq).
REFERENCES
Bellizzi, M., Rizzo, G., Bellizzi, G., Ranieri, M., Fanelli,
M., Megna, G. and Procoli, U. (2011), Electronic
baropodometry in patients affected by ocular torticollis,
Strabismus, vol. 19, pp. 21–25.
Castro, M. C. and Cliquet, A. Jr. (2000), Artificial
sensorimotor integration in spinal cord injured subjects
through neuromuscular and electrotactile stimulation,
Artif Organs, vol. 24, pp. 710–717.
Chapman, J. D., Preece, S., Braunstein, B., Höhne, A.,
Nester, C. J., Brueggemann, P. and Hutchins, S. (2013),
Effect of rocker shoe design features on forefoot plantar
pressures in people with and without diabetes, Clin
Biomech, vol. 28, pp. 679–685.
Crea, S., Donati, M., De Rossi, S. M., Oddo, C. M. and
Vitiello, N. (2014), A wireless flexible sensorized
insole for gait analysis, Sensors, vol. 14, pp. 1073–
1093.
Flexiforce® Force Sensor Design & Integration Guide,
Tekscan, Inc., 2015.
Girard, O., Eicher, F., Micallef, J. P. and Millet, G. P.
(2010), Plantar pressures in the tennis serve, J Sports
Sci, vol. 28, pp. 873–880.
Hills, A. P., Hennig, E. M., McDonald, M. and Bar-Or, O.
(2001), Plantar pressure differences between obese and
nonobese, Int J Obes Relat Metab Disord, vol. 25, pp.
1674–1679.
Hsiao, H., Guan, J. and Weatherly, M. (2002), Accuracy
and precision of two in-shoe pressure measurement
systems, Ergonomics, vol. 2, pp. 537–555.
Keijsers, N. (2013), The Science of Footwear, R. S.
Goonetilleke, Ed. Boca Raton, USA: CRC Press.
Kaercher, C. W., Genro, V. K., Souza, C. A., Alfonsin, M.
Berton, G. and Filho J. S. C. (2011), Baropodometry on
women suffering from chronic pelvic pain – a cross-
sectional study, BMC Womens Health, vol. 11.
Kalamdani, A., Messom, C. and Siegel, M. (2006), Tactile
sensing by the sole of the foot part II: calibration and
real-time processing, Proceedings of 3rd International
Conference on Autonomous Robots and Agents.
Koch, M., Lunde, L. K., Ernst, M., Knardahl, S. and
Veiersted, K. B. (2016), Validity and reliability of
pressure-measurement insoles for vertical ground
reaction force assessment in field situations, Applied
Ergonomics, vol. 53, pp. 44–51.
Ledoux, W. R., Shofer, J. B., Cowley, M. S., Ahroni, J. H.,
Cohen, V. and Boyko, E. J. (2013), Diabetic foot ulcer
incidence in relation to plantar pressure magnitude and
measurement location, J Diabetes Complications, vol.
27, pp. 621–626.
McPoil, T.G., Cornwall, M.W. and Yamada, W. (1995), A
comparison of two in-shoe plantar pressure
measurement systems, Lower Extremity, vol. 2, pp. 95–
103.
Medical Sensor 3000 data sheet, Tekscan, Inc., Boston,
USA.
Melvin, J. M. A., Preece, S., Nester, C. J., and Howard, D.
(2014), An investigation into plantar pressure
measurement protocols for footwear research, Gait
Posture, vol. 40, pp. 682–687.
Motha, L., Kim, J. and Kim, W. S. (2015) Instrumented
rubber insole for plantar pressure sensing, Organic
Electronics, vol. 23, pp. 82–86.
Podoloff, R. M., Benjamin, M. H., Winters, J. and Golden,
R. F. (1991), Flexible tactile sensor for measuring foot
pressure distributions and for gaskets, U.S. Patent 5
033 291.
Price, C., Parker, D. and Nester, N. (2016), Validity and
repeatability of three in-shoe pressure measurement
systems, Gait Posture, vol. 46, pp. 69–74.
Robinson, C. C., Balbinot, L. F., Silva, M. F., Achaval, M.
and Zaro, M. A. (2013), Plantar pressure distribution
patterns of individuals with prediabetes in comparison
with healthy individuals and individuals with diabetes,
J Diabetes Sci Technol, vol. 7, pp. 1113 – 1121.
Saito, M., Nakajima, K., Takano, C., Ohta, Y., Sugimoto,
C., Ezoe, R., Sasaki, K., Hosaka, H., Ifukube, T., Ino,
S. and Yamashita, K. (2011), An in-shoe device to
measure plantar pressure during daily human activity,
Med Eng Phys, vol. 33, pp. 638–645.
Smith, B. T., Coiro, D. J., Finson, R., Betz, R. R. and
McCarthy, J. (2002), Evaluation of force-sensing
resistors for gait event detection to trigger electrical
stimulation to improve walking in the child with
cerebral palsy, IEEE Trans Neural Syst Rehabil Eng,
vol. 10, pp. 22–29.
Tan, A. M., Fuss, F. K., Weizman, Y., Woudstra, Y. and
Troynikov, O. (2015), Design of low cost smart insole
for real time measurement of plantar pressure, Procedia
Technology, vol. 20, pp. 117–122.
Test & Measurement - Impossible Insights Made Possible
Through Minimally Invasive Force & Pressure
Measurement, Tekscan, Inc., 2014.
Woodburn J. and Helliwell, P. S. (1996), Observations on
the F-Scan in-shoe pressure measuring system, Clin
Biomech, vol. 11, pp. 301–304.
Yaniger, S. I. (1991), Force sensing resistors: a review of
the technology, Electro. Int., pp. 666–668.
BIODEVICES 2017 - 10th International Conference on Biomedical Electronics and Devices
214
