
Real-time Anterior Mitral Leaflet Tracking using Morphological
Operators and Active Contours
Malik Saad Sultan
1,2
, Nelson Martins
1,2,3
, Eva Costa
3
, Diana Veiga
3
, Manuel Jo
˜
ao Ferreira
3,4
,
Sandra Mattos
5
and Miguel Tavares Coimbra
1,2
1
Faculdade de Ci
ˆ
encias, Universidade do Porto, Porto, Portugal
2
Instituto de Telecomunicac¸
˜
oes, Porto, Portugal
3
Enermeter, Sistemas de Medic¸
˜
ao, Lda, Braga, Portugal
4
Centro Algoritmi, University of Minho, Guimar
˜
aes, Portugal
5
C
´
ırculo do Corac¸
˜
ao de Pernambuco, Recife PE, Brazil
Keywords:
Ultrasound Images, Medical Image Processing, Active Contours, Segmentation and Tracking, Mitral Valve.
Abstract:
The mitral valve plays a vital role in our circulatory system. To study its functionality, it is important to
measure clinically relevant parameters, such as its thickness, mobility and shape. Since manual segmentation
is impractical, time consuming and requires expert knowledge, an automatic segmentation tool can have a
significant clinical impact, providing objective measures to clinicians for understanding the morphology and
behaviour of the mitral valve. In this work, a real time tracking method has been proposed for ultrasound
videos obtained with the Parasternal Long Axis view. The algorithm is semi-automatic, assumes manual
Anterior Mitral Leaflet segmentation in the first frame and then it uses mathematical morphology algorithms
to obtain tracking results, further refined by localized active contours during the whole cardiac cycle. Finally,
the medial axis is extracted for a quantitative analysis. Results show that the algorithm can segment 1137
frames extracted from 9 fully annotated sequences of the real clinical video data in only 0.89 sec/frame, with
an average error of 5 pixels. Furthermore, the algorithms exhibited robust tracking performance in the most
difficult situations, which are large frame-to-frame displacements.
1 INTRODUCTION
1.1 Motivation
Mitral valve diseases are widespread and are com-
monly affected by Rheumatic Heart Disease (RHD)
(Bisno, 2004). RHD is an autoimmune disease that
usually begins in childhood that results from repeated
episodes of acute rheumatic fever, which slowly dam-
ages the heart valves. Following one of the most
relevant published studies (W HO and W HF, 2011,
2012), about 15.6 million people are affected glob-
ally from RHD, and require medical follow-up, being
responsible for 233,000 deaths per year. Earlier de-
tection is considered vital to control disease progres-
sion and to estimate disease burden in low-resource
regions of the world (Bisno, 2004). The RHD thick-
ens the Anterior Mitral Leaflet (AML) that results into
stenosis, regurgitation, change the shape of the leaflet
and shows abnormal motion patterns. Quantifying the
degree of abnormal change (morphological features)
will help to identify early cases with RHD. Heart
valve diseases create a massive economic burden on
health authorities. The average surgery cost to treat
mitral regurgitation was 24.871 ± 13.940 dollars per
patient in Europe (Trochu, Ribeiro and Ceber, 2015,
2012, 2014). The heart valve treatments and opera-
tions are not only expensive, but also a highly risky
cardiac process (Mirabel, 2007).
Echocardiography is a non-invasive, non-ionizing
and comparatively low cost imaging modality that is
capable of analysing fast moving valve structures in
real time. It is available as portable tool and thus it
is considered an appropriate choice for the diagno-
sis of heart diseases, especially in low-resource ar-
eas (Rem
´
enyi, 2012). The Parasternal Long Axis
view is the most suitable view to access the mitral
valve and its structures (Figure 1). It provides the
means to measure the clinically relevant parameters
such as, thickness, mobility and valvular anatomy
(Omran, 2010). Manual segmentation of these videos
Sultan M., Martins N., Costa E., Veiga D., Ferreira M., Mattos S. and Coimbra M.
Real-time Anterior Mitral Leaflet Tracking using Morphological Operators and Active Contours.
DOI: 10.5220/0006244700390046
In Proceedings of the 10th International Joint Conference on Biomedical Engineering Systems and Technologies (BIOSTEC 2017), pages 39-46
ISBN: 978-989-758-215-8
Copyright
c
2017 by SCITEPRESS – Science and Technology Publications, Lda. All rights reserved
39
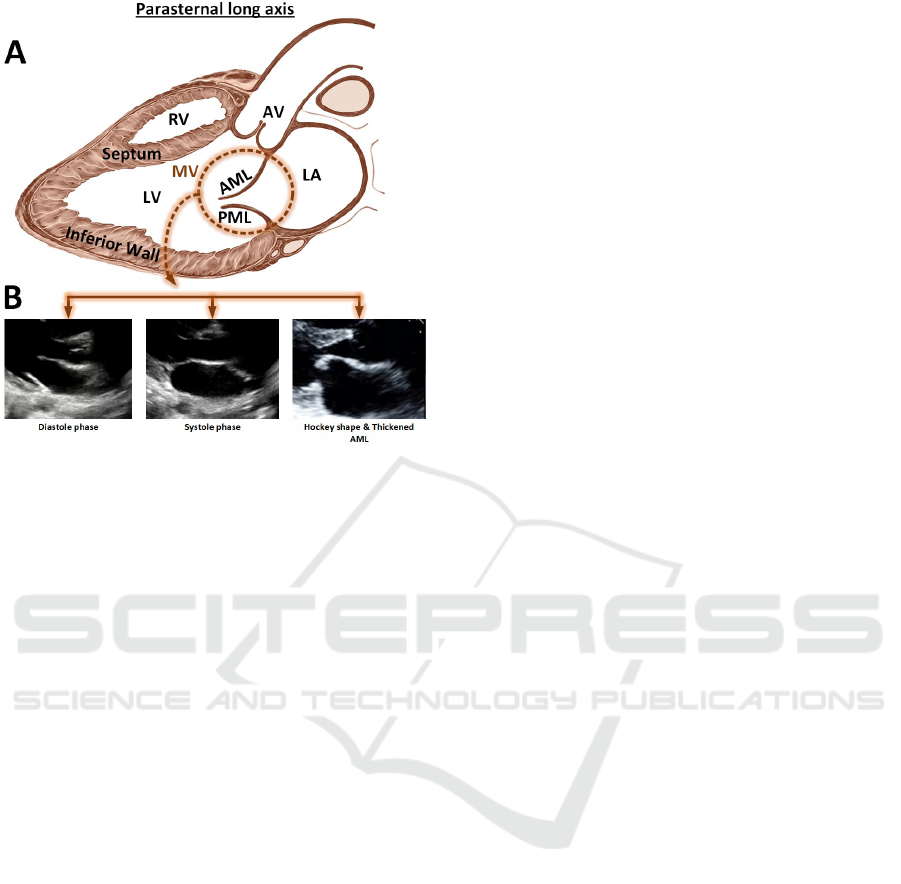
Figure 1: Parasternal long axis view, (A): showing Mitral
valve (MV), Anterior Mitral Leaflet (AML), Posterior Mi-
tral Leaflet (PML) and other structures. (B): Shows the MV
in Diastole/Systole phase, the thickened and hockey shape
leaflet.
is undesirable, given its impracticality, subjectivity
and expert knowledge required. Automatic and semi-
automatics methods to identify and track mitral valve
structures can improve the diagnostic process, pro-
viding quick and objective measurements of clinically
relevant parameters, even without any expert cardiol-
ogy knowledge.
1.2 State-of-the-art in Mitral Valve
Segmentation
Deformable models such as active contours were ex-
tensively used by the research community in med-
ical image segmentation and tracking. The reason
to adopt this kind of approach is their robustness
against image noise and shape fragmentation, abil-
ity to track non-rigid motion and its capability to in-
corporate geometric constraints, such as the expected
shape (Sheng, 2008). (Mikic, 1998) have proposed
the use of active contours with optical flow to seg-
ment and track the AML in echocardiography. The
algorithm fails in large frame to frame displacements,
requiring user initialization in the first frame. Also,
the algorithm was found computationally expensive
(20 min to compute a single cardiac cycle). (Mar-
tin, 2006) have used transformation fitting with two
connected active contours, optimized using dynamic
programming. The algorithm requires extensive ini-
tialization and several parameters need to be tuned.
Moreover, it failed in high displacements (>10 pix-
els) and requires a mean processing time of about 1.8
seconds with a restricted number of iterations (10)
to process a single frame. (Zhou, 2012) proposed
an algorithm for mitral leaflet detection and track-
ing based on outlier detection in a low-rank matrix
and was tested on 2D and 3D ultrasound. The algo-
rithm was automatic and unsupervised (no initializa-
tion is required). However, the user needs to crop the
original sequence, requires parameter adjustment, is
very sensitive to rank and is computationally expen-
sive. Literature review demands a real time segmen-
tation and tracking algorithm with less user interac-
tion and the ability to efficiently track the mitral valve
when faced with large frame to frame displacements
(Sheng, Mikic, Martin and Zhou, 2008, 1998, 2006,
2012).
Mathematical morphology is widely used in im-
age processing for analysis of shapes, geometrical
and topological structures. (Yun-gang, 2015) used
morphological operations to roughly segment the left
ventricle followed by a snakes active contours. Mor-
phological features were efficiently used for the fast
segmentation of ischemic viable, ischemic nonviable,
and normal myocardium in echocardiographic images
(Lascu, 2008).
1.3 Objective and Contributions
The objective of this work is to obtain robust and real-
time tracking of the AML in ultrasound videos.
Our key contribution in this work is the novel use
of combined morphological operators and active con-
tours to address robust AML tracking in frames with
large displacement.
The remainder of the paper is organized as fol-
lows. Section II provides the methodology adopted
in this paper. In section III we report the results that
demonstrate the accuracy of the proposed algorithm
and finally section IV concludes the paper with a dis-
cussion on the problem, our contribution to it and the
future work.
2 METHODOLOGY
In this work, the echocardiography video is split into
frames and we assume perfect (manual) segmentation
in the very first frame. The two successive frames are
iteratively selected for the analysis. The thin regions
of the successive images are extracted, followed by
extracting the regions with large displacement. These
regions are then merged with the segmentation re-
sult of the preceding frame and filtered, in the can-
BIOIMAGING 2017 - 4th International Conference on Bioimaging
40
didate region part. Regions are then classified based
on their shapes and geometrical properties. The re-
sults are finally refined using localized active con-
tours. Skeletonization and AML analysis is used as
a post-processing step. A summary of this processing
pipeline is depicted in Figure 2, and each step will
now be explained in detail.
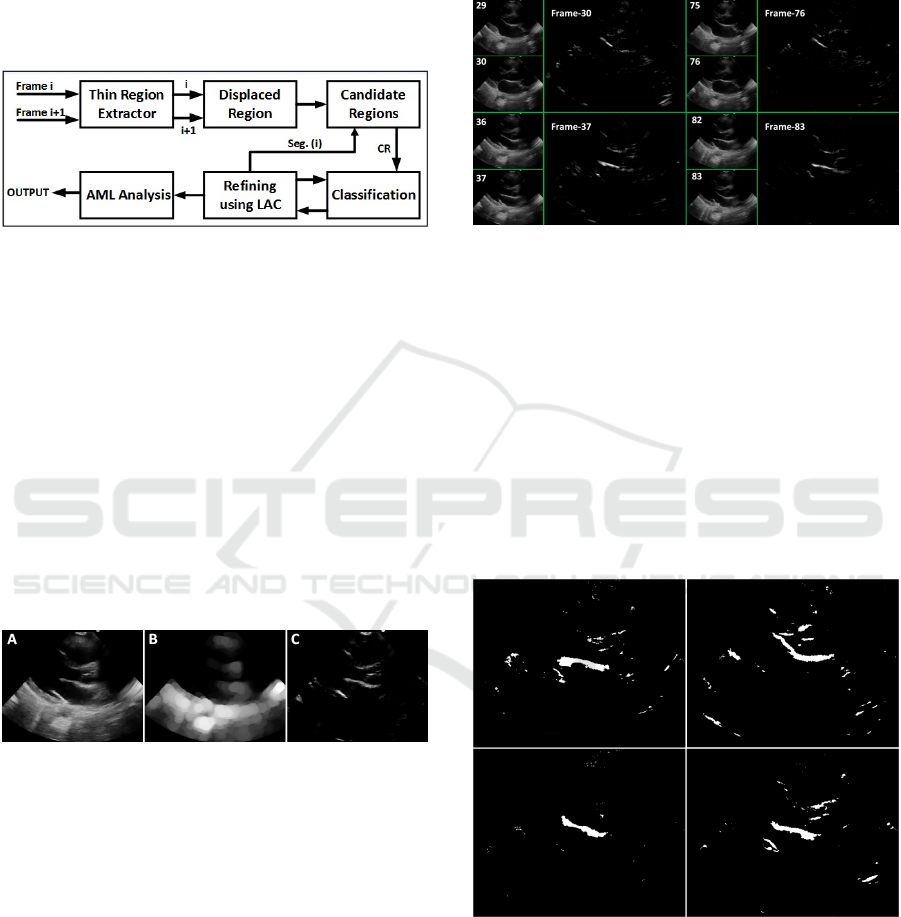
Figure 2: AML tracking pipeline.
2.1 Thin Region Extractor
In this stage, two consecutive frames were extracted
iteratively until the whole cardiac cycle was covered.
For the resolution of the videos used in this papers
experiments the maximum recorded thickness of the
AML was 24 pixels. Following this, all structures with
width less than 24 pixels of thickness are extracted as
potential regions.
The AML region (Figure 3C) is extracted by tak-
ing the difference between the grayscale input image
(Figure 3A) and the grayscale opened image (Figure
3B) with the flat disk shape structuring element of 24
pixel diameter.
Figure 3: A) Grayscale image B) Morphological opening
C) Top-hat transform.
2.2 Displaced Region
Based on the analysis of the PLAX videos, the thin
AML region shows a very large displacement in suc-
cessive frames compare to other regions in an image.
The regions of septum, inferior wall (Figure 1) do not
show significant displacement in successive frames
and thus overlapped. This prior information is signif-
icant to overcome the problem of tracking in frames
with large AML displacement.
The focus of this module is to extract region that
showed large displacement from frame t-1 to frame
t (Equation 1). That can simply be achieved by tak-
ing the difference of successive frames followed by
selecting only the positive intensity values (Figure 4).
Hard threshold is then applied to get the binary image.
Disp
t
gray
= [I
t
(x,y) − I
t−1
(x,y)] Disp
t
gray
< 0 (1)
Figure 4: Regions with high displacement at four different
times (frames).
2.3 Candidate Image
The segmented region obtained at the time t-1 is fil-
tered to remove the regions which belong to the blood
pool (black region) in frame at time t. Filtered region
is then summed up with the results of the displaced
region module. Small discontinuities (with a distance
of 2 pixels or less) were merged by a morphological
closing using a disk shape structuring element with a
radius of 2. The obtained results are shown in Figure
5.
Figure 5: Candidate image for final AML classification.
2.4 Region Classification
The regions extracted from the candidate image were
classified based on the morphological features, to ex-
tract the region that is most probably the AML. The
basic morphological and geometrical features such as
centroid, area, major and minor axis lengths were
Real-time Anterior Mitral Leaflet Tracking using Morphological Operators and Active Contours
41
used. These features are capable of providing signifi-
cant structural and locality information.
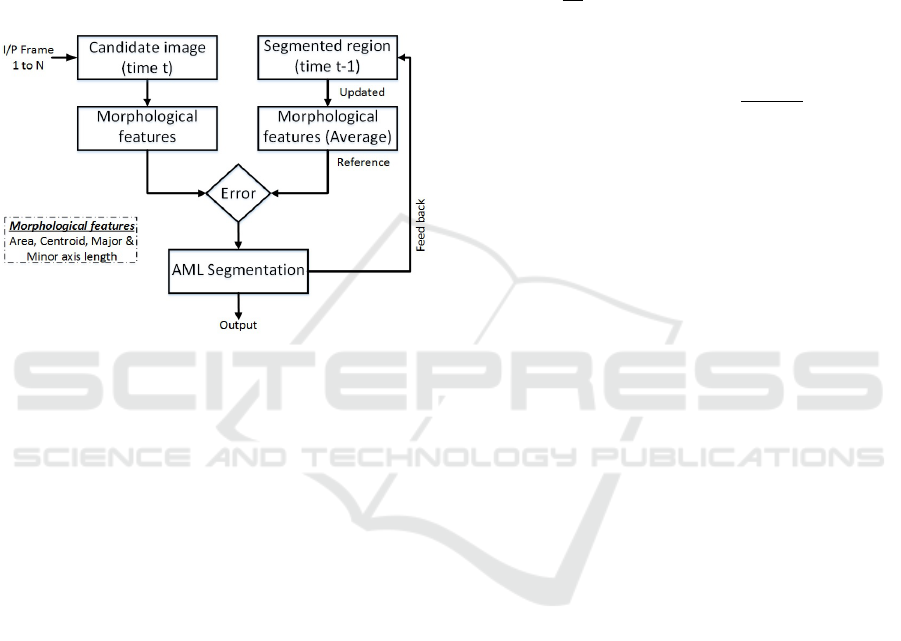
These basic morphological features do not typi-
cally change significantly in successive frames. In
ideal conditions, these features should be constant
throughout the cardiac cycle. The features obtained
from the manual segmentation in the first frame is
used as a reference for the upcoming frame. After
processing each frame, the reference features are au-
tomatically updated with the average, by using the
feedback channel (Figure 6).
Figure 6: Classification scheme.
A relative error matrix is created that contain four
vectors: centroid distance error, area error and ma-
jor/minor axis length error. For evaluation purposes,
the region with the minimum overall error is classified
as a true positive region (AML region) with a good
confidence and all the other regions were classified as
false positive regions.
2.5 Refining using Active Contours
2.5.1 Automatic Initialization
The segmentation result of the AML was obtained
through the morphological operators and was used as
a base to initialize the active contour framework. The
contour points of the initial curve are very close to
the real boundaries of the AML. Therefore, analyz-
ing local regions can provide robust and well defined
boundaries, with a few iterations.
2.5.2 Localized Active Contour
Ultrasound images are very noisy and frequently con-
tain heterogeneous regions, and as such neither edge
based contours, nor region based contours are a suit-
able choice. A localized region-based active contour
framework was used in this work to refine the initial
contour (Lankon, 2008). This hybrid region-based
curve evolution is robust to noise and doesn’t rely on
the global configuration of the image.
The algorithm is based on the analysis of the lo-
cal circular regions with five pixels radius, at each
point on the curve. At each point the algorithm lo-
cally identifies the background and foreground opti-
mally by their mean intensities. The formulation of
the local energy function along the curve is defined
as:
∂φ
∂t
(x) = δφ (x)
Z
Ω
y
B(x,y) δφ(y)
.
(I (y) − υ
x
)
2
− (I (y) − ν
x
)
2
dy
+λδφ(x)div
Oφ(x)
|
Oφ(x)
|
(2)
Here, is the Dirac function, B(x,y) represents a region
that locally defines the interior and the exterior of the
region at point x and the radius of the local region is
specified by the user. The uniform modelling energy
is used as an internal energy (Chan, 1999). The lo-
calized version of the internal energy is defined as the
local interior and exterior regions at every point on
the curve. (υ
x
,ν
x
) are the localized version of means
at each point x. The second term is the normalization
term that keeps the curve smoother. It penalizes the
arc length based on the weights λ tuned by the user.
2.6 AML Analysis
2.6.1 Skeletonization
The segmented AML region is skeletonized using
morphological thinning to get a line of one pixel
width. It helps to simplify the shape by preserv-
ing the topological (connectivity) characteristics. The
working principle is much the same as morphologi-
cal operators, requiring a binary image and a struc-
turing element. The central pixel of the structuring
element is translated to each pixel in an image. At
each step, the structuring element is compared with
the underlying pixels in an image. The Mark-and-
Delete based templates were found very reliable and
effective for thinning algorithms and thus used in this
work (Zhang, 1984). The ultrasound images contain
small irregularities due to speckle noise that results
into unessential small branches of the skeleton. The
branches need to be filtered to extract only the funda-
mental part. This can be achieved by discarding all
those branches whose length are less than 6 pixels.
The length of each branch was estimated by measur-
ing the Euclidean distance between the branch and the
end point.
BIOIMAGING 2017 - 4th International Conference on Bioimaging
42
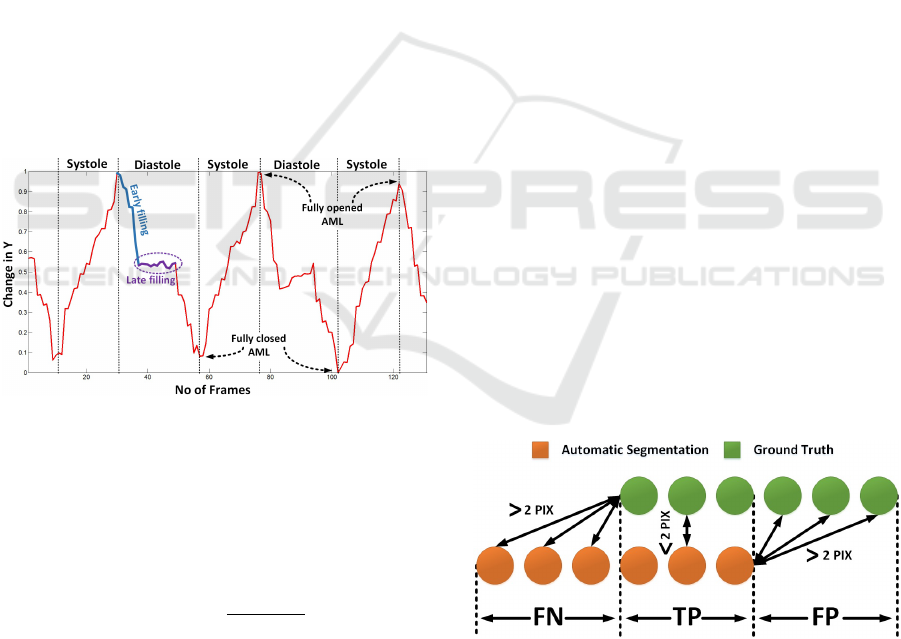
2.6.2 Motion Patterns
In this part of the work, we were focused to obtain
the motion pattern of the AML. The tracking results
were analyzed to extract the important information. It
was observed that the motion in the x-axis doesnt give
any significant information. However, the motion in
y-axis provides the base to analyze the motion of the
AML. The mean of the y-coordinates of the obtained
skeleton were saved for each frame and were plotted
against time (Figure 7). The minimum and maximum
peaks of the motion pattern were estimated, to clas-
sify the frame in systole and diastole phase. The pat-
tern obtained is also useful for identifying the frames
with the AML opened as well as closed. This informa-
tion is quite useful to analyze the opening and closing
of the valve. Further work can help to classify frames
in early filling and late filling phase (Figure 7). This
information will be helpful to identify each phase au-
tomatically. The late filling will be quite useful to ex-
tract frames in which the AML is perpendicular to the
ultrasound beam. This is the best position to measure
thickness of the AML tip that provides a strong clue
to identify patients with a disease.
Figure 7: Motion patterns generated by AML.
2.6.3 Shape
The obtained tracking results can also be used for the
shape analysis by calculating the curvature at each
point on the skeleton. This can be achieved by:
C
skeleton
(i) =
d
2
SKL (i)
ds
2
2
(3)
The second derivative approximates the curvature
of the AML at each point i on the Skeleton SKL. This
way, we can identify the doming (hockey shape) of
the AML in the diastolic phase, which is one of the
strongest clue to identify cases with RHD.
3 RESULTS
3.1 Materials
A dataset of the mitral valve videos obtained from the
PLAX view in ultrasound has been collected during
the activities of Real Hospital Portugu
ˆ
es, in Recife,
Brazil. The videos were obtained using a M-Turbo
model by SonoSite ultrasound system, with a P10
transducer. Nine of these exams were fully annotated
by a physician using support software, to validate the
proposed algorithm. These nine videos include a total
of 1137 frames with the dimensions of [351 × 441].
3.2 Extended Modified Hausdorff
Distance
The Modified Hausdorff Distance (Dubuisson, 1994)
was proposed to obtain a distance measure to match
two objects. In this work, we extended this approach
by categorizing the segmented region as false pos-
itive, false negative and true positive (Equation 4).
We assumed that the nearest point between Automatic
Segmentation (AS) and Ground Truth (GT ) with Eu-
clidean distance smaller than 2 pixels are true posi-
tives. The part of the AS that is falsely segmented as
AML were considered false positives and the parts of
the GT that were missed by the automatic segmenta-
tion were considered as false negatives, always using
2 pixels distance as reference T (Figure 8).
d
AS→GT
= min
{
AS,SEG
}
FP = d > T, T P = d < T
d
GT →AS
= min
{
AS,SEG
}
FN = d > T, T P = d < T
D
MHD
= max [avg(d
AS→GT
), avg (d
GT →AS
)]
(4)
Figure 8: Region classification.
3.3 Segmentation and Tracking
The algorithm has shown good computational per-
formance and thus is suitable for the monitoring of
the structures during heart procedures. Results on
2D PLAX ultrasound videos are presented, where the
Real-time Anterior Mitral Leaflet Tracking using Morphological Operators and Active Contours
43
AML was detected accurately and tracked during the
whole cardiac cycle. The algorithm was robust and
capable of tracking the AML in large displacements
(around 35 pixels). The validation of the algorithm is
performed by comparing the segmentation result with
the physician annotation. Results were also compared
with the AML tracking approach using active contours
(Sultan, 2016).
3.3.1 Quantification
The proposed algorithm can identify the AML struc-
ture with an average time of 0.17 sec/frame using
morphological operators and it consumes an average
time of 0.67 sec/frame to refine the contour points us-
ing localized active contours. Thus, the total compu-
tational time to delineate true boundaries of the AML
consumes 0.89 sec/frame. The reference algorithm
(Sultan, 2016) takes 121 sec/frame. The algorithm
was able to completely segment the structure of the
AML with the sensitivity of 90.4% and thus the region
missed by our algorithm was not very significant (av-
erage FN = 5 pixels). However, the main challenge
faced was the regions which were falsely segmented
as the part of AML (average FP = 17 pixels). This
is because the AML and its neighbouring structures
such as chordae tendineae and septum have the same
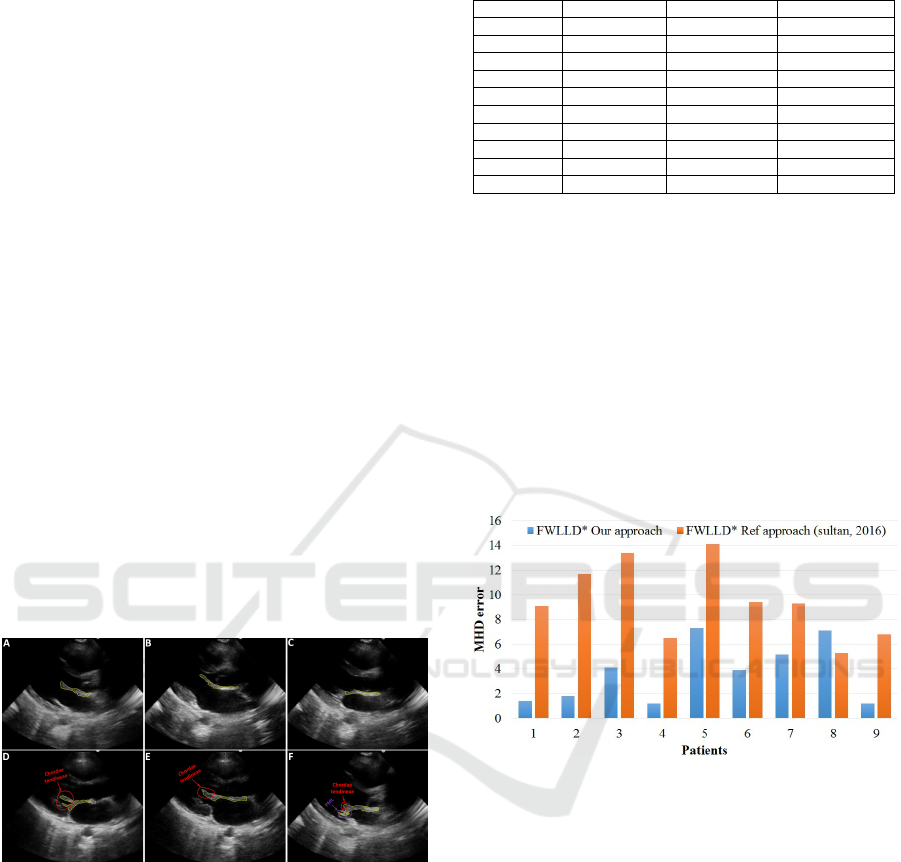
texture and intensity (Figure 9).
Figure 9: Visual results for the AML segmentation. (A, B,
C) Shows results without outliers. (D, E, F) Shows results
with outliers (fused chordae tendineae and posterior mitral
leaflet (PML)).
The Table 1 show that our algorithm works
equally well in all videos except 2, 7 and the MHD
error difference between both the approaches is only
0.1 pixels. This happened because the false positive
tends to increase the MHD error.
The first opening of the AML is very large. It
opens sharply before the LV diastole (Figure 7). In
the early filling, the leaflets maximally open to al-
low about 70 to 80% of the blood to fill the LV . In
the ultrasound PLAX view this leaflet motion is very
large and thus difficult to track for the present tracking
Table 1: MHD error in Pixels. (Ref.* (Sultan, 2016).
Patient No. No. of frames Our Approach Ref.* Approach
1 131 5.2 5.3
2 360 6.8 4.6
3 66 4.4 5.2
4 131 4.0 4.3
5 66 5.5 5.6
6 66 5.5 5.7
7 120 5.4 4.9
8 66 4.5 4.9
9 131 3.6 3.6
Average 1137 5 4.9
schemes (Mikic, Martin, 1998, 2006). In the major-
ity of the published work, researchers had used active
contour frame work that requires initialization. The
critical limitation of the active contours while track-
ing is its incapability to recover from failure. The
reference algorithm (sultan, 2016) undergoes tracking
failure that is overcome in this work. The proposed al-
gorithm successfully copes with the large leaflet dis-
placement in all videos, with the average MHD error
of only 3.7 pixels. One can see the significant im-
provement from the average of 9.5 pixel error to 3.7
pixels error (Figure 10).
Figure 10: MHD error in Frames With Large Leaflet Dis-
placement (FWLLD*) – In pixels.
Our algorithm outperform with respect to time
consumed (difference of 1.13 minute/frame), and
frame-frame displacement with the improvement of
5.8 pixels and sensitivity to noise.
4 DISCUSSION AND FUTURE
WORK
In this paper, a new approach based on the morpho-
logical operators and the localized active contour is
proposed. Based on the morphological operators, the
algorithm finds the best match of AML in succes-
sive frames. It was observed that the displacement
of the structures in a PLAX view is not significant,
except the AML that shows the average displacement
of 35 pixels in frames with fully open AML. The pro-
BIOIMAGING 2017 - 4th International Conference on Bioimaging
44

posed algorithm has successfully handled the frame-
to-frame displacement of the AML.
A 0.89 sec/frame is still slow for a real time ap-
proach, but we believe that this value can be drasti-
cally reduced by optimizing the code, converting it to
C/C + + and using multiple core processing.
The biggest difficulty found during the segmen-
tation and tracking was to identify, where the AML
starts, where it ends and the location where the chor-
dae tendineae connects with anterior and posterior mi-
tral leaflet. This is because all the tissues consist of
elastic and collagen fibers that result into quite similar
texture and intensity in ultrasound. The low quality is
another obstacle that produces false positives (Figure
9).
In the future, we will focus more to improve com-
putational time and delineate the boundaries of the
AML correctly by filtering irrelevant regions such as
chordate tendinae and posterior mitral leaflet. After
having good segmentation and tracking results, we
will be capable to automatically assess the function-
ality of the mitral valve in echocardiography.
ACKNOWLEDGEMENTS
This article is a result of the project (NORTE-
01-0247-FEDER-003507-RHDecho), co-funded by
Norte Portugal Regional Operational Programme
(NORTE 2020), under the PORTUGAL 2020 Part-
nership Agreement, through the European Regional
Development Fund (ERDF). This work also had the
collaboration of the Fundac¸
˜
ao para a Ci
ˆ
encia a e Tec-
nologia (FCT) grant no: PD/BD/105761/2014 and has
contributions from the project NanoSTIMA, NORTE-
01-0145-FEDER-000016, supported by Norte Portu-
gal Regional Operational Programme (NORTE 2020),
through Portugal 2020 and the European Regional
Development Fund (ERDF).
REFERENCES
J.N. Trochu, T. L. Tourneau, J.F. Obadia, G. Caranhac, A.
Beresniak, 2015. Economic burden of functional and
organic mitral valve regurgitation. Archives of Cardio-
vascular Disease, 108, 88-96
G. S. Ribeiro, S. Y. Tartof, D. W. S. Oliveira, A. C. S.
Guedes, M. G. Reis, L. W. Riley, A. I. Ko, May 2012.
Surgery for Valvular Heart Disease: A Population-
Based Study in a Brazilian Urban Center. PLoS One,
Vol 7, issue 5
CEBR, August 2014. The economic cost of cardiovascular
disease from 2014-2020 in six European economies,
Centre for Economics and Business Research, Lon-
don.
C. Sheng, 2008. Segmentation in echocardiographic se-
quences using shape-based snake model, Computing
and Informatics, Vol. 27, 423435
I. Mikic, S. Krucinski, J. D. Thomas, April 1998. Segmen-
tation and Tracking in Echocardiographic Sequences:
Active Contours Guided by Optical Flow Estimates.
IEEE transactions on medical imaging, vol- 17, no. 2
S. Martin, V. Daanen, O. Chavanon, J. Troccaz, 2006. Fast
Segmentation of the Mitral Valve Leaflet in Echocar-
diography. Computer Vision Approaches to Medical
Image Analysis, Vol. 4241, pp 225-235
X. Zhou, C. Yang, W. Yu, 2012. Automatic Mitral Leaflet
Tracking in Echocardiography by Outlier Detection
in the Low-rank Representation, IEEE Conference
on Computer Vision and Pattern Recognition, IEEE
Computer Society Washington, DC, USA, 972-979
M. Mirabel, B. Iung, G. Baron, D. Messika-Zeitoun,
D. Dtaint, J.-L. Vanoverschelde, E. G. Butchart, P.
Ravaud, A. Vahanian, 2007 .What are the character-
istics of patients with severe, symptomatic, mitral re-
gurgitation who are denied surgery?. European Heart
Journal, 28, 13581365
A. Bisno, E. G. Butchart, NK Ganguly, T. Ghebrehiwet,
et. al. 2004, WHO Expert Consultation on Rheumatic
Fever and Rheumatic Heart Disease, Geneva
B. Remnyi, N. Wilson, A. Steer, B. Ferreira, J. Kado,
K. Kumar, J. Lawrenson, G. Maguire, E. Marijon
et. al. Feb 2012. World Heart Federation criteria for
echocardiographic diagnosis of rheumatic heart dis-
easean evidence-based guideline, Nat Rev Cardiol.
Vol 9, issue 5, pp 297-309
A.S. Omran, A.A. Arifi, A.A. Mohamed, 2010. Echocardio-
graphy of the mitral valve, Journal of the Saudi Heart
Association, 22, 165170
L. Yun-gang, K. K. Jacky, L. Shi, Y. Guan, L. Linong, J.
Qin, H. PhengAnn, C. C. Winnie, W. Defeng, 2015,
Myocardial Iron Loading Assessment by Automatic
Left Ventricle Segmentation with Morphological Op-
erations and Geodesic Active Contour on T2* images,
Scientific reports.
M. Lascu, D. Lascu, March 2008. A New Morphological
Image Segmentation with Application in 3D Echo-
graphic Images, WSEAS Transactions on electronics,
Issue 3, Vol. 5
S. Lankton, A. Tannenbaum, Nov. 2008. Localizing
Region-Based Active Contours, IEEE Transactions on
image processing, vol. 17, issue 11, 2029-2039
T. Chan, L. Vese, 1999. An Active Contour Model without
Edges, LNCS 1682, pp. 141-151
T. Y. Zhang, C. Y. Suen, March 1984 .A Fast Parallel Algo-
rithm for Thinning Digital Patterns, Communications
of the ACM, Vol. 27, Issue 3, pp. 236-239
M. S. Sultan, N. Martins, D. Veiga, M. J. Ferreira, M.
T. Coimbra, 2016. Tracking of the Anterior Mitral
Leaflet in Echocardiographic Sequences using Active
Contours, EMBC, 1074 1077
WHF, 2012. http://www.world-heart-federation.org
/fileadmin/user upload/documents/ Fact sheets/2012/
RHD.pdf
Real-time Anterior Mitral Leaflet Tracking using Morphological Operators and Active Contours
45

WHO, 2011. World Heart Federation, World Stroke Orga-
nization, 2011. Global atlas on cardiovascular disease
prevention and control, ISBN: 9789241564373
M.-P. Dubuisson, A. K. Jain, 1994. A Modified Haus-
dorff Distance for Object Matching, Proc, interna-
tional conference on pattern recognition, Jerusalem,
Israel, pp 566-568
J. Pregowski, A. Witkowski, 2013. Percutaneous treatment
of mitral regurgitation with MitraClip device, Postep
Kardiol Inter., vol. 9, issue 4, pp. 383389
BIOIMAGING 2017 - 4th International Conference on Bioimaging
46
