
Evaluation of the Imaging Properties of a CT Scanner with the
Adaptive Statistical Iterative Reconstruction Algorithm
Noise, Contrast and Spatial Resolution Properties of CT Images Reconstructed at
Different Blending Levels
Patrizio Barca
1,3
, Marco Giannelli
2
, Maria Evelina Fantacci
1,3
and Davide Caramella
4
1
Department of Physics, University of Pisa, Pisa, Italy
2
Unit of Medical Physics, Pisa University Hospital “Azienda Ospedaliero-Universitaria Pisana”, Pisa, Italy
3
INFN, Pisa Section, Pisa, Italy
4
Department of Radiology, Pisa University Hospital “Azienda Ospedaliero-Universitaria Pisana”, Pisa, Italy
Keywords: CT Iterative Reconstruction, ASIR, Image Quality, NPS, CNR, MTF.
Abstract: X-ray Computed Tomography (CT) is an essential imaging technique for different diagnostic and
therapeutic tasks. However, ionizing radiation from CT scanners represents the largest source of medical
exposure for the population of industrialized countries. In order to reduce CT dose during patient
examination, iterative reconstruction algorithms have been developed to help existing dose reduction
methods. In this paper, we studied the image quality performance of a 64-slice CT scanner (Optima CT660,
GE Healthcare, Waukesha, WI, USA) that implements both the conventional filtered back-projection (FBP)
and the Adaptive Statistical Iterative Reconstruction (ASIR, GE Healthcare, Waukesha, WI, USA)
algorithm. In order to compare the performance of these two reconstruction technologies, CT images of the
Catphan
®
504 phantom were reconstructed using both conventional FBP and ASIR with different
percentages of reconstruction from 20% to 100%. Noise level, noise power spectrum (NPS), contrast-to-
noise ratio (CNR) and modulation transfer function (MTF) were estimated for different values of the main
radiation exposure parameters (i.e. mAs, kVp, pitch and slice thickness) and contrast objects. We found that,
as compared to conventional FBP, noise/CNR decreases/increases non-linearly up to 50%/100% when
increasing the ASIR blending level of reconstruction. Furthermore, ASIR modifies the NPS curve shape (i.e.
the noise texture). The MTF for ASIR-reconstructed images depended on both tube load and contrast level,
whereas MTF of FBP-reconstructed images did not. For lower tube load and contrast level, ASIR offered
lower performance as compared to conventional FBP in terms of reduced spatial resolution and MTF
decreased with increasing ASIR blending level of reconstruction.
1 INTRODUCTION
In the last years, concerns about ionizing radiations
exposure due to computed tomography (CT)
technology have lead to develop strategies to
optimize CT procedures (tube current modulation,
automatic exposure control, advances in detection
technology etc.) (McNitt-Gray, 2002). A promising
approach for dose reduction is represented by the
improvement of image reconstruction algorithms,
that, in contrast with FBP algorithm, take into
account a model of the imaging system to describe
the different physical aspects of image acquisitions.
This may offer the opportunity to reduce image
noise with respect to FBP reconstructions. Because
of the strict correlation between radiation exposure
and image noise, IR algorithms can be employed
when CT data at reduced tube load product and/or
tube potential (i.e. at reduced radiation exposure) are
acquired (Willemink et al., 2013; Beister et al.,
2012). Therefore, IR algorithms can be used with
reduced radiation exposure without significantly
affecting the diagnostic image quality with respect to
conventional FBP (Willemink et al., 2013; Beister et
al., 2012).
In this study, our attention was focused on a 64-
slice CT scanner (Optima CT660, GE Helathcare,
Waukesha, WI, USA) which implements both the
conventional FBP algorithm and the Adaptive Statis-
200
Barca P., Giannelli M., Fantacci M. and Caramella D.
Evaluation of the Imaging Properties of a CT Scanner with the Adaptive Statistical Iterative Reconstruction Algorithm - Noise, Contrast and Spatial Resolution Properties of CT Images
Reconstructed at Different Blending Levels.
DOI: 10.5220/0006240802000206
In Proceedings of the 10th International Joint Conference on Biomedical Engineering Systems and Technologies (BIOSTEC 2017), pages 200-206
ISBN: 978-989-758-216-5
Copyright
c
2017 by SCITEPRESS – Science and Technology Publications, Lda. All rights reserved

tical Iterative Reconstruction (ASIR, GE Healthcare,
Waukesha, WI, USA) algorithm (Willemink et al.,
2013; Beister et al., 2012; Argaud, 2009).
ASIR works on raw data space modelling the
fluctuations in the projection measurement and the
noise characteristics of the scanned object (Argaud,
2009). Furthermore, ASIR offers the possibility of
blending with FBP at various levels, from 0%
(conventional FBP) to 100% ("pure" IR).
Previous works have shown that the noise
reduction in the ASIR-reconstructed images is
accompanied by changes in the noise texture as
compared to FBP reconstruction, and the spatial
resolution can vary as a function of dose and
contrast (Richard et al., 2012; Samei et al., 2015;
Miéville et al., 2013).
In our study, we quantitatively assessed noise
level, noise power spectrum (NPS), contrast-to-noise
ratio (CNR) and modulation transfer function (MTF)
using different ASIR blending levels of reconstru-
ction and a wide range of the main radiation
exposure parameters (i.e. tube load, tube potential,
pitch, slice thickness) values as well as different
contrast objects.
The paper is organised as follows: after this brief
introduction, we describe the materials and methods
in which we present the image acquisition protocols
and the adopted methodology for data analysis; in
the next section, we describe the results in terms of
the main image quality parameters analysed (noise
level, NPS, CNR and MTF); then, we dedicate a
section to the discussion of our results and finally we
suggest our conclusions.
2 MATERIALS AND METHODS
2.1 Scanner and Phantom Acquisition
Images of the Catphan
®
504 phantom (The Phantom
Laboratory, NY, USA) were acquired with a 64-slice
CT scanner (Optima CT660, GE Healthcare
Waukesha, WI, USA). This phantom is composed of
4 modules with cylindrical shape (internal diameter
of 15 cm). We employed the CTP486 module (a
homogeneous water-equivalent module) and the
CTP404 module (composed of many inserts of
different materials in a water-equivalent background
- nominal CT Hounsfield’s units (HU) of the inserts
are reported in the Catphan
®
504 Manual).
For noise analysis, images of the CTP486
module were acquired varying the main acquisition
parameters on a range of values as reported in Table
1. For spatial resolution evaluation, the CTP404
module was scanned across a range of acquisition
parameters as reported in Table 2. The contrast-to-
noise ratio (CNR) was computed from a subset of
the images used in spatial resolution analysis. All
images were reconstructed by using both
conventional FBP and ASIR with different blending
levels of reconstruction (20%, 40%, 60%, 80%,
100%).
2.2 Data Analysis
Image data analysis was performed using ImageJ
(Wayne Rasband, National Institute of Health, USA)
and OriginPro 9.0 (OriginLab Corporation, MA,
USA) software packages.
2.2.1 Noise
Noise properties of ASIR reconstructed images were
evaluated by measuring the standard deviation (SD)
of HU values on a circular region of interest (ROI)
(4.5 cm diameter) centered in the images. In
addition, the noise power spectrum (NPS) was
calculated from images acquired using a subset of
the exposure parameters in Table 1 (tube load 112
mAs, tube potential 120 kVp, slice thickness 2.5
mm, pitch 0.984). We computed the 3D NPS
(Siewerdsen et al., 2002; Verdun et al., 2015;
Friedman et al., 2013) considering an ensemble of
20 volumes of interest (VOIs) selected from 19
slices. From each VOI we calculated the 3D NPS
and then we made the ensemble average. In order to
obtain a radial representation of NPS the f
z
=0 plane
of the 3D NPS was selected and a radial average was
performed (Friedman et al., 2013).
2.2.2 Spatial Resolution
Spatial resolution properties of ASIR reconstructed
images were assessed through the calculation of the
modulation transfer function (MTF).
The MTF analysis was performed at different
radiation exposure and considering 6 different
inserts (air, PMP, LDPE, polystyrene, delrin and
teflon). We adopted the circular edge method
(Richard et al., 2012; Samei et al., 2015; Friedman et
al., 2013; Takenaga et al., 2015) to compute the
MTF. We acquired an ensemble 7 distinct images
with the same scanning parameters and the MTF
curves corresponding to the same insert were
averaged. The uncertainty of the MTF estimation
was obtained as the standard deviation of the above
7 measurements.
Evaluation of the Imaging Properties of a CT Scanner with the Adaptive Statistical Iterative Reconstruction Algorithm - Noise, Contrast and
Spatial Resolution Properties of CT Images Reconstructed at Different Blending Levels
201

2.2.3 CNR
The CNR was obtained from 7 repeated acquisitions,
using a subset of the acquisition parameters reported
in Table 2 (tube load 140 mAs, 84 mAs, 56 mAs and
28 mAs). In this analysis, we considered polystyrene
(low contrast), LDPE (medium contrast) and teflon
(high contrast) inserts. The CNR was estimated as
follows:
CNR=(HU
object
-Hu
bkg
)/√(σ
2
object
+ σ
2
bkg
) (1)
where HU
object
/σ
object
and HU
bkg
/σ
bkg
are the
mean/standard deviation of HU values in a circle
ROI in the insert and background region,
respectively. For each insert, the CNR values were
calculated from the mean value and its standard
deviation (uncertainty) across the repeated
acquisitions.
Table 1: Acquisition protocol/parameters for noise
analysis.
Acquisition mode: helical
Tube load (mAs): 28, 42, 56, 70, 84, 98, 112
Tube potential (KV): 80, 100, 120, 140
Tube rotation time (s): 0.7
Slice thickness (mm):
0.625, 1.25, 2.5, 3.75, 5,
7.5
Collimation along
longitudinal direction
(mm):
40
Pitch: 0.516, 0.984, 1.375
Number of reconstructed
slices
19
Table 2: Acquisition protocol/parameters for spatial
resolution and CNR analysis.
Acquisition mode: helical
Tube load (mAs):
28, 56, 84, 112, 140, 168,
196, 224
Tube potential (KV): 120
Tube rotation time (s): 0.7
Slice thickness (mm): 2.5
Collimation along
longitudinal direction
(mm):
40
Pitch: 0.984
Number of reconstructed
slices
19
3 RESULTS
3.1 Noise
Figure 1 shows noise with varying tube load, tube
potential, slice thickness and pitch for conventional
FBP algorithm and ASIR with different blending
levels of reconstruction (20%, 40%, 60%, 80%,
100%). Noise decreased non-linearly with the
increase of ASIR blending level of reconstruction as
well as with increasing tube potential/tube load/slice
thickness. On the other hand, noise increased with
the increase of pitch value.
NPS results are reported in figures 2 and 3. ASIR
algorithm acts as a low pass filter whose effect
increases with the increase of blending level of
reconstruction (Fig. 3).
3.2 Spatial Resolution
The spatial resolution results are reported in Figures
4 and 5. MTF of ASIR-reconstructed CT images
varied with the contrast level (Fig. 4), especially at
lower tube load. In particular, MTF decreased with
decreasing contrast level. We also verified that MTF
of FBP-reconstructed CT images was substantially
independent of the contrast level and tube load.
Furthermore, for ASIR-reconstructed CT images and
lower contrast level, MTF decreased with decreasing
tube load (Fig. 5 A). While for high contrast objects
or high mAs values ASIR preserves the spatial
resolution offered by FBP reconstruction , for lower
tube load and contrast level, MTF of ASIR-
reconstructed CT images was lower than MTF of
conventional FBP-reconstructed images, and the
first decreased with increasing blending level of
reconstruction (Fig. 5 B).
3.3 CNR
CNR results are reported in Table 3. CNR values
increased with increasing tube load. Also, for each
tube load value and insert (teflon, LDPE, polystyre-
ne), CNR values of ASIR-reconstructed CT images
were higher than CNR values of conventional FBP-
reconstructed CT images and increased non-linearly
with increasing blending level of reconstruction.
BIODEVICES 2017 - 10th International Conference on Biomedical Electronics and Devices
202
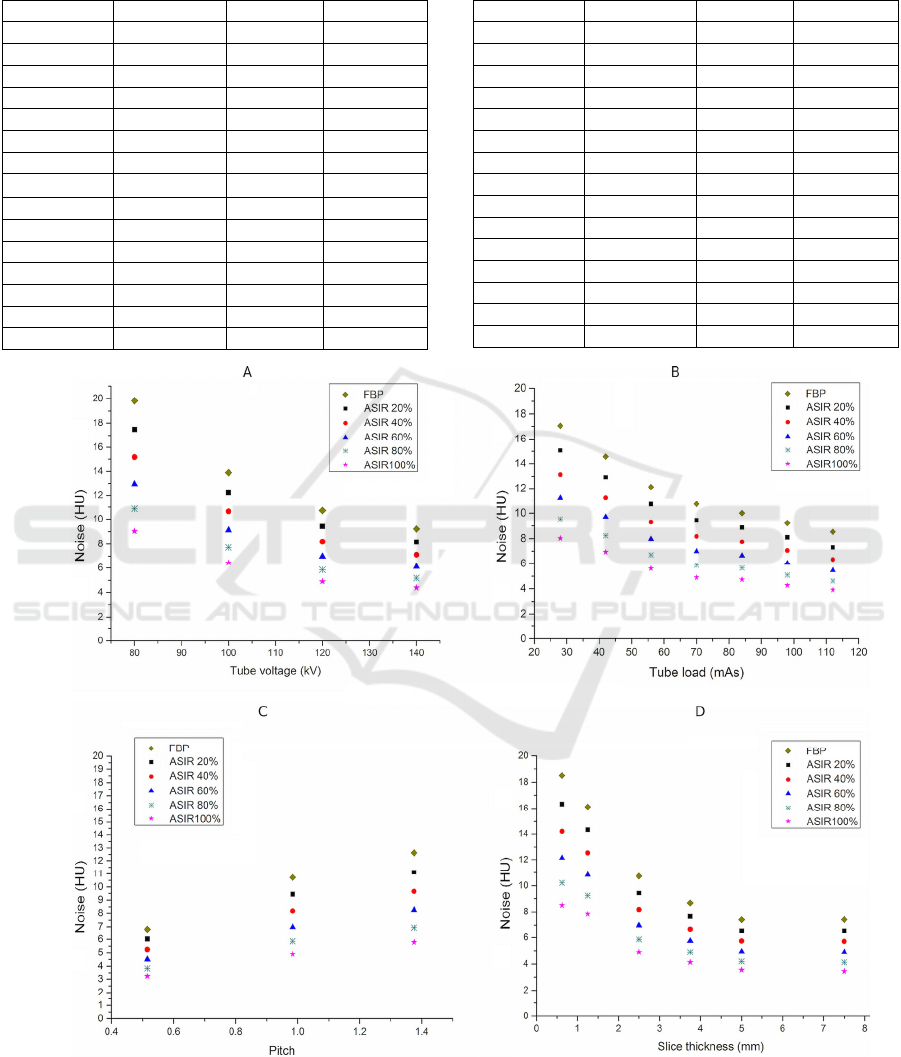
Table 3: CNR values (mean ± standard deviation) of teflon (high contrast)/ LDPE (medium contrast)/polystyrene (low
contrast) inserts of the Catphan-CTP404 module for FBP- and ASIR-recontructed CT images with different blending levels
(20%, 40%, 60%, 80%, 100%). Tube load ranges from 140 mAs to 28 mAs and acquisition parameters are reported in
Table 2.
Teflon LDPE Polystyrene
140 mAs
FBP 59.7 ± 3.9 14.8 ± 0.4 10.0 ± 0.6
ASIR 20% 65.8 ± 4.8 16.6 ± 0.4 11.2 ± 0.6
ASIR 40% 72.9 ± 5.8 18.8 ± 0.5 12.7 ± 0.8
ASIR 60% 81.1 ± 7.2 21.6 ± 0.7 14.6 ± 1.0
ASIR 80% 90.6 ± 9.0 24.9 ± 1.1 16.8 ± 1.2
ASIR 100% 100.5 ± 11.0 28.6 ± 1.6 19.2 ± 1.5
84 mAs
FBP 41.4 ± 3.6 11.1 ± 0.3 7.4 ± 0.5
ASIR 20% 52.7 ± 4.1 13.1 ± 0.4 8.8 ± 0.6
ASIR 40% 58.6 ± 5.7 14.8 ± 0.4 10.0 ± 0.7
ASIR 60% 65.5 ± 7.0 16.9 ± 0.8 11.5 ± 1.0
ASIR 80% 73.6 ± 8.8 19.4 ± 1.0 13.3 ± 1.3
ASIR 100% 82.5 ± 10.2 22.2 ± 1.5 15.4 ± 1.4
Teflon LDPE Polystyrene
56 mAs
FBP 36.4 ± 3.1 9.8 ± 0.3 6.1 ± 0.4
ASIR 20% 43.6 ± 4.4 11.1 ± 0.3 7.1 ± 0.6
ASIR 40% 48.5 ± 5.2 12.6 ± 0.4 8.0 ± 0.7
ASIR 60% 54.4 ± 6.9 14.4 ± 0.5 9.1 ± 0.9
ASIR 80% 61.2 ± 8.4 16.5 ± 0.9 10.5 ± 1.0
ASIR 100% 68.8 ± 9.8 19.0 ± 1.4 12.0 ± 1.3
28 mAs
FBP 26.8 ± 2.8 6.8 ± 0.3 3.4 ± 0.3
ASIR 20% 31.2 ± 3.0 .3 ± 0.3 4.9± 0.4
ASIR 40% 35.1 ± 4.3 8.3 ± 0.3 5.5 ± 0.4
ASIR 60% 39.8 ± 6.3 9.5 ± 0.5 6.3 ± 0.6
ASIR 80% 45.5 ± 7.0 10.9 ± 0.7 7.3 ± 0.8
ASIR 100% 51.9 ± 7.4 12.6 ± 0.7 8.4 ± 1.0
Figure 1: Noise (standard deviation) for conventional FBP algorithm and different ASIR blending levels of reconstruction
(20%, 40%, 60%, 80%, 100%) with varying tube potential (tube load 112 mAs, pitch 0.984, slice thickness 2.5 mm) (panel
A), tube load (tube potential 120 kVp, pitch 0.984, slice thickness 2.5 mm) (panel B), pitch (tube potential 120 kVp, tube
load 112 mAs, slice thickness 2.5 mm) (panel C) and slice thickness (tube potential 120 kVp, tube load 112 mAs, pitch
0.984) (panel D).
Evaluation of the Imaging Properties of a CT Scanner with the Adaptive Statistical Iterative Reconstruction Algorithm - Noise, Contrast and
Spatial Resolution Properties of CT Images Reconstructed at Different Blending Levels
203
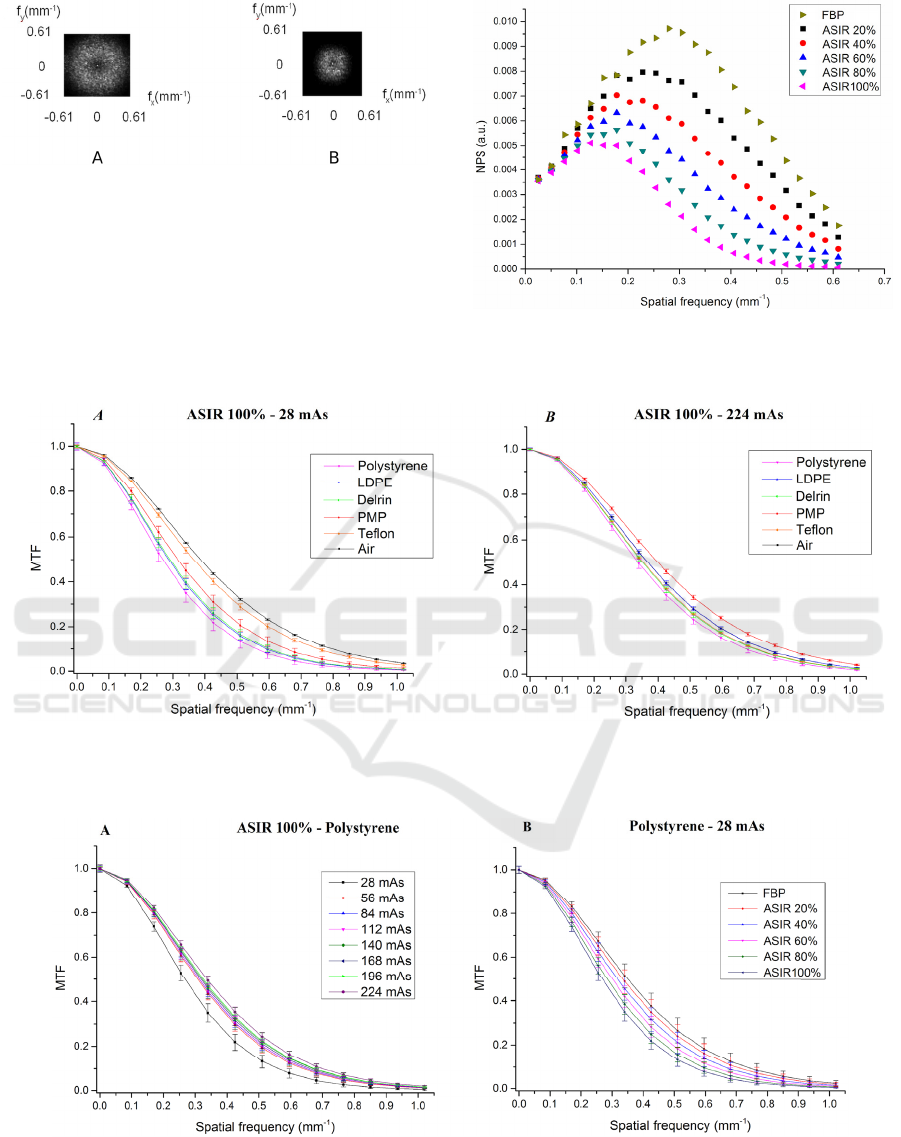
Figure 2: Visualization of the 3D NPS with respect to the
plane fz = 0 for conventional FBP (A) and ASIR with a
blending level of reconstruction of 100% (B). (The
maximum spatial frequency was determined by applying
the Nyquist sampling criterion). Images were acquired at
120 kVp, 112 mAs, slice thickness 2.5 and pitch 0.984.
Figure 3: Example (same parameters as Fig. 2) of radial
NPS for conventional FBP algorithm and ASIR algorithm
with different blending levels of reconstruction.
Figure 4: MTF for ASIR-reconstructed CT images (blending level of reconstruction of 100%) and low (28 mAs) (panel
A)/high (224 mAs) (panel B) tube load, with varying contrast level (polystyrene, LDPE, delrin, PMP, teflon, air).
Acquisition parameters are reported in Table 2.
Figure 5: MTF for ASIR-reconstructed CT images (blending level of 100%) and low (polystyrene) contrast level, with
varying tube load (28 mAs, 56 mAs, 84 mAs, 112 mAs, 140 mAs, 168 mAs, 196 mAs, 224 mAs), (panel A). MTF for low
(28 mAs) tube load and low (polystyrene) contrast CT images, with varying reconstruction methods (FBP (black) , ASIR
with 20% (red), 40% (blue), 60% (fuchsia), 80% (green) and 100% (violet) of blending level of reconstruction), (panel B).
Acquisition parameters are reported in Table 2.
BIODEVICES 2017 - 10th International Conference on Biomedical Electronics and Devices
204

4 DISCUSSION
In this quantitative phantom study, CT image quality
performance of two different reconstruction techno-
logies have been carefully evaluated.
We comprehensively characterised the physical
properties (in terms of several quality parameters
such as noise, NPS, MTF and CNR) of the ASIR-
reconstructed CT images using different blending
levels of reconstruction in a number of experimental
designs.
Our findings confirm the dose reduction potential
of ASIR (Richard et al., 2012; Samei et al., 2015;
Miéville et al., 2013; Smith, 2014 et al.; Brady et al.,
2012; McCollough et al., 2015; Yanagawa et al.,
2010). As compared to conventional FBP,
noise/CNR decreases (Fig. 1)/increases (Table 3) up
to 50%/100% when using ASIR. Also, ASIR does
not modify the typical noise dependence on the
acquisition parameters. Furthermore, the noise and
CNR vary non-linearly with the ASIR blending level
of reconstruction. In addition, NPS analysis (Fig. 3)
shows that ASIR acts as a low-pass filter and
modifies noise texture: for ASIR-reconstructed CT
images, the frequency of the maximum of the NPS
curve shifts non-linearly toward lower frequencies
with increasing blending level of reconstruction, in
agreement with the results of previous studies
(Samei et al., 2015; Miéville et al., 2013).
We assessed the spatial resolution by estimating
the MTF at different contrasts and exposure values.
We found that, unlike conventional FBP, the MTF
decreases with decreasing contrast and tube load. It
should be noted that, for lower contrast and tube
load, the MTF of ASIR-reconstructed images is
lower than that of FBP-reconstructed images, and
decreases with increasing blending level of
reconstruction.
Recent studies have shown that these effects may
affect low-contrast resolution and thus may
influence the performance of automatic contour
detection software (Precht et al., 2016).
When compared to conventional FBP reconstru-
ction, ASIR allows for an improvement of image
quality in terms of reduced noise and increased CNR,
and hence a potential dose reduction in CT imaging
can be obtained while preserving diagnostic
capabilities. However, ASIR can modify noise
texture as well as affect spatial resolution at low
contrast and radiation exposure. For these reasons,
the optimal ASIR blending level of reconstruction
(i.e. the best trade-off between image quality and
dose reduction) should be assessed for each specific
application through quantitative as well as subjective
analysis.
Because of the noise reduction and CNR
increment offered by ASIR, CT examinations can be
performed at reduced radiation exposure levels.
However, in order to avoid potential effects of losses
in spatial resolution, which are inherent to ASIR and
may reduce the diagnostic value of CT images, the
optimal blending level of reconstruction should be
assessed for each specific clinical application.
In this regard, CT follow-up examinations (Lim
et al., 2016; Precht et al., 2016) and screening
programs could benefit of this new reconstruction
technology. In particular, the use of ASIR in CT
screening programs – aimed at detecting small
contrast lesions with low dose – should be carefully
evaluated.
5 CONCLUSIONS
A relevant noise reduction and CNR increment in
CT images are achieved with the ASIR algorithm
with respect to the conventional FBP reconstruction
in different experimental designs. For this reason,
the iterative reconstruction approach represents an
effective method for optimizing dose in CT imaging.
However, for low dose and low contrast acquisitions
(typical for instance of screening programs) ASIR
can provide lower performance, in terms of reduced
spatial resolution capabilities, as compared to
conventional FBP, and its use, along with the choice
of the optimal blending level of reconstruction,
should therefore be carefully evaluated.
Moreover, this work lays the basis for further
studies on CT imaging with ASIR. In particular, our
recent interests are focused on the performance of a
Computed Aided Detection (CAD) system with
ASIR-reconstructed clinical images of the lung. In
fact, the CAD system has been developed by taking
into account the FBP-related appearance of the
images and therefore, an investigation on the CAD
response to the ASIR-reconstructed images could be
of considerable interest.
ACKNOWLEDGEMENTS
We would like to thank Prof. Duccio Volterrani,
Prof. Antonio Claudio Traino and Dr. Davide
Giustini for supporting this work.
Evaluation of the Imaging Properties of a CT Scanner with the Adaptive Statistical Iterative Reconstruction Algorithm - Noise, Contrast and
Spatial Resolution Properties of CT Images Reconstructed at Different Blending Levels
205

REFERENCES
McNitt-Gray M. F., 2002. AAPM/RSNA Physics tutorial
for residents: Topics in CT. Radiation dose in CT.
Radiographics; 22(6):1541–53.
Willemink M. J., de Jong P. A., Leiner T., de Heer L. M.,
Nievelstein RA, Budde R. P., Schilham AM., 2013.
Iterative reconstruction techniques for computed
tomography Part 1: Technical principles. European
Radiology; 23:1623–31.
Beister M., Kolditz D., Kalender W. A., 2012. Iterative
reconstruction methods in X-ray CT. Physica Medica;
28(2):94-108.
Argaud C. ASIR: a new reconstruction technique to lower
dose without compromise, ASIR whitepaper. GE
Healthcare (Waukesha, WI, USA).
Richard S., Husarik D. B., Yadava G., Murphy S. N.,
Samei E., 2012. Towards task-based assessment of CT
performance: system and object MTF across different
reconstruction algorithms. Medical Physics; 39(7):
4115-22.
Samei E. and Richard S. Assessment of the dose reduction
potential of a model-based iterative reconstruction
algorithm using a task-based performance metrology.
Medical Physics 2015; 42(1):314-23.
Miéville F. A., Gudinchet F., Brunelle F., Bochud F. O.,
Verdun F. R., 2013. Iterative reconstruction methods
in two different MDCT scanners: Physical metrics and
4-alternative forced-choice detectability experiments –
A phantom approach. Physica Medica; 2:99-110.
Siewerdsen J. H., Cunningham I. A., Jaffray D. A., 2002.
A framework for noise-power spectrum analysis of
multidimensional images. Medical Physics;
29(11):2655-71.
Verdun F. R., Racine D., Ott J. G., Tapiovaara M. J., Toroi
P., Bochud F. O., Veldkamp W. J., Schegerer A.,
Bouwman R. W., Giron I. H., Marshall N. W.,
Edyvean S., 2015. Image quality in CT: From physical
measurements to model observers. Physica Medica;
31(8):823-43.
Friedman S. N., Fung G. S. K., Siewerdsen J. H., Tsui B.
M. W., 2013. A simple approach to measure computed
tomography (CT) modulation transfer function (MTF)
and noise-power spectrum (NPS) using the American
College of Radiology (ACR) accreditation phantom.
Medical Physics; 40(5):051907.
Takenaga T, Katsuragawa S, Goto M, Hatemura M,
Uchiyama Y, Shiraishi J., 2015. Modulation transfer
function measurement of CT images by use of a
circular edge method with a logistic curve-fitting
technique. Radiological Physics and Technology;
8:53–59.
Smith E. A., Dillman J. R., Goodsitt M. M., Christodoulou
E. G., Keshavarzi N., Strouse P. J., 2014. Model-based
iterative reconstruction: Effect on patient radiation
dose and image quality in pediatric body CT.
Radiology; 270(2):526-34.
Brady S. L., Yee B. S., Kaufman R. A., 2012. Characteri-
zation of adaptive statistical iterative reconstruction
algorithm for dose reduction in CT: A pediatric
oncology perspective. Medical Physics; 39(9):5520-31.
McCollough C. H., Yu L., Kofler J. M., Leng S., Zhang Y.,
Li Z., Carter R. E., 2015.
Degradation of CT low-
contrast spatial resolution due to the use of iterative
reconstruction and reduced dose levels. Radiology;
276(2):499-506.
Yanagawa M., Honda O., Yoshida S., Kikuyama A., Inoue
A., Sumikawa H., Koyama M., Tomiyama N., 2010.
Adaptive statistical iterative reconstruction technique
for pulmonary CT: image quality of the cadaveric lung
on standard- and reduced-dose CT. Academic
Radiology; 17(10):1259-66.
Lim H., Chung M. J., Shin K. E., Hwang H. S., Lee K. S.,
2016. The impact of Iterative Reconstruction in Low-
Dose Computed Tomography on the Evaluation of
Diffuse Interstitial Lung Disease. Korean Journal of
Radiology; 17(6):950-60.
Precht H., Kitslaar P. H., Broersen A., Dijkstra J., Gerke
O., Thygesen J, Egstrup K, Lambrechtsen J., 2016.
Influence of Adaptive Statistical Iterative
Reconstruction on coronary plaque analysis in corona-
ry computed tomography angiography. Journal of
Cardiovascular Computed Tomography; 10(6):507-16.
BIODEVICES 2017 - 10th International Conference on Biomedical Electronics and Devices
206
