
Comparing Machine Learning Approaches for Fall Risk Assessment
Joana Silva
1
, João Madureira
1
, Cláudia Tonelo
2
, Daniela Baltazar
3
, Catarina Silva
3
, Anabela Martins
3
Carlos Alcobia
2
and Inês Sousa
1
1
Fraunhofer Portugal AICOS, Porto, Portugal
2
Sensing Future Technologies, Coimbra, Portugal
3
ESTeSC Coimbra Health School, Physiotherapy Department, Coimbra, Portugal
Keywords: Fall Risk Assessment, Inertial Sensors, Pressure Platform, Timed-up and Go Test, Sit-to-Stand, 4-Stage
Test, Machine Learning, Classification, Regression.
Abstract: Traditional fall risk assessment tests are based on timing certain physical tasks, such as the timed up and go
test, counting the number of repetitions in a certain time-frame, as the 30-second sit-to-stand or observation
such as the 4-stage balance test. A systematic comparison of multifactorial assessment tools and their
instrumentation for fall risk classification based on machine learning approaches were studied for a
population of 296 community-dwelling older persons aged above 50 years old. Using features from inertial
sensors and a pressure platform by opposition to using solely the tests scores and personal metrics increased
the F-Score of Naïve Bayes classifier from 72.85% to 92.61%. Functional abilities revealed higher
association with fall level than personal conditions such as gender, age and health conditions.
1 INTRODUCTION
Fall risk assessment methods have been studied
aiming to estimate the risk of falling in order to
identify those at higher risk and timely apply the
appropriate actions to prevent falls. This kind of
assessment can take the form of questionnaires,
simple screenings or more comprehensive
multidimensional fall risk assessments.
Falls are described as a complex phenomenon
caused by the interaction of multiple risk factors. To
assess the risk of falling, it is necessary to identify
the factors that increase an older person’s risk of
falling. Intensive research has been conducted in
order to identify specific risk factors (Ambrose,
Paul, and Hausdorff 2013; Rubenstein 2006; Oliver
et al. 2004), which can increase the likelihood of a
fall occurrence. The idea behind these studies is to
develop preventive strategies based on the identified
risk factors.
According to Rubenstein et al. (Rubenstein and
Josephson 2002) the most common underlying
causes and risk factors for falls include muscle
weakness, gait and balance problems, visual
impairment, cognitive impairment, depression,
functional decline, and particular medications,
especially in the presence of environmental hazards.
Similarly to Physiological Profile Assessment
(PPA) (Lord, Menz, and Tiedemann 2003), we
intend to evaluate the functional ability of subjects
and potential impairments that may be related with
an increased risk of falling, irrespective of the
existence of an underlying disease causing them.
Traditional functional assessment tests are based
on timing certain physical tasks, such as the timed
up and go (TUG) test (Beauchet et al. 2011),
counting the number of repetitions in a certain time-
frame, as the 30-second sit-to-stand (STS) (Jones,
Rikli, and Beam 1999) or observation, such as
balance tests (Agrawa et al. 2011), in particular the
4-stage balance test (4-Stage) (Rossiter-Fornoff et al.
1995; Thomas et al. 2014), or the Tinetti
Performance Oriented Mobility Assessment
(POMA) (Tinetti 1986). A systematic review of
multifactorial and functional mobility assessment
tools for fall risk (Scott et al. 2007) compares
several studies for community settings.
In this paper, the three fall risk assessment
functional tests, TUG, STS and 4-Stage, that have
been also used in the follow-up of the participants of
the Otago Falls Prevention Program, were
instrumented with wearable inertial sensors and a
Silva J., Madureira J., Tonelo C., Baltazar D., Silva C., Martins A., Alcobia C. and Sousa I.
Comparing Machine Learning Approaches for Fall Risk Assessment.
DOI: 10.5220/0006227802230230
In Proceedings of the 10th International Joint Conference on Biomedical Engineering Systems and Technologies (BIOSTEC 2017), pages 223-230
ISBN: 978-989-758-212-7
Copyright
c
2017 by SCITEPRESS – Science and Technology Publications, Lda. All rights reserved
223

pressure platform for the extraction of several
metrics to perform a comparison with the functional
tests’ scores for the differentiation of fall risk
groups. Machine learning approaches were studied
using a fall level as the classification output.
2 METHODS
2.1 Subjects
A total of 296 subjects voluntarily participated in the
study. Informed consents were obtained from all
participants who responded to personal information,
health, previous falls inquiries and completed the
three instrumented assessment tests: TUG, STS and
4-stage. The data collection took place in different
environments, mostly at community (76.0%), at day-
care centres (15.9%), and at nursing homes (8.1%).
Demographic and anthropometric information
was annotated for all the subjects along with health
related information from two questionnaires: health
conditions and medication intake. Fall related
information was inquired using a history of falls
questionnaire.
The mean age of the sample was 70.2 years (93
persons with age below 65 years), the majority of
the subjects were women (68.2%), 25.0% lived
alone, 51.0% only have primary education and
11.5% use an assistive device. Diabetes was the
most prevalent health condition (15.5%), followed
by osteoarthritis (14.2%) and osteoporosis (10.8%).
Urinary incontinence was reported by 22.3%
(answering the question: do you leak urine when you
cough, laugh, sneeze or lift an object?); fear of
falling was reported by 47.0% (answering the
question: are you afraid of falling?); 57.4% of the
persons referred to intake 4 or more different
medicines per day (mean was 4.52 medicines).
During the previous year 30.7% of the persons
have fallen (18.9% outdoors) and 8.1% underwent to
the emergency service (hospital). The wrist/hand
fracture was the most common injury (2.4%) among
these persons.
2.2 Screening Protocol
This section describes the fall risk assessment tests
applied in this study:
Timed Up and Go Test (TUG) fast pace: the
person is asked to start seated on a chair and when
test starts, the person should stand up, walk straight
for 3 meters, as fast as the person can, turn around,
walk back to the chair and sit down (Beauchet et al.
2011). Test score corresponds to the time needed to
perform TUG test (TUG duration). A threshold of
10s has been found to be associated with falls
occurrence in a 12 months follow up period for
community-dwelling older adults (Rose, Debra J,
Jones, Jessie C, and Lucchese, Nicole 2002).
30 Seconds Sit-to-stand Test (STS): the person is
instructed to sit on a chair and repeatedly stand up
and sit down as many times as possible over 30
seconds (Jones, Rikli, and Beam 1999). The person
must be seated in the middle of the chair, feet should
approximately width apart and placed on the floor,
and arms crossed by the wrists placed against the
chest. Final score of this test is the number of times
the person completes a cycle of sit-to-stand and
stand-to-sit (number of STS cycles). While normative
levels are dependent on age and sex (Rikli and Jones
2010), a score of less than 15 transitions in the 30
seconds test duration has been used to identify
“fallers” in a group of elderlies (Cho et al. 2012).
4 Stage Balance Test “modified”: the person is
instructed to progressively maintain four foot
positions for 10 seconds each, without moving
his/her feet or needing support. The positions are:
side by side stance, semi-tandem stance, tandem
stance and unipedal stance (Rossiter-Fornoff et al.
1995; Thomas et al. 2014). For each position the
subjects were instructed to stand quietly without
shoes on the pressure platform, with their arms along
the body. In this study, except for the one leg stand
position, all positions must be performed with eyes
open and then closed. The final score of this test is
the number of positions a person can hold for 10
seconds without losing balance (number of 4-stage
exercises). The inability to complete the tandem
stance position has been associated with higher risk
of falling (Murphy et al. 2003).
The tests were applied by trained health
professionals. Prior to the execution of tests, the test
procedure was explained to each person and it was
demonstrated how the test should be performed.
Auditory cues were also used to instruct the person
during the execution of the tests. Only persons who
performed the three functional tests (TUG, STS and
4-stage) were included in this study.
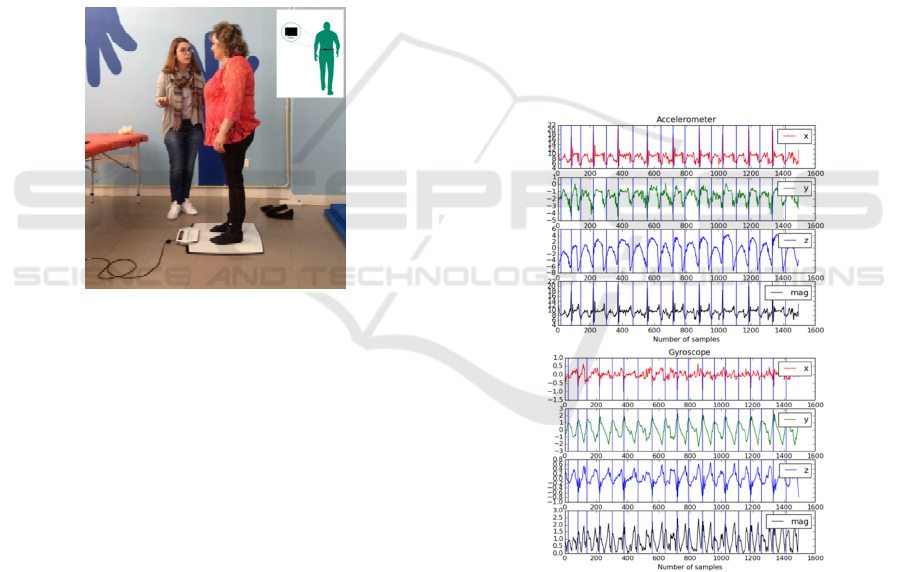
2.3 Instrumentation
The participants were instrumented with one
wearable inertial sensor during the execution of
TUG and 30-seconds sit-to-stand tests. The 4-stage
balance test was performed on a pressure platform,
as can be seen in Figure 1.
The wearable sensor was developed and
BIOSIGNALS 2017 - 10th International Conference on Bio-inspired Systems and Signal Processing
224
assembled at Fraunhofer AICOS and was placed at
the lower back. Inertial data was collected using the
built-in 3-axial accelerometer and 3-axis gyroscope,
both sampled at 50 Hz. Raw data from the inertial
sensors were acquired for all the tests in m/s
2
.
The pressure distribution data was measured with
PhysioSensing platform (Sensing Future
Technologies, Lda) running at frequency of 50Hz. It
contains 1600 pressure sensors of size 10mm by
10mm with maximum value of 100N/sensor.
Voltage data is converted with an 8-bit A/D
converter and is transmitted via USB (Universal
Serial Bus). In this way it is possible to receive raw
data of each pressure sensor as well as the raw
center of pressure coordinates (CoP), in cm. In order
to obtain more precision in CoP displacements, an
algorithm was employed to obtain CoP positions in
mm, using the matrix of pressure sensors (Hsi 2016).
Figure 1: Example of a test set-up, with the pressure
platform in the floor and an illustration of the inertial
sensor placement of at the lower back, since it is covered
by the clothes.
2.4 Inertial Sensors Data Analysis
The accelerometer and gyroscope signals were
synchronized and used to segment the TUG test into
its several components (stand up, walk forward, turn
around, walk back to the chair and sit down) as
previously described in (Silva and Sousa 2016) and
to identify the stand and sit phases of the STS test.
Identification of the STS transition points was made
analysing the y-axis of the gyroscope signal. After
filtering the signal with a moving average filter of 20
samples window size, zero crossings were identified
(Guimaraes, Ribeiro, and Rosado 2013). In order to
remove outliers, a minimum of 20 samples were
used as difference between consecutive transition
points. Since the score is given by the total number
of complete cycles, it was considered one cycle
between two transitions points, one sit-to-stand and
one stand-to-sit. The number of cycles is therefore
half the number of transitions points identified, as
illustrated in Figure 2.
For each one of the TUG segments and for the
whole STS test, statistical and frequency domain
features were extracted from the magnitude of the
accelerometer signal. The list of features has been
reported in (Silva and Sousa 2016) and corresponds
to: mean, median, maximum, minimum, signal
height, standard deviation, median deviation, root
mean square, inter quartile range, number of times
the magnitude signal crosses the mean value,
energy, entropy, skewness, kurtosis, average of
minima, average of maxima, average signal height,
fundamental harmonic of Fast Fourier Transform
(FFT) spectrum and fundamental amplitude.
Additional metrics for each test were calculated
from the inertial data: for the TUG test, the duration
of the stand segment (duration of the first segment)
and the number of steps (calculated with a step
counter algorithm reported by (Aguiar et al. 2014))
taken during the test; for the STS test, the number of
STS cycles and the STS power (Zhang et al. 2014).
Figure 2: Axis x (red), y (green), z (blue) and magnitude
signals (black) of the accelerometer and gyroscope signals
for STS test with identification of transition points with
blue vertical lines. The interval between two consecutive
lines is considered as one STS cycle. Figures are from a
low risk person.
2.5 Pressure Platform Data Analysis
For each posture of the 4-stage balance test
executed, the pressure values on each sensor of the
Comparing Machine Learning Approaches for Fall Risk Assessment
225
pressure platform were recorded. The centre of
pressure (CoP) coordinates were then obtained and
several parameters, which are typically used in
postural sway and fall risk assessment (Bigelow and
Berme 2011; Guimaraes, Ribeiro, and Rosado 2013;
Raymakers, Samson, and Verhaar 2005) were
calculated.
For all the medio-lateral (ML) and antero-
posterior (AP) CoP position coordinates obtained
during each posture execution, the mean (mean AP
CoP positions, ML mean CoP positions), standard
deviation (std AP CoP positions, std ML CoP
positions), root mean square (rms AP CoP positions,
rms ML CoP positions), maximum (max AP CoP
positions, max ML CoP positions) and minimum
(min AP CoP positions, min ML CoP positions)
were calculated.
The displacement of CoP in each direction per
time unit gave rise to the mean velocity of CoP
displacement (vm CoP position AP, vm CoP position
ML) metrics.
Another metric extracted was the area of a
confidence ellipse containing 95% of the CoP
coordinates projected in a 2D plan (Ellipse area).
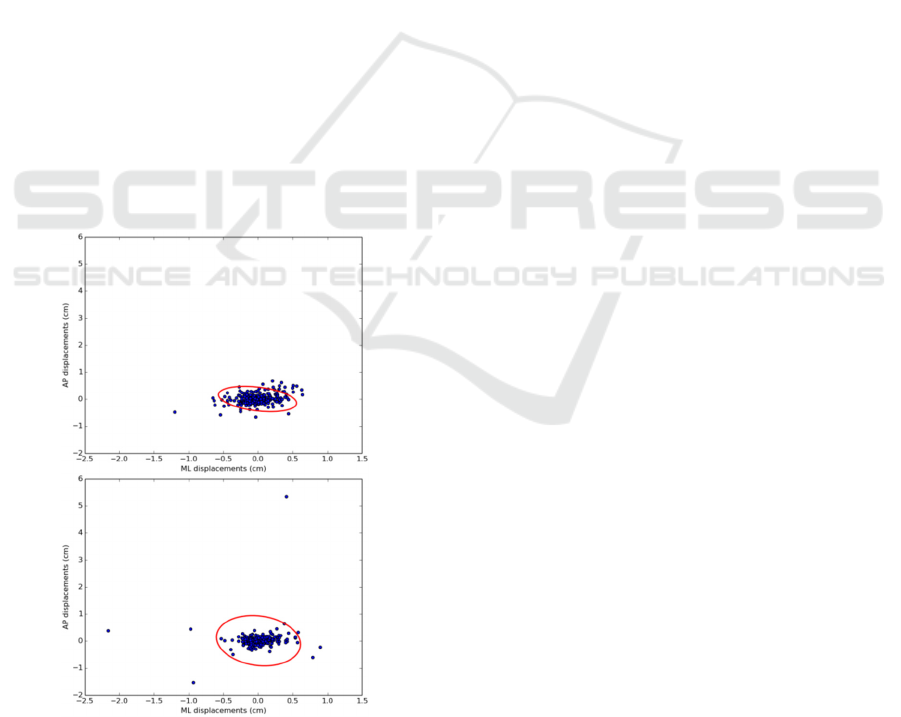
Figure 3 shows a comparison of CoP displacements
in ML and AP directions for two persons with
different fall risk levels during the semi-tandem
stance with eyes closed. For a low fall risk person
Figure 3: CoP displacements in ML and AP directions and
95% confidence ellipse area (red line) during semi-tandem
stance with eyes closed of 4-stage test. Top figure is from
a low risk person and botton figure is from a high risk
person, showing more outliers in ML and AP directions.
(top figure) the displacement is concentrated around
the centre, however for a high fall risk person, more
outliers in ML and specially in AP direction are
identified, reflecting unbalance situations.
Sway can be defined, in this scope, as the
amplitude or absolute distance of CoP oscillations.
The sum of all the distances accumulated during the
execution of each posture is computed resulting in
the CoP path length (total Sway distance). The
standard deviation of sway distances (std Sway) and
the maximum and minimum amplitude of CoP
oscillations (maxSway and minSway) were also
included as pressure platform metrics.
2.6 Machine Learning Methods
Classification and regression methods were tested to
differentiate between high and low fall risk groups
using metrics extracted from inertial sensors and
pressure platform. Rapid Miner Toolkit was used for
the train and test processes. Ten-fold cross
validation with random split was used for all the
processes. In order to define a metric to divide the
groups, a fall level was determined based on the
history of falls questionnaire and usage of walking
aid, as presented in Figure 4, since these two factors
have evidence to be more related with risk of falling.
The fall level is merely an indication if the person
shows more or less probability of falling, since the
falls occurrence in a 12 months follow up period was
not possible to measure. The dimension of the
population is 296 subjects. The low risk group
represents 83% of the dataset and is composed by
245 subjects (35% within 50-65y.o. and 65% above
65y.o.). The high risk group represents 17% of the
dataset and contains the remaining 51 subjects (16%
within 50-65y.o. and 84% above 65y.o.). This
distribution is in agreement with the falls incidence
in the elderly population, which is less than 30%
(Bergen, Stevens, and Burns 2016).
Two approaches were compared: first only
personal metrics and tests scores were used to
construct the feature vector, and then this vector was
replaced with features extracted from inertial sensors
and pressure platform. The objective was to study
the added value of the sensors features to
differentiate between fall risk groups.
BIOSIGNALS 2017 - 10th International Conference on Bio-inspired Systems and Signal Processing
226
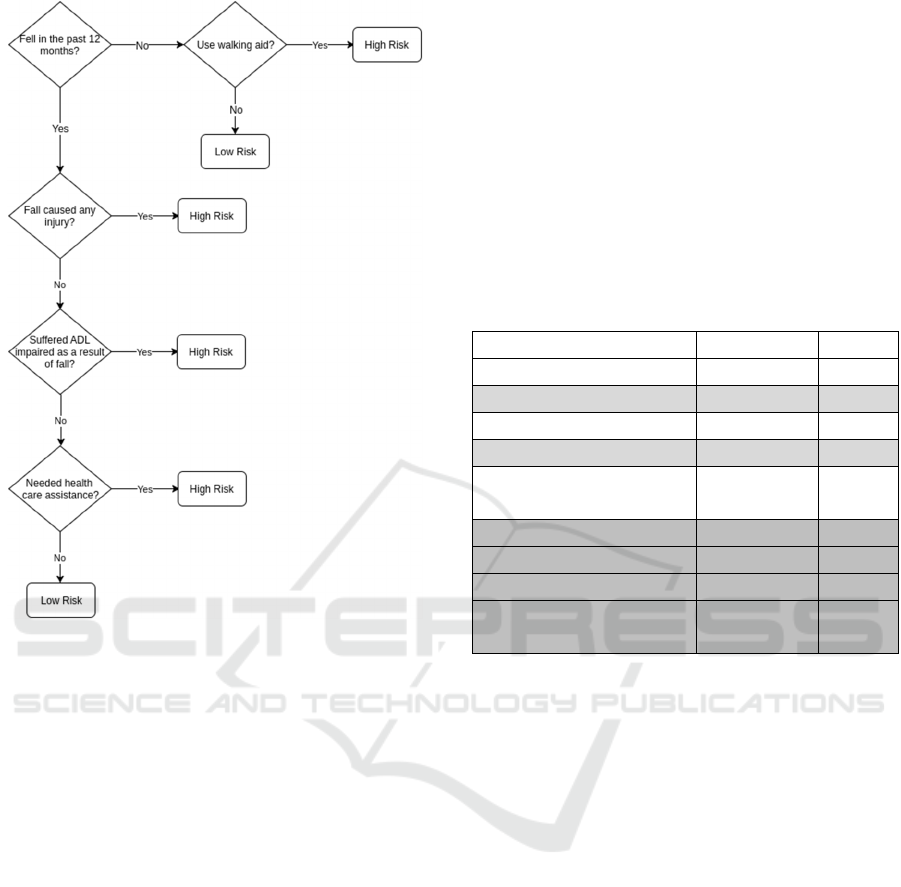
Figure 4: Fall level definition based on history of falls and
usage of walking aid.
The performance of several classification and
regression methods was compared based on
accuracy, precision, recall and F-Score. It was
considered low risk as the positive class and high
risk as the negative class. TP states for true positive,
FP for false positive, TN for true negative and FN
for false negative. The performance metrics are
calculated as follows:
Precision (P) = TP / (TP+FP)
(1)
Recall (R) = TP / (TP+FN)
(2)
Accuracy = (TP+TN) / (TP+TN+FP+FN)
(3)
F-Score = (2P x R) / (P+R)
(4)
3 RESULTS & DISCUSSION
3.1 Statistical Analysis
A statistical analysis has been conducted for the
variables: gender, age, body mass index (BMI),
number of medicines, number of health conditions,
fear of falling, TUG score, STS score and 4-stage
score. Cut-off values that have been used in previous
studies referred in the introduction section of this
paper to distinguish high and low fall risk levels
were applied to each of these variables. The Fisher’s
exact test was applied with the null hypothesis that
there are no non-random associations between the
two categorical variables: fall level and each of the
variables considered. The Fisher’s exact test p-value
and odds ratio (OR) are reported in Table 1 and were
calculated with Matlab function fishertest.
Table 1: Odds Ratio and Fisher's exact test p-value for
personal metrics and tests scores with the fall level.
Variable Odds Ratio p-value
Feminine Gender 1.04 1.00
Age > 65 2.86 0.01
BMI < 13.7 or BMI > 29.7 1.58 0.18
More than 4 Medicines 1.96 0.05
More than 2 Health
Conditions
1.56 0.38
Has Fear of Fall 3.35 0.00
TUG Duration > 10 s 6.51 0.00
STS Cycles < 15 11.25 0.00
Not completed 10s Tandem
Stance (eyes open)
3.59 0.00
Presence of fear of falling, TUG duration above
10 seconds, number of STS cycles below 15 and not
completed the tandem stance with eyes open were
the metrics with higher odds ratio with the fall level
and p-value below 0.05. Thus, the hypothesis of
random association between fall level and the
variables in shaded lines of Table 1 can be rejected.
Age above 65 years old and take more than 4
medicines per day also showed a p-value below 0.05
but the OR was lower than for the previously
mentioned variables. For the remaining variables,
the conclusion is that female individuals, or
individuals that have BMI lower than 13.7 or higher
than 29.7 or that have more than two health
conditions do not have greater odds of having a high
fall level than individuals that are male, have a
normal BMI and have less than two health
conditions. In general, tests scores showed higher
association with fall level than personal metrics,
reflecting that functional abilities have higher impact
on fall level than personal conditions of a person.
3.2 Machine Learning Approaches
Classification and regression methods were studied
Comparing Machine Learning Approaches for Fall Risk Assessment
227

for the differentiation between low and high fall risk
groups using the fall level as label. All algorithms
applied were retrieved from the Rapid Miner
predictive models.
3.2.1 Functional Tests Scores
As a first analysis, personal metrics (age, gender,
BMI, fear of fall, number of health conditions and
number of medicines) and test scores (TUG
duration, number of STS cycles and number of 4-
stage exercises) were used to define the feature
vector and fall level as label. The results are
summarized in Table 2.
Table 2: Classification and regression results with
personal metrics and functional tests scores. Accuracy,
precision, recall and F-Score are in percentage (%).
Algorithm Accuracy Precision Recall
F-
Score
k-NN, k=4 81.41 69.33 63.00 66.01
Naïve
Bayes
84.82 74.58 71.19 72.85
Random
Forest
83.13 59.37 53.05 56.03
Decision
Tree
81.44 68.28 60.33 64.06
Neural Net 82.45 69.22 64.84 66.96
SVM 82.45 49.08 51.21 50.12
Linear
Regression
83.11 69.01 56.05 61.86
Logistic
Regression
82.13 67.48 64.88 66.15
Naïve Bayes classifier obtained the higher accuracy,
84.82%. Precision was 74.58% and recall was
71.19%. Random Forest and Linear Regression also
obtained acceptable results. In general, all
algorithms showed higher precision than recall.
3.2.2 Sensors Features
In order to compare the previous results based on
tests scores with the features extracted from inertial
sensors and pressure platform, a feature vector
containing 224 sensors features was used. For each
TUG segment (stand, walk, turn and walk back) 19
statistical and frequency domain features were
extracted, yielding 76 features plus 2 metrics, time
to stand and the number of steps. For STS test, the
same 19 features were extracted plus 2 metrics, the
number of STS cycles and the STS power. For the 4-
stage test, 17 CoP metrics were extracted for each
one of the 7 exercises (when available), yielding 119
features. Additionally, 6 personal metrics were
added: age, gender, BMI, fear of fall, number of
health conditions and number of medicines. Fall
level was used as label. Since the number of features
was considerable high, forward feature selection was
applied prior to cross validation. Results are
presented in Table 3.
Table 3: Classification and regression results for personal
metrics and features extracted from sensors. Number of
features selected by forward feature selection follows the
name of the algorithm. Accuracy, precision, recall and F-
Score are in percentage (%).
Algor. Accuracy Precision Recall F-Score
k-NN, k=4
[5 F.]
85.78 87.79 95.88 91.66
Naïve
Bayes
[4 F.]
87.16 88.18 97.50 92.61
Neural Net
[5 F.]
87.20 88.05 97.94 92.73
SVM
[3 F.]
84.82 84.95 99.23 91.54
Random
Forest
[3 F.]
87.48 87.92 98.43 92.88
Decision
Tree [5 F.]
88.17 89.47 97.10 93.13
Linear
Reg. [3 F.]
85.89 85.66 99.55 92.08
Logistic
Reg. [4 F.]
86.54 86.74 98.78 92.37
Decision tree classifier obtained the higher
accuracy, 88.17%. Precision was 89.47% and recall
was 97.10%. Comparing the results of Naïve Bayes
with the previous analysis, the features obtained
from sensors yield higher accuracy than only tests
scores. Moreover, features from TUG and 4-stage
tests were frequently selected with forward feature
selection method. For all algorithms tested, features
from sensors provide higher precision and recall
values. F-Score obtained with features from sensors
were the same across all algorithms tested and
considerable higher than F-Score obtained only with
tests scores and personal metrics (91-93% against
50-72%).
4 DISCUSSION
Previous studies from (Scott et al. 2007) have
compared the accuracy of several functional tests
and fall risk tools to differentiate groups with
BIOSIGNALS 2017 - 10th International Conference on Bio-inspired Systems and Signal Processing
228

different levels of fall risk. Despite the differences in
protocol and population analysed (only for
community settings and validated in a prospective
study), similar accuracy and sensitivity were
reported. Murphy et al. (Murphy et al. 2003)
concluded that ‘floor transfer’ and ‘50 ft walk’ tests
combined can discriminate fallers from non-fallers
with an overall accuracy of 96% (82% sensitivity
and 100% specificity).
A similar study from Liu et al. (Liu et al. 2011)
has used metrics from instrumented TUG, alternate
step test and 5 times STS to classify between fallers
and non fallers and the best models have achieved
70% accuracy (68% sensitivity and 73% specificity).
5 CONCLUSIONS
The objective of this study was to compare the
performance of functional tests scores and features
obtained from inertial sensors and pressure
platforms to discriminate between low and high risk
of fall. A fall level was defined based on history of
falls and usage of walking aid and was used as label
in classification and regression algorithms. Only
subjects who performed the three functional tests
(TUG, STS and 4-stage) were included in this study.
The association between functional tests scores
and fear of falling with fall level are not random
(Fisher’s exact test p-value < 0.05), concluding that
individuals with functional disabilities and fear of
falling have greater odds of having a higher fall level
than individuals without physical disabilities and
without fear of falling. Moreover, when comparing
personal metrics with fall level, it was concluded for
some personal metrics that random association with
fall level cannot be excluded.
The differentiation power of personal metrics
and tests scores was considerable different when
tested with classification and regression methods.
Accuracies above 80% were obtained for all
algorithms. Naïve Bayes outperforms with an
accuracy of 84.82% (74.58% of precision and
71.19% of recall).
However, features from inertial sensors and
pressure platform obtained better results for the
same algorithms than only tests scores. Naïve Bayes
classifier obtained an accuracy of 87.16% (88.18%
of precision and 97.50% of recall).
These results support the conclusion that
instrumentation of fall risk assessment tests with
inertial sensors and pressure platform could better
discriminate the individuals at a higher risk of
falling.
ACKNOWLEDGEMENTS
Authors would like to thank all participants and
centres, clinics and other entities hosting the
screenings. Financial support from project
FallSensing: Technological solution for fall risk
screening and falls prevention (POCI-01-0247-
FEDER-003464), co-funded by Portugal 2020,
framed under the COMPETE 2020 (Operational
Programme Competitiveness and
Internationalization) and European Regional
Development Fund (ERDF) from European Union
(EU).
REFERENCES
Agrawa, Yuri, John P. Carey, Howard J. Hoffman, Daniel
A. Sklare, and Michael C. Schubert. 2011. ‘The
Modified Romberg Balance Test: Normative Data in
U.S. Adults’. Otology & Neurotology 32 (8): 1309–11.
doi:10.1097/MAO.0b013e31822e5bee.
Aguiar, B., J. Silva, T. Rocha, S. Carneiro, and I Sousa.
2014. ‘Monitoring Physical Activity and Energy
Expenditure with Smartphones’. In 2014 IEEE-EMBS
International Conference on Biomedical and Health
Informatics (BHI), 664–67. doi:10.1109/BHI.2014.
6864451.
Ambrose, Anne Felicia, Geet Paul, and Jeffrey M
Hausdorff. 2013. ‘Risk Factors for Falls among Older
Adults: A Review of the Literature’. Maturitas 75 (1):
51–61. doi:10.1016/j.maturitas.2013.02.009.
Beauchet, Olivier, B. Fantino, G. Allali, S. W. Muir, M.
Montero-Odasso, and C. Annweiler. 2011. ‘Timed up
and Go Test and Risk of Falls in Older Adults: A
Systematic Review’. The Journal of Nutrition, Health
& Aging 15 (10): 933–38. doi:10.1007/s12603-011-
0062-0.
Bergen, Gwen, Mark R. Stevens, and Elizabeth R. Burns.
2016. ‘Falls and Fall Injuries Among Adults Aged ≥65
Years — United States, 2014’. MMWR. Morbidity and
Mortality Weekly Report 65 (37): 993–98.
doi:10.15585/mmwr.mm6537a2.
Bigelow, Kimberly Edginton, and Necip Berme. 2011.
‘Development of a Protocol for Improving the Clinical
Utility of Posturography as a Fall-Risk Screening
Tool’. The Journals of Gerontology. Series A,
Biological Sciences and Medical Sciences 66 (2): 228–
33. doi:10.1093/gerona/glq202.
Cho, Kang Hee, Soo Kyung Bok, Young-Jae Kim, and
Seon Lyul Hwang. 2012. ‘Effect of Lower Limb
Strength on Falls and Balance of the Elderly’. Annals
of Rehabilitation Medicine 36 (3): 386–93.
doi:10.5535/arm.2012.36.3.386.
Guimaraes, V., D. Ribeiro, and L. Rosado. 2013. ‘A
Smartphone-Based Fall Risk Assessment Tool:
Measuring One Leg Standing, Sit to Stand and Falls
Efficacy Scale’. In 2013 IEEE 15th International
Comparing Machine Learning Approaches for Fall Risk Assessment
229

Conference on E-Health Networking, Applications
Services (Healthcom), 529–33. doi:10.1109/
HealthCom.2013.6720733.
Hsi, Wei-Li. 2016. ‘Analysis of Medial Deviation of
Center of Pressure after Initial Heel Contact in
Forefoot Varus’. Journal of the Formosan Medical
Association = Taiwan Yi Zhi 115 (3): 203–9.
doi:10.1016/j.jfma.2015.03.004.
Jones, C. Jessie, Roberta E. Rikli, and William C. Beam.
1999. ‘A 30-S Chair-Stand Test as a Measure of
Lower Body Strength in Community-Residing Older
Adults’. Research Quarterly for Exercise and Sport 70
(2): 113–19. doi:10.1080/02701367.1999.10608028.
Liu, Ying, S.J. Redmond, Ning Wang, F. Blumenkron,
M.R. Narayanan, and N.H. Lovell. 2011. ‘Spectral
Analysis of Accelerometry Signals From a Directed-
Routine for Falls-Risk Estimation’. IEEE Transactions
on Biomedical Engineering 58 (8): 2308–15.
doi:10.1109/TBME.2011.2151193.
Lord, Stephen R., Hylton B. Menz, and Anne Tiedemann.
2003. ‘A Physiological Profile Approach to Falls Risk
Assessment and Prevention’. Physical Therapy 83 (3):
237–52.
Murphy, Mary A, Sharon L Olson, Elizabeth J Protas, and
Averell R Overby. 2003. ‘Screening for Falls in
Community-Dwelling Elderly’. Journal of Aging and
Physical Activity 11 (1): 66–81.
Oliver, David, Fergus Daly, Finbarr C. Martin, and
Marion E. T. McMurdo. 2004. ‘Risk Factors and Risk
Assessment Tools for Falls in Hospital in-Patients: A
Systematic Review’. Age and Ageing 33 (2): 122–30.
doi:10.1093/ageing/afh017.
Raymakers, J. A., M. M. Samson, and H. J. J. Verhaar.
2005. ‘The Assessment of Body Sway and the Choice
of the Stability Parameter(s)’. Gait & Posture 21 (1):
48–58. doi:10.1016/j.gaitpost.2003.11.006.
Rikli, RE, and JC Jones. 2010. ‘Functional Fitness
Normative Scores for Community-Residing Older
Adults, Ages 60–94’. Human Kinetics Journals. April
21. http://journals.humankinetics.com/japa-back-
issues/japavolume7issue2april/functional-fitness-
normative-scores-for-community-residing-older-
adults-ages-60-94.
Rose, Debra J, Jones, Jessie C, and Lucchese, Nicole.
2002. ‘Predicting the Probability of Falls in
Community-Residing Older Adults Using the 8-Foot
Up-and-Go: A New Measure of Functional Mobility’.
Journal of Ageing and Physical Activity 10 (4): 466–
75.
Rossiter-Fornoff, J. E., S. L. Wolf, L. I. Wolfson, and D.
M. Buchner. 1995. ‘A Cross-Sectional Validation
Study of the FICSIT Common Data Base Static
Balance Measures. Frailty and Injuries: Cooperative
Studies of Intervention Techniques’. The Journals of
Gerontology. Series A, Biological Sciences and
Medical Sciences 50 (6): M291-297.
Rubenstein, Laurence Z. 2006. ‘Falls in Older People:
Epidemiology, Risk Factors and Strategies for
Prevention’. Age and Ageing 35 (suppl 2): ii37-ii41.
doi:10.1093/ageing/afl084.
Rubenstein, Laurence Z., and Karen R. Josephson. 2002.
‘The Epidemiology of Falls and Syncope’. Clinics in
Geriatric Medicine 18 (2): 141–58.
Scott, Vicky, Kristine Votova, Andria Scanlan, and
Jacqueline Close. 2007. ‘Multifactorial and Functional
Mobility Assessment Tools for Fall Risk among Older
Adults in Community, Home-Support, Long-Term and
Acute Care Settings’. Age and Ageing 36 (2): 130–39.
doi:10.1093/ageing/afl165.
Silva, Joana, and Ines Sousa. 2016. ‘Instrumented Timed
Up and Go: Fall Risk Assessment Based on Inertial
Wearable Sensors’. In 2016 IEEE International
Symposium on Medical Measurements and
Applications (MeMeA) (MeMeA 2016). Benevento,
Italy.
Thomas, Julia C., Charles Odonkor, Laura Griffith, Nicole
Holt, Sanja Percac-Lima, Suzanne Leveille, Pensheng
Ni, Nancy K. Latham, Alan M. Jette, and Jonathan F.
Bean. 2014. ‘Reconceptualizing Balance: Attributes
Associated with Balance Performance’. Experimental
Gerontology 57 (September): 218–23.
doi:10.1016/j.exger.2014.06.012.
Tinetti, Mary E. 1986. ‘Performance-Oriented Assessment
of Mobility Problems in Elderly Patients’. Journal of
the American Geriatrics Society 34 (2): 119–26.
Zhang, Wei, G. Ruben H. Regterschot, Hana Schaabova,
Heribert Baldus, and Wiebren Zijlstra. 2014. ‘Test-
Retest Reliability of a Pendant-Worn Sensor Device in
Measuring Chair Rise Performance in Older Persons’.
Sensors (Basel, Switzerland) 14 (5): 8705–17.
doi:10.3390/s140508705.
BIOSIGNALS 2017 - 10th International Conference on Bio-inspired Systems and Signal Processing
230
