
Supporting Software Architecture Evolution by
Functional Decomposition
∗
David Faitelson
1
, Robert Heinrich
2
and Shmuel Tyszberowicz
3
1
Afeka Tel-Aviv Academic College of Engineering, Tel Aviv, Israel
2
Institute for Program Structures and Data Organization, Karlsruhe Institute of Technology, Karlsruhe, Germany
3
School of Computer Science, The Academic College Tel Aviv-Yaffo, Tel Aviv, Israel
Keywords:
Decomposition, Coupling, Cohesion, Visualization, Evolution, Maintenance.
Abstract:
Software systems evolve during their lifetime to reflect the changes in their users needs. However, unless
implemented carefully, such changes may degrade the quality of the system’s architecture by reducing the co-
hesion and increasing the coupling between its subsystems. It is therefore important to systematically analyze
the changes and modify the system’s structure to accommodate the changes without degrading the system’s
architecture. However, looking just at functional aspects is not enough, because we may decide on a redesign
that is too expensive to implement. In this paper we combine a functional decomposition analysis technique
with a nonfunctional impact analysis technique to avoid this pitfall. The functional decomposition technique
generates a set of plausible decompositions that accommodate the required evolutionary changes, and the im-
pact analysis technique acts as a filter that selects only those decompositions that satisfy the cost constraints
of the required changes. We briefly describe both techniques and then illustrate the approach with an example
of a parking lot management system.
1 INTRODUCTION
A good software architecture arranges the system into
a set of highly cohesive yet lowly coupled subsys-
tems. However, as time goes by and the system
evolves, more functionality is added. As a result, the
coupling of subsystems tends to increase and their
cohesion decreases. Thus the system becomes less
understandable for developers, resulting in declining
quality and a system that is more difficult to main-
tain. Software evolution cannot be prevented because
software systems that do not evolve become progres-
sively less useful (Lehman, 1980). It is therefore im-
portant to ensure that the architecture’s quality does
not degrade as the software evolves (Cuesta et al.,
2013) (Williams and Carver, 2010).
In previous work (Faitelson and Tyszberowicz,
2015) we have described a technique for systemati-
cally decomposing a system into subsystems. We can
use this technique to evaluate the effects of evolution-
ary changes to the system’s structure, and to find good
∗
This work has been partially supported by GIF (grant
No. 1131-9.6/2011) and the DFG (German Research Foun-
dation) under the Priority Programme SPP1593.
functional decompositions that will prevent the struc-
ture from degrading. However, if we ignore nonfunc-
tional constraints, we may not be able to implement
the changes: for example, the cost of implementing
them may be too high or the performance of the sug-
gested decomposition might be too low. Therefore,
we must assess the nonfunctional implications of the
suggested decompositions and find a compromise that
balances both the functional modularity of the system
and the nonfunctional constraints.
Our contribution is an approach that addresses
exactly this challenge. It combines two seemingly
unrelated approaches: one is the functional decom-
position approach described above, and the other
is the KAMP
1
approach (Rostami et al., 2015) for
architecture-based maintenance effort estimation. By
using them together, we ensure a good balance of
functional modularity and nonfunctional concerns.
We illustrate our approach with an example of
an evolving parking lot management system. When
given a set of new functional requirements, we use
our approach to select a good subsystem decompo-
sition while staying within the budget allocated for
1
Karlsruhe Architectural Maintainability Prediction
Faitelson D., Heinrich R. and Tyszberowicz S.
Supporting Software Architecture Evolution by Functional Decomposition.
DOI: 10.5220/0006206204350442
In Proceedings of the 5th International Conference on Model-Driven Engineering and Software Development (MODELSWARD 2017), pages 435-442
ISBN: 978-989-758-210-3
Copyright
c
2017 by SCITEPRESS – Science and Technology Publications, Lda. All rights reserved
435

implementing the new requirements.
The reminder of the paper is structured as follows.
In Section 2 we introduce the running example. The
functional decomposition approach is described in
Section 3. In Section 4 we explain how we transform
the decomposition notation into a notation that the
KAMP tool suite can understand. In Section 5 we de-
scribe the KAMP approach. Section 6 combines func-
tional decomposition with architecture-based change
impact analysis. We then conclude with related work
and a short summary.
2 RUNNING EXAMPLE
We use a parking lot management system as a running
example. The parking lot has a set of parking spaces,
a camera that detects license plate numbers, and an
entrance gate that it may open (or close) to allow cars
to enter the parking lot.
2
In addition, it maintains a
registry of authorized cars—only authorized cars may
enter the parking lot. Table 1 summarizes the opera-
tions provided by the system.
Table 1: A summary of the operations provided by the park-
ing lot management system.
Operation Description
approach a car is detected by the entry sensor
leave a car at the gate drives away
enter a car enters the parking lot
exit a car exits the parking lot
park a car parks at a parking space
depart a car departs from its parking space
add authorize a car to enter the lot
remove unauthorize a car
We use a relational framework to model the sys-
tem. The system’s state variables hold sets or rela-
tions that represent the information that the system
keeps track of. For example, the variable inside holds
the set of cars that are currently inside the parking lot,
and the variable parked records which cars are parked
in which parking spaces. We model system operations
using predicates that specify the behavior of the oper-
ation in terms of current and new system states. See
Fig. 1 for a summary of the system model. The entire
model (given in the Alloy (Jackson, 2012) notation) is
available online: http://goo.gl/m5gnW3. For a more
detailed exposition of relational models see (Faitelson
and Tyszberowicz, 2015).
2
Cars leave the parking lot through a one way exit gate.
Parking Lot
atGate: lone Car
inside : set Car
authorized : set Car
available : set Space
occupiedBy : Space → Car
parked : Car → Space
depart
exit
approach leave
enter
park add remove
Figure 1: A subsystem diagram that summarizes the entire
parking lot system. The system is displayed as a box with its
name at the top and the list of state variables inside the box.
The system operations appear as line segments emanating
from the box, each labeled with the operation name. The
keyword lone means a set of at most one member.
3 SYSTEM DECOMPOSITION
As we have argued in (Faitelson and Tyszberowicz,
2015), rather than using classes as atomic units of de-
composition, it is better to take individual relations
(associations and attributes) as atomic units of decom-
position. We can then partition them between the sub-
systems according to how they are used by the system
operations. This also facilitates selection of good de-
compositions (i.e., low coupling and high cohesion).
In our approach, we visualize the relationships be-
tween the system operations and the state variables
that they access in such a way that we can recognize
clusters of dense relationships that are weakly con-
nected to other clusters. Each such cluster is a good
candidate for a component. In the rest of this section
we illustrate how we use our approach to partition the
parking lot management system into subsystems. To
visualize the clusters, we begin by recording—in an
operation/relation table—the usage relationships be-
tween the system operations and the state variables
that they read and manipulate. For each system oper-
ation we note which relational state variables it reads
and writes. Table 2 records the operation/relation de-
pendencies in the parking lot system. The informa-
tion necessary to build this table is taken from the
functional model of the system. An operation reads
a variable if it references the variable only at the cur-
rent system state. An operation writes to a variable if
the variable is referenced in the next system state.
From the operation/relation table we build an
undirected bipartite graph whose vertices are the sys-
tem’s state variables and operations. An edge con-
MODELSWARD 2017 - 5th International Conference on Model-Driven Engineering and Software Development
436
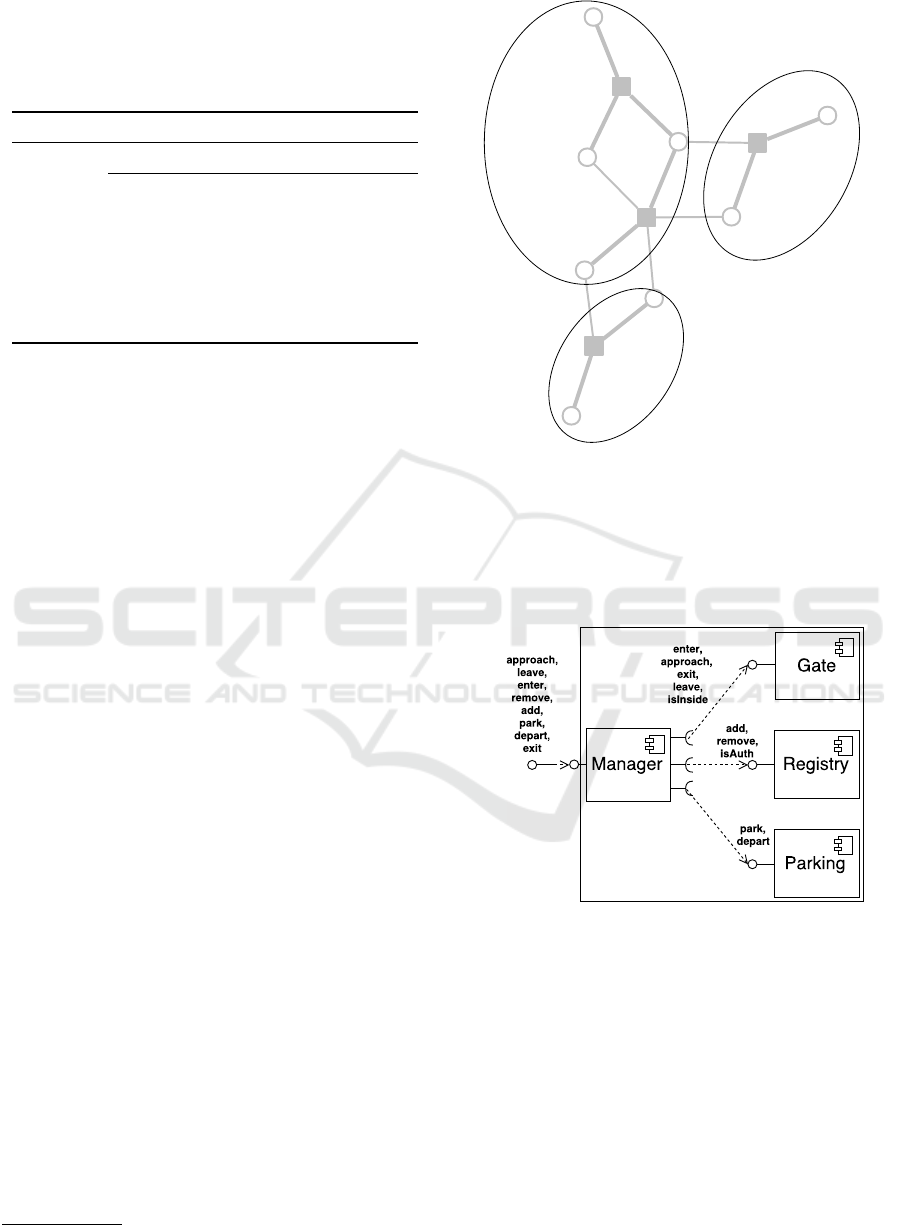
Table 2: An operation/relation table for the parking lot sys-
tem. Each column represents one state variable and each
row represents one operation. If the operation in the i-th
row reads (writes) the state variable in the j-th column, the
table’s (i, j) entry will contain r (w).
Operation State variable (relation)
inside atGate authorized parked
approach r w
leave w
add w
remove r w
enter w w r
exit w r
park r w
depart w
nects operation p to variable v if and only if p uses v
(either reads or writes to v). We also assign a weight
to each edge, depending on the nature of the con-
nection. A read connection has the lowest weight
(currently 1) and a write connection has the highest
weight (currently 2). Finally, we use a spring model
based drawing algorithm (Kamada and Kawai, 1989)
to visualize the graph.
3
The algorithm draws undi-
rected graphs such that nodes that are close to each
other in graph theoretic space are close to each other
in the drawing. The result clearly visualizes the de-
pendencies between the operations and system’s state
variables. For instance, we can see in Fig. 2 that
the atGate state variable is used by just three oper-
ations: enter, approach, and leave. No other oper-
ation needs this variable. Similarly, the authorized
state variable is used only by enter, remove, and add.
Figure 2 shows a partition based on the graph. Fig-
ure 4 presents a subsystem diagram that summarizes
the structure of the decomposition, and Fig. 3 shows
the UML version of this decomposition.
Note that in this decomposition style, there is no
direct communication between the subsystems. In-
stead, the system itself must orchestrate the informa-
tion flow between the subsystems. For example, to
implement the enter operation, the system first asks
the registry subsystem if the vehicle is authorized to
enter, and then directs the gate subsystem to open
the gate. This significantly reduces the coupling be-
tween the subsystems, because they are now com-
pletely oblivious to the existence of each other. The
effect is similar to the pipe and filter architectural
style, but instead of insulating the subsystems from
each other with pipes, there is a single system man-
ager component that insulates the subsystems. The
role of the system manager is similar to that of the
control object in the entity/boundary/control design
3
More specifically, we use NEATO (North, 2004).
approach
leave
add
remove
enter
exit
park
depart
inside
atGate
authorized
parked
G R
P
Figure 2: A dependency diagram of the parking lot with a
suggested partition. Each subsystem candidate is enclosed
in an ellipse. The edges that cross the partitions (when they
exist) are few and weak. This partition corresponds to the
decomposition in Section 3: (P) manages which car parks
in which space, (R) manages the authorized list, and (G)
manages the entry and exit to and from the parking lot.
Figure 3: Component model of the initial parking system.
classification (Jacobson et al., 1992), but instead of
orchestrating the control flow of individual objects, it
manages entire subsystems.
4 MAPPING DECOMPOSITION
DIAGRAMS TO UML
COMPONENT DIAGRAMS
Because the KAMP approach requires the system ar-
chitecture to be presented in the form of a UML-
Supporting Software Architecture Evolution by Functional Decomposition
437

Gate
atGate: lone Car
inside: set Car
Registry
authorized: set Car
Parking
available: set Space
occupiedBy : Space → Car
parked : Car → Space
exit
approach
leave
isInside
enter
isAuth
remove
enter
park
depart
remove
add
Figure 4: A subsystem diagram of the parking lot. Each box
holds a subset of the system’s state variables and operations.
All system operations must appear in the diagram. When a
system operation is supported by a single subsystem, we
draw a line on the border of the subsystem labeled with the
operation’s name. When several subsystems collaborate to
support a system operation, we connect the operations of
each subsystem to the system operation. E.g., there are ar-
rows from the gate enter and registry isAuth operations to
the system enter operation since enter requires the cooper-
ation of the gate and the registry subsystems.
like component diagram (cf. (Reussner, Ralf H. et
al., 2016)), we must transform the decomposition di-
agrams produced by the functional decomposition ap-
proach to UML component diagrams. However, be-
cause UML component diagrams do not support a re-
lationship of used-by
4
between system and subsystem
level operations, we must introduce the system man-
ager component explicitly into the diagram.
Given a subsystem diagram, we can create a UML
component diagram which serves as input to KAMP
by the following procedure: (1) Create a system com-
ponent with a provides interface for all system oper-
ations. (2) In the system component, create a com-
ponent for each subsystem with a provides interface
for all subsystems operations. (3) In the system com-
ponent, create a manager component with a provides
interface for all system operations and a requires in-
terface for all the interfaces provided by the subsys-
tems. (4) Connect each subsystem operation to the
corresponding requires interface of the manager. (5)
Use a delegation connector to connect each system
operation to the corresponding manager operation.
To illustrate this transformation, compare Fig. 4 to
the corresponding component diagram in Fig. 3.
4
The requires/provid es connection is a used-by relation-
ship between components, not between operations.
5 ARCHITECTURE-BASED
CHANGE IMPACT ANALYSIS
The KAMP approach aims at supporting software ar-
chitects assessing the effects of change requests on
technical and organizational work areas during soft-
ware evolution. KAMP supports modeling the ini-
tial software architecture, named the base architec-
ture, and the architecture after a certain change re-
quest is implemented in the model, the target ar-
chitecture. Examples of such modifications may be
adding new features for guest visitors and reserved
parking spaces in the parking lot management sys-
tem. Then, the KAMP tools calculate the differences
between the base and the target architectural models,
analyses the propagation of changes, and generates a
maintenance task list reflecting the structural propa-
gation of changes as well as corresponding mainte-
nance tasks such as test case development and execu-
tion, build and deployment configuration updates.
KAMP consists of: (i) meta-models to describe
system parts and their dependencies, (ii) a procedure
to automatically identify system parts to be changed
for a given change request, and (iii) a procedure to
automatically derive required change tasks, to sim-
plify the identification of a change effort and thus the
maintainability estimation. KAMP relies on the in-
sight that effort estimation for fine-grained tasks is
much easier and more reliable than for course-grained
tasks. Aggregating the estimations for the single tasks
allows for estimating the overall effort for implement-
ing a change.
In previous work, KAMP has been used to ana-
lyze change propagation in architectural models for
solving performance bottlenecks, e.g. by replacing a
database (Heinrich et al., 2015) or by splitting an in-
terface (Heger and Heinrich, 2014). In the next sec-
tion we will use KAMP to assess the impact of evo-
lutionary functional changes on the nonfunctional as-
pects of the system.
6 IMPACT ANALYSIS EXAMPLE
After the parking lot management system has been
working for a while, the customer asked to extend its
functionality with two major features. The first fea-
ture is the ability to reserve parking spaces in advance
and the second one is to support occasional, visiting,
guests. Guests must ask for an entrance permit for a
specific date. We have added these two features to the
original parking lot model. The system diagram of the
updated parking lot management system is shown in
Fig. 5. Then we have updated the operation/relation
MODELSWARD 2017 - 5th International Conference on Model-Driven Engineering and Software Development
438
Parking Lot
atGate: lone Car
inside : set Car
authorized : set Car
available : set Space
occupiedBy : Space → Car
parked : Car → Space
guest : Car → Date
avail :set Space
reserved : Space → Car
enter
exit
reserve
unreserve
approach leave
depart
park add addguest remove
Figure 5: A subsystem diagram that summarizes the en-
tire updated parking lot system. We have added operations
for reserving parking spaces, and state variables that record
guests and reserved parking spaces.
approach
leave
add
remove
enter
exit
park
depart
reserve
unreserve
inside
atGate
authorized
guest
reserved
parked
avail
G
R
P
U
Figure 6: The dependency diagram of the parking lot after it
was extended with two features: guest visitors and reserved
parking spaces. We also see the partition that we have se-
lected. The community detection algorithm has suggested
the same partition. We can see that the old structure was
preserved but that subsystem R has additional functionality
to support the management of guests, and a new subsystem
was introduced to manage the reservations.
table, from which we rebuilt the bipartite graph which
then was visualized. Fig. 6 shows a partition based on
the visualized graph.
After performing the decomposition, the system
has changed as follows. We have added a new subsys-
tem (Reservations) to manage the reserved parking
spaces, and we have added to the Registry subsystem
a new variable (guest) to keep track of guests. The
new variable keeps track of the dates on which guest
cars may enter the parking lot. The Gate and Parking
subsystems were not affected by these changes. Fig-
ure 7 presents the subsystem diagram of the evolved
system after adding the two new features.
Gate
atGate: lone Car
inside: set Car
Registry
authorized: set Car
guest : Car → Date
Reservations
avail : set Space
reserved : Space → Car
Parking
available: set Space
occupiedBy : Space → Car
parked : Car → Space
exit
approach
leave
enter
isInside
remove
isAuth
addguest
enter
park
depart
remove
add
reserve
unrserve
isReserved
park
isOccupied
Figure 7: Subsystem diagram of the evolved system. The
registry subsystem has an additional variable (guest) that
records which guest cars may enter at which dates. In ad-
dition there is a new subsystem that manages parking space
reservations. Reserving a car requires cooperation with the
registry and parking subsystems.
We will now apply KAMP to assess the impact of
the new decomposition in terms of the cost of imple-
menting the changes. To apply KAMP we operate in
three phases: preparation phase, analysis phase, and
interpretation phase. In the preparation phase, an ar-
chitectural model is created by using a meta-modeled
architecture description languages (Reussner, Ralf H.
et al., 2016). In our running example, the architectural
model represents the initial parking lot system (base
architecture), as depicted in Fig. 3. Each compo-
nent in the base architecture is annotated with several
test cases, a build script, and deployment information.
Furthermore, another architectural model (target ar-
chitecture) is created to reflect the parking lot system
after modification, as depicted in Fig. 8. This archi-
tectural model reflects the restructuring, if necessary,
according to our approach.
Supporting Software Architecture Evolution by Functional Decomposition
439
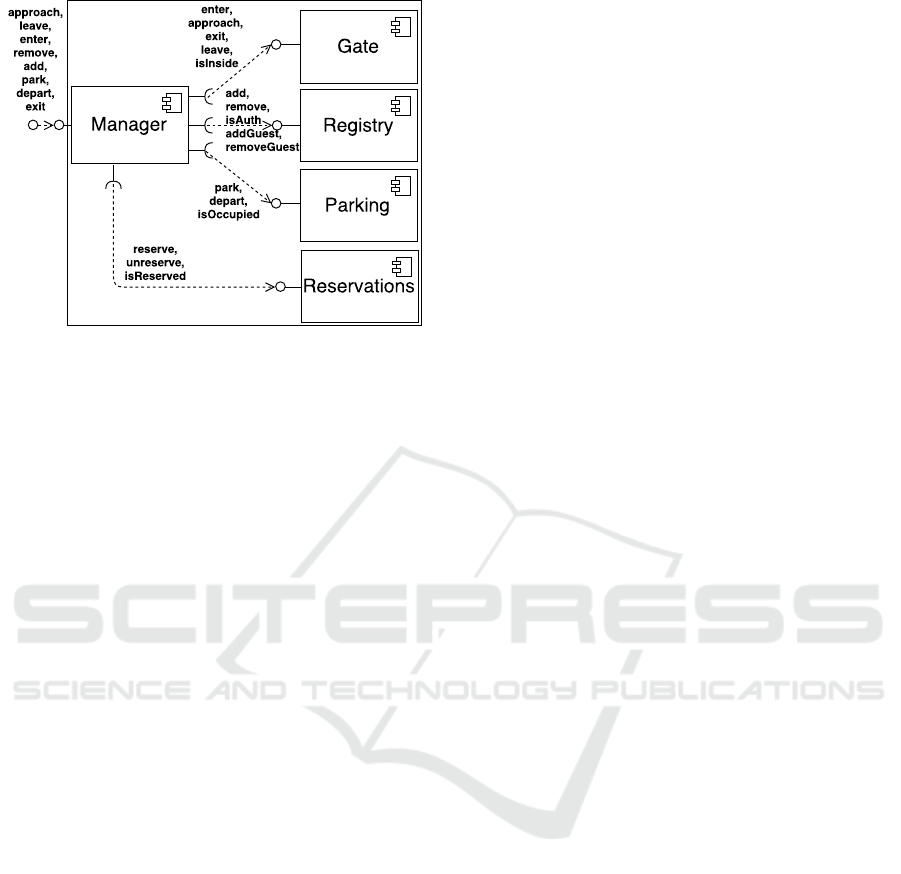
Figure 8: Component model of the evolved parking lot man-
agement system.
In the analysis phase, KAMP automatically calcu-
lates the expected structural changes and their prop-
agation, while transferring the base architecture into
the target architecture. First the delta between the ini-
tial architectural model and the evolved architectural
model is determined automatically by a model diff.
Each delta results in a change request to the system,
which is the starting point of the change propagation
in KAMP (Rostami et al., 2015).
In step 1, changes are propagated through the sys-
tem along the interfaces between the components.
The result of the change propagation is a task list of
detailed maintenance tasks for each change request,
directly derived from the architecture. See the middle
columns of Table 3.
In step 2, annotations to the components—test
cases, built scripts, and deployment information—are
applied to extend the task list for additional main-
tenance tasks. For example, three test cases must
be added for the new Reservations component, one
for each of the operations reserve, unreserve, and
isReserved. Moreover, a build script and the deploy-
ment of the new component must be specified. The
test cases for the operations of the parking compo-
nent must be modified, as the new parking functional-
ity in the evolved systems uses the Reservations com-
ponent. Furthermore, the registry component in the
evolved system provides functionality for guest park-
ing. Thus, existing test cases may be modified, and
new test cases must be added. The task list is extended
by the corresponding tasks, as shown in excerpts of
test cases for the reservation functionality in Table 3.
Finally, in the interpretation phase, change efforts
are estimated by software developers based on the
task list identified by KAMP. To illustrate, we pro-
vide hypothetical cost estimates for each task. These
estimates are not a part of KAMP; however, they are
important for determining if we can implement the
changes within the given budget. We have determined
the costs by considering the effort it takes to imple-
ment not only the functionality but also the user inter-
face, testing, optimization, etc. In our estimates it is
more expensive to add a new component compared to
incorporating the functionality into the existing com-
ponents. This reflects the fact that in order to create
a more modular and reusable system we must often
invest more time and effort upfront (hopefully reap-
ing the rewards in the future). We use these estimates
to illustrate the approach; however one may come up
with different estimates, in which case the decisions
may be different, but the approach remains the same.
Table 3 shows an excerpt of the maintenance tasks
and costs. The budget provided for the tasks in the
table is limited to 9 Man/Months. On the left side
we list the cost of adding a new Reservations com-
ponent and on the right we list the cost of incorpo-
rating the new functionality into the existing compo-
nents. Unfortunately, the maintainability analysis re-
veals that the cost of decomposing the system accord-
ing to the original functional analysis is too high (11
Man/Months). That is, in this case, it is not possible to
implement the more modular design within the given
budget (9 Man/Months).
This result demonstrates a typical situation in the
engineering of complex systems. We cannot use a
greedy approach to solve the problem, as optimizing
one aspect (functional decomposition) without regard
for others (implementation cost) may result in a bad
solution. In this case it will cost too much to im-
plement. Instead, we must find a compromise that
results in a good overall solution. That is, a sys-
tem with good modularity that can be implemented
within the given budget. One reasonable compromise
is to merge the Reservations and the Registry com-
ponents. The result can be seen in Fig. 10. Whereas
merging the two components reduces the cohesion of
the Registry component, it also lowers the develop-
ment cost to an acceptable level. We replace the four
Man/Month units of work that went into the devel-
opment of a new Reservations component with one
Man/Month of work for adding the reservation func-
tionality to the existing Registry component. The rest
of the work has not changed. As a result the total cost
is reduced to 9 Man/Months, exactly as allowed by
the budget.
7 RELATED WORK
Vanya et-al. (Vanya et al., 2013) suggest to assess the
current decomposition by considering its past evolu-
MODELSWARD 2017 - 5th International Conference on Model-Driven Engineering and Software Development
440
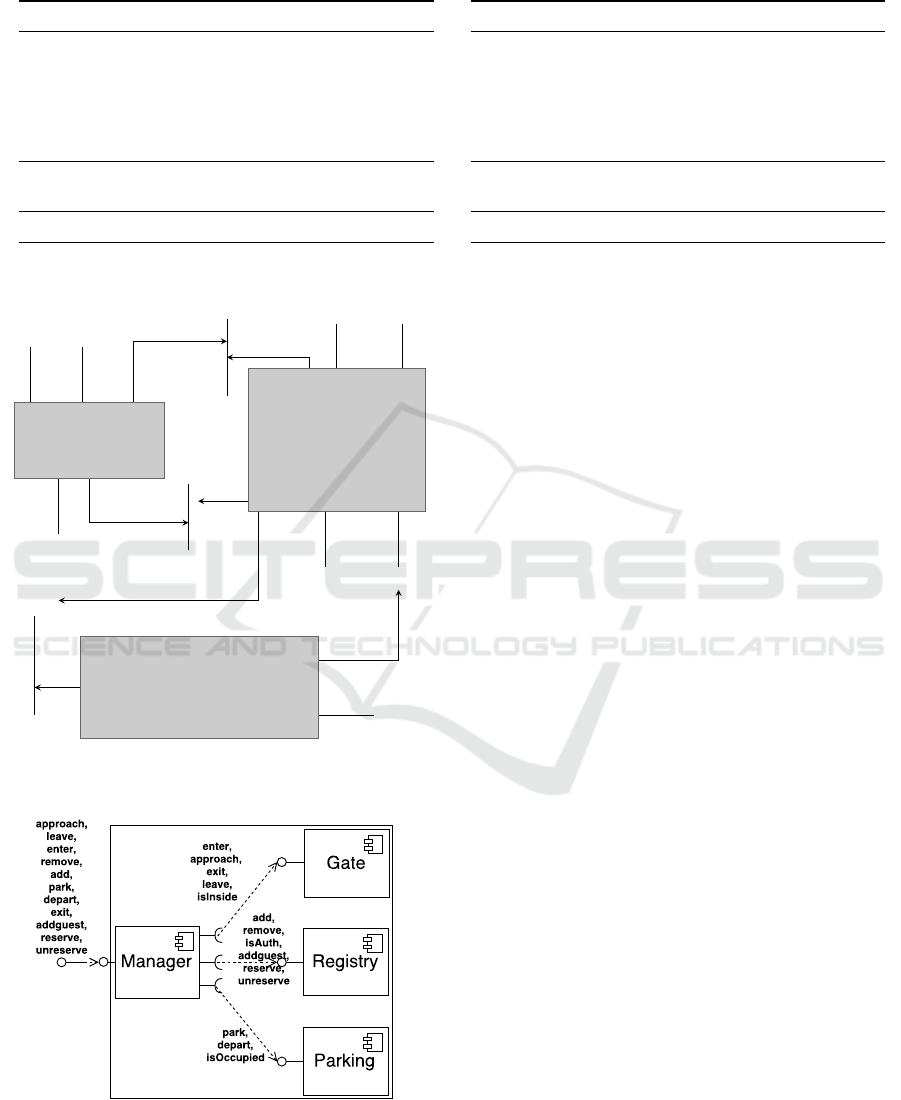
Table 3: Task lists produced by KAMP. On the left we see the cost estimate for the version in which we add a new reservation
component, and on the right we see the cost estimate for the version in which we only modify existing components.
Step Maintenance Task Cost
1
add Component Reservation 4
add Provided Interface of Reservations 1
add Required Interface of Manager 1
modify Component Manager 2
modify Provided Interface of Manager 1
modify Provided Interface of System 1
2
Add test cases for reserve(), 1
unreserve(), and isReserved()
total cost 11
Cost estimation for adding a new component
Step Maintenance Task Cost
1
modify Provided Interface of Registry 1
modify Component Registry 2
modify Required Interface of Manager 1
modify Component Manager 2
modify Provided Interface of Manager 1
modify provided Interface of System 1
2
Add test cases for reserve(), 1
unreserve(), and isReserved()
total cost 9
Cost estimation for modifying existing components
Gate
atGate: lone Car
inside: set Car
Registry
authorized: set Car
guest : Car → Date
avail : set Space
reserved : Space →
Car
Parking
available: set Space
occupiedBy : Space → Car
parked : Car → Space
exit
approach
leave
enter
isInside
remove
remove
add
addguest
enter
park
depart
isAuth
unreserve reserve
isReserved
park
isOccupied
Figure 9: Subsystem diagram of the alternative decomposi-
tion that groups reservations with the registry.
Figure 10: A revised component model of the evolved park-
ing lot management system.
tion, searching for components that often changed to-
gether. This is useful for assessing the current state
of the system; however, unlike our work, it cannot be
used to evaluate the impact of future changes.
An approach to restructuring software architec-
tures to support engineers with modernizing existing
legacy systems is introduced in (Streekmann, 2011).
There are two important differences between this
work and our work. First, it expects the user to manu-
ally supply dependency weights between the original
system elements. Second, it takes the target decompo-
sition as a given goal. Thus this work is more relevant
for the actual process of implementing the transfor-
mation, whereas our work is more relevant for ini-
tially exploring the space of possible transformations.
Work related to change effort identification and
maintainability estimation can be put into four cate-
gories as described in (Rostami et al., 2015): (i) Task-
based project planning, e.g. COCOMO II (Boehm
et al., 2000), only applies coarse-grained architec-
tural artifacts which make accurate predictions dif-
ficult. (ii) Architecture-based project planning, e.g.
(Paulish and Bass, 2001), and (iii) Architecture-based
software evolution, e.g. (Garlan et al., 2009), do
not support change effort estimation and impact anal-
ysis. (iv) Scenario-based architecture analysis, e.g.
(Clements et al., 2002), use the architecture to de-
compose planned software changes into various tasks
to realize the changes. However, exiting approaches
only use a structural view of the architecture and
therefore do not consider management costs.
8 SUMMARY
As illustrated in this paper, determining the system’s
architecture by considering a single aspect is danger-
ous, because we might ignore other essential aspects
of the system. We have seen that if we simply follow
Supporting Software Architecture Evolution by Functional Decomposition
441

the ideal functional decomposition (in terms of cou-
pling and cohesion), the implementation cost might
be too high. On the other hand, without a system-
atic functional analysis we may reduce the cost of the
decomposition but degrade the system’s modularity.
Thus, the two approaches are essential. The designer
must use them in tandem to explore and filter the de-
sign space, and to eventually converge on a good solu-
tion that balances the functional and the nonfunctional
concerns. In consequence, the approach proposed in
this paper not only allows for identifying the effort
for implementing a new feature, but also the effort for
maintaining a good system structure in case that the
new feature tends to the system’s structure.
REFERENCES
Boehm, B. W. et al. (2000). Software Cost Estimation with
Cocomo II with Cdrom. Prentice Hall.
Clements, P. et al. (2002). Evaluating Software Architec-
tures: Methods and Case Studies. Addison-Wesley.
Cuesta, C. E., Navarro, E., Perry, D. E., and Roda, C.
(2013). Evolution styles: using architectural knowl-
edge as an evolution driver. Journal of Software: Evo-
lution and Process, 25(9):957–980.
Faitelson, D. and Tyszberowicz, S. (2015). Improving de-
sign decomposition. In Li, X., Liu, Z., and Yi, W., ed-
itors, SETTA, volume 9409 of LNCS, pages 185–200.
Springer.
Garlan, D. et al. (2009). Evolution styles: Foundations and
tool support for software architecture evolution. In
Software Architecture, WICSA/ECSA, pages 131–140.
IEEE.
Heger, C. and Heinrich, R. (2014). Deriving work plans
for solving performance and scalability problems. In
Computer Performance Engineering, volume 8721 of
LNCS, pages 104–118. Springer.
Heinrich, R., Rostami, K., Stammel, J., Knapp, T., and
Reussner, R. (2015). Architecture-based analysis
of changes in information system evolution. 17th
Workshop Software-Reengineering & Evolution, SWT-
Trends, 34(3).
Jackson, D. (2012). Software Abstractions: Logic, Lan-
guage, and Analysis. The MIT Press.
Jacobson, I., Christerson, M., Jonsson, P., and
¨
Overgaard,
G. (1992). Object-oriented software engineering - a
use case driven approach. Addison-Wesley.
Kamada, T. and Kawai, S. (1989). An algorithm for draw-
ing general undirected graphs. Information processing
letters, 31(1):7–15.
Lehman, M. M. (1980). On understanding laws, evolution,
and conservation in the large-program life cycle. Jour-
nal of Systems and Software, 1:213–221.
North, S. C. (2004). Drawing graphs with NEATO. NEATO
User’s Manual.
Paulish, D. J. and Bass, L. (2001). Architecture-Centric
Software Project Management: A Practical Guide.
Addison-Wesley.
Reussner, Ralf H. et al., editor (2016). Modeling and
Simulating Software Architectures – The Palladio Ap-
proach. MIT Press.
Rostami, K., Stammel, J., Heinrich, R., and Reussner, R.
(2015). Architecture-based assessment and planning
of change requests. In QoSA, pages 21–30.
Streekmann, N. (2011). Clustering-Based Support for Soft-
ware Architecture Restructuring. Software Engineer-
ing Research. Vieweg+Teubner Verlag.
Vanya, A., Klusener, S., Premraj, R., and van Vliet,
H. (2013). Supporting software architects to im-
prove their software system’s decomposition - lessons
learned. Journal of Software: Evolution and Process,
25(3):219–232.
Williams, B. J. and Carver, J. C. (2010). Characterizing
software architecture changes: A systematic review.
Inf. Softw. Technol., 52(1):31–51.
MODELSWARD 2017 - 5th International Conference on Model-Driven Engineering and Software Development
442
