
Combining Behavioral Experiments and Agent-based Social Simulation
to Support Trust-aware Decision-making in Supply Chains
Diego de Siqueira Braga
1
, Marco Niemann
1
, Bernd Hellingrath
1
and Fernando Buarque de L. Neto
2
1
Westf
¨
alische Wilhelms-Universit
¨
at M
¨
unster, M
¨
unster, Germany
2
University of Pernambuco, Recife, Pernambuco, Brazil
Keywords:
Social Simulation, Trust, Bullwhip Effect, ABSS, Behavioral Experiment, Behavior Modeling.
Abstract:
Trust is seen as one of the most important dimensions in developing and maintaining fruitful business re-
lationships and has deep impact on the decision-making process in the supply chain planning. Despite its
importance, very limited research has been done in the trust-aware decision-making field. This paper aims
to experimentally examine how trust can be assessed over different dimensions and then be used to support
decision-making in order to reduce the Bullwhip Effect, which is one of the biggest efficiency problems shown
by supply chains of highly interconnected organizations. As industry is generally reluctant to provide data due
to privacy concerns and trade secret protection, the authors of this paper, designed and conducted a web-based
trust behavioral experiment. The data collected was used to evaluate the proposed trust mechanism through
an Agent-Based Social Simulation. The results revealed that it is possible to infer trust relationships from
behavioral experiments and historical based data, and use these relationships to influence the procurement, or-
dering and information sharing process. Although additional research is still necessary, the preliminary results
revealed that the use of computational trust mechanisms can be helpful to lower the Bullwhip Effect.
1 INTRODUCTION
The issues of trust have been an active research area in
different disciplines including economics (Greif et al.,
1994), sociology (Bachmann, 2001), business infor-
mation systems (Ba and Pavlou, 2002; Ba et al., 2003;
Resnick and Zeckhauser, 2002), information security
(Weeks, 2001), online auctions (Houser and Wood-
ers, 2006), social relationships (Castelfranchi and Fal-
cone, 1998), multi-agent systems (Braynov and Sand-
holm, 2002b; Braynov and Sandholm, 2002a; Yu and
Singh, 2002; Zacharia et al., 2000), and supply chains
(Laeequddin et al., 2010).
Researchers so far did not agree on a commonly
accepted definition of trust. Instead there is only
some elements - like the Trustor (trusting party) and
Trustee (trusted party) concept - that most authors can
agree on. Furthermore trust can be seen the trade-off
between potential risk and expected gain (Rousseau
et al., 1998). In this context, trust is the result of
prior (positive) experiences from mutual interactions
with other parties (Ring and Van de Ven, 1994; Kim,
2009). As an effect of this dependency trust is a dy-
namic property, readjusting itself based on new inter-
action outcomes (Abdul-Rahman and Hailes, 2000).
1.1 Trust in Supply Chains
A Supply Chain (SC) is a system of semi-autonomous
business entities (i.e. suppliers, manufacturer, retail-
ers, customers), linked by material, financial and in-
formation flows across several processes and activi-
ties (Christopher, 1999). Such modern SC are typi-
cally viewed as socio-technical systems (linking so-
ciety’s social and organizations’ technical aspects)
(De Bruijn and Herder, 2009).
Organizations in a SC face a vast number of prob-
lems, such as decision making (i.e. inventory man-
agement), where interdependent decisions are com-
monly managed separately. Additionally organiza-
tions are not isolated, but influence each other (Chaib-
draa and M
¨
uller, 2006). One of the biggest SC
efficiency problems, the so called Bullwhip Effect
(BWE), describes the phenomenon of increasing up-
stream order variances (Forrester, 1958). Predic-
tion and planning are aggravated by high levels of
order variances, decreasing customer service levels
and lowering SC’s competitiveness. Common cop-
ing strategies include increased stock levels and infor-
mation sharing. While the first increases costs even
further, the second one is considered a non-simple
260
de Siqueira Braga D., Niemann M., Hellingrath B. and de L. Neto F.
Combining Behavioral Experiments and Agent-based Social Simulation to Support Trust-aware Decision-making in Supply Chains.
DOI: 10.5220/0006200802600267
In Proceedings of the 9th International Conference on Agents and Artificial Intelligence (ICAART 2017), pages 260-267
ISBN: 978-989-758-219-6
Copyright
c
2017 by SCITEPRESS – Science and Technology Publications, Lda. All rights reserved

task. Information sharing can be influenced by for-
mal (e.g. contracts) or informal (e.g. trust) interac-
tions. So SC performance analysis and improvement
requires consideration of both aspects and their inter-
dependencies (Ottens et al., 2006). Since the SC do-
main is very dynamic, trust is considered an essential
tool to develop and manage business relationships, by
lowering transaction costs and shifting to continuous
exchange relationships (Kwon and Suh, 2005; Rai-
mondo, 2000; Tykhonov et al., 2008). These effects,
predicted by theory, have been validated by empirical
analysis (
¨
Ozer et al., 2011) and real-world environ-
ment studies (Ha et al., 2011).
1.2 Computational Trust
Trust was first introduced as a measurable property
of an entity in computer science by (Marsh, 1994).
Since then computational trust has grown into a broad
research area, comprising lots of different trust and
reputation models (Sabater and Sierra, 2005; Yu et al.,
2013).
Despite its importance, the conducted SC trust re-
search mostly focuses on its use for partner selection,
while explicit inclusion into the decision making pro-
cess would be desirable to facilitate information and
asset sharing (Burnett et al., 2014).
Performance evaluation is typically either con-
ducted via real world datasets (scarce due to privacy
issues) or the more widely used simulation-based
evaluation (Yu et al., 2013).
2 TRUST BEHAVIORAL
EXPERIMENT
Triggered by the lack of trust related data and moti-
vated by the growing interest in behavioral research
in supply chain management (Donohue and Siemsen,
2011) a trust experiment is proposed. It is expected
that the experiment will gather information regarding
individuals’ behavior during procurement, and order-
ing decisions considering trust relations in the context
of supply chains.
The experiment aims at (i) exposing different rel-
evance profiles; (ii) evaluating order assessment con-
cerning trust dimensions; and (iii) validation of ad-
ditional features of the trust mechanism (see Section
3).
The participant acts as a retailer aiming to fulfill
the demand of a customer by ordering from a vari-
ous number of suppliers. Each supplier has a differ-
ent profile (explained in Section 2). In addition, the
participant has to consider inventory and back order
costs as well as decreasing payments by the customer
for each round not delivering.
Gamification concepts such as a high score list and
progress bars were used in order to increase the par-
ticipants motivation.
The experiment consists of three parts. The first
part aims at exposing the relevance profiles regarding
the procurement and trust agents. The goal of the sec-
ond part is to expose the trust assessment. The last
part consists of a questionnaire to evaluate the deci-
sions made by the participants.
Firstly, the suppliers have different profiles based
on a price per product, an expected delivery time and
a trust value to evaluate the procurement decisions.
After nearly 20 rounds the experiment form is modi-
fied in order to capture information regarding the pref-
erences of the participants regarding the four dimen-
sions: {Reliability, Quality, Competence, Shared Val-
ues}.
The goal of the second part is to expose the trust
assessment. Therefore, the participant has to assess
each dimension regarding the received order. Each
order has a specific delay or failure rate regarding the
delivered products. Concerning these factors, the par-
ticipant has to adjust the existing rating of each di-
mension by a number between 0 and 100. Thereby, it
is possible to analyze individuals’ behavior regarding
the assessment of each dimension – for example, how
the participant deals with an order delay of one week.
The third part is a questionnaire aiming to assess
the participants decisions. Firstly, the relevance pro-
files are recalled so that each participant has to eval-
uate his/her behavior regarding price, delivery time
and trust or the four trust dimensions. Afterwards, the
participant demonstrates his/her preferences regard-
ing indirect and direct trust by rating the utilization of
trust-relating information given by others. Finally, the
experiment evaluates which level of trustworthiness
is necessary for each participant to share information
with suppliers.
Results and Analysis
After comparing the relevance profiles given by the
participants with their real ordering decisions three
main segments regarding the procurement process
were identified. The biggest one (group A) having
a share of round 26% of the whole participants is
mainly focusing on a relatively low price and a short
delivery time. A trust value is not that important for
this group. To the second group (group B) the price is
the most important value for decision-making where
to order without focusing very much on a delivery
time or the trust value. About 23% of all participants
Combining Behavioral Experiments and Agent-based Social Simulation to Support Trust-aware Decision-making in Supply Chains
261

Table 1: Procurement profiles.
Group Price Delivery Time Trust
A 44% 41,5% 14,5%
B 63% 22,5% 14,5%
C 34% 34% 32%
Table 2: Relevance of Trust and Indirect Trust.
Group Direct Indirect
A 65% 35%
B 73,75% 26,25%
C 58% 42%
used this kind of relevance profile for choosing their
suppliers. The last big group (group C) is a balanced
one. It has a share of 17% and focuses on price, de-
livery time and trust almost equally. The profiles with
their rounded relevance values can be seen in Table 1.
In Table 1 the different profiles of group A, B and
C can be seen regarding the procurement decision-
making. Each value represents the importance of
each dimension in the calculation during the decision-
making process.
After exposing the trust relevance profiles, these
three groups were analyzed regarding their decisions
made in the second part of the experiment. In Table 3
it is possible to see that Reliability and Quality were
the most important dimensions. Having equal num-
ber in groups A and C, and small differences when
considering the ratings for the other two dimensions.
In group B the observed value for the Reliability di-
mension was higher in comparison with groups A and
C (i.e. 45,5%), which is interesting as it contradicts
some results of Table 1. There Group B valuate price
almost three times more important as delivery time.
But when assessing the trust profile where price is
out of scope, Reliability measured by the on-time KPI
(see Section 3) is the most important trust property to
this group.
Furthermore, the analysis exposed how these
groups consider indirect trust values given by other
actors to decide which supplier to choose comparing
to their own direct value. The different importance
profiles regarding this weighting of direct or indirect
trust can be seen in Table 2.
It was also assessed the necessary trustworthiness
a supplier must have so that participants share infor-
mation. Table 4 shows the identified trust threshold
values for information sharing to happen. The first
level of information sharing is supposed to tell a sup-
plier if one will order from him in the next round.
The second level is about sharing the order amount
one round earlier with the supplier.
Another important part of the experiment was to
Table 3: Trust profiles. Legend: Competence (C), Reliabil-
ity (R), Quality (Q), Shared Values (SV).
Group C R Q SV
A 22% 31% 31% 16%
B 10% 45,5% 30,5% 14%
C 25% 31% 31% 13%
Table 4: Trust threshold values for information sharing.
Group Share order intention Share demand
A 53% 67%
B 45% 71,25%
C 58,5% 62,5%
identify how participants assess different orders. The
experiment exposed that participants assess, in aver-
age, a delay of one week by decreasing the reliabil-
ity value by round 8,21 % and increase it by round
4,89 % for each order without a delay. The Qual-
ity dimension is assessed based on the percentage of
failure rate so that participants decrease it by round
0,72 % for each percentage of failure (e.g. decrease
of quality dimension by 7,2% when having a failure
rate of 10% related to a specific order). For each re-
ceived order without any defective products the Qual-
ity value is increased by round 4,76 %. For every re-
ceived order which is perceived as bad by the partici-
pants the Competence value is decreased by 3,7%, and
increased by 0,5% for every order perceived as good
(these values can be seen in Table 5). Considering the
results present in Table 5 one can see that received
orders which are perceived as negative are assessed
more strictly regarding each dimension. Because of
this higher impact in the dimension, a bad order can
not be equalized by a proportionally good order. This
observation reinforces the findings regarding the dif-
ficulties of mitigating damaged trust relationships al-
ready present in literature (Kim et al., 2006).
3 SOCIAL SUPPLY CHAIN
SIMULATION
The simulation allowed an examination of trust as-
sessments through different dimensions and the use
of trust in lowering the BWE.
The supply chain conceptualized for the simula-
tion experiment has been constructed with six differ-
ent, commonly used actors: suppliers, manufactur-
ers, distributors, wholesalers, retailers and customers
(Mentzer et al., 2001; La Londe and Masters, 1994).
In this model the supplier is considered to be a source
of raw materials for the manufacturer. For the sake
of simplicity it is assumed that the supplier is always
ICAART 2017 - 9th International Conference on Agents and Artificial Intelligence
262
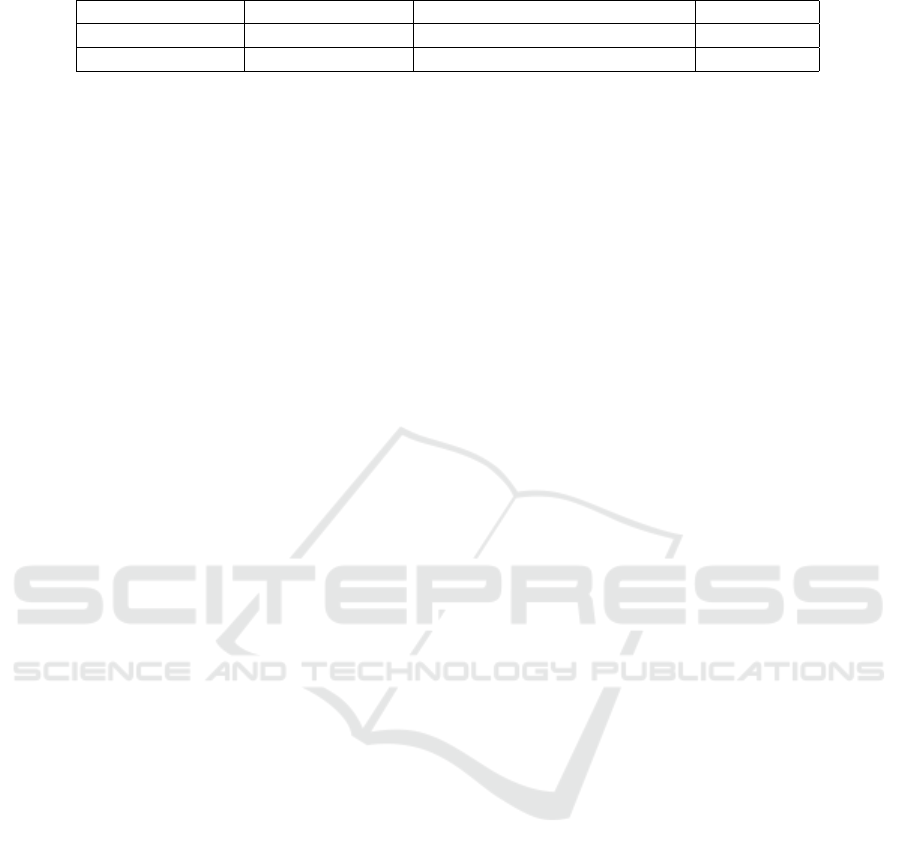
Table 5: Participants Trust Assessment.
Assessment Reliability Quality Competence
Perceived as bad -8,21 % per week -0,72% per percentage of failure -3,7%
Perceived as good +4,89 % per week +4,76% +0,5%
able to provide ordered goods. After refinement by
the manufacturer the products are delivered to the
wholesalers via the distributors. The wholesalers act
as the supplying entities for the retailers who sell the
product to the customer. Beside this unidirectional
flow of material the proposed supply chain model al-
lows a bidirectional flow of information.
In addition to the six common actors, this paper
introduces another entity: The lying actor. It concep-
tually differs from the previous constructs, as it does
not aim at modeling a new type of SC member, but
rather represents one of the other types with the addi-
tion of lying in form of opportunistic behavior. Typi-
cal behavior exhibited by such an actor would be or-
dering new goods at two suppliers to counter potential
shipment delays. On receipt of the earliest delivery it
would automatically cancel all other orders. Doing so
these agents will increase the BWE and thus can serve
as disturbing factors in a SC that are to be ruled out
via trust-based decision-making.
Agents
A set of nine different agents was conceptualized to
model the behavior of the different SC participants.
A majority of them aims at the fulfillment of typical
SC tasks. For example the inventory agent is respon-
sible for managing both the incoming as well as out-
going product stocks of an actor. It makes use of the
perpetual as well as the order-up-to level policy (De-
jonckheere et al., 2003; Clark and Scarf, 1960).
Additionally a forecast agent is implemented
based on the OpenForecast library (Gould, 2011), al-
lowing an actor to predict the demand of the next pe-
riod.
A procurement agent is added as a supplier selec-
tion entity. It aggregates trust information from both
trust agent as well as indirect trust agent (these con-
cepts are going to be introduced later in this Section)
and combines it with price and delivery time informa-
tion obtained from the delivery agent. Based on three
weighting parameters (one per criterion) the agent se-
lects the best supplier for the follow up transaction.
If the parent actor is a lying actor the delivery agent
additionally selects the second best supplier as well.
The actual ordering of goods is handled by the or-
der agent. It combines the forecast, a potential back-
log as well as inventory orders into one final order
amount. For the order fulfillment the order agent uses
the best supplier suggested by the procurement agent.
If the parent actor is a lying actor, the same order will
be placed with the second best supplier. Whenever the
agent receives goods they are checked for complete-
ness and integrity to sort out defect ones.
In order to handle the downstream flow of ma-
terial of an actor, the delivery agent has been intro-
duced. It receives the orders of the downstream part-
ner and is responsible for their shipment. Whenever
a full delivery is not possible, the available parts are
shipped while the remaining items are added to the
agents backlog. A secondary function of the agent is
the delivery of historical transaction data for the fore-
cast agent.
Logically in-between the order agent and the de-
livery agent the production agent is settled. They are
transforming incoming goods into a new product. The
exact design of this transformation is specified by so-
called production policies. For each supply chain ac-
tor such a policy specifies the used input, production
time and a specific failure rate.
While the prior six agents carry out core SC tasks,
the following two deal with trust related computa-
tions needed for trust-aware decision-making. The
first, the trust agent, aims at the evaluation of the di-
rect trust score. Direct in this domain implies that
only the agent’s own set of information is used. De-
spite, as (Pinyol and Sabater-Mir, 2013; Sabater and
Sierra, 2005) observe, most models still only con-
sider a single trust dimension, it was deemed benefi-
cial to use a multi-dimensional model instead. This
supports the paper’s goal to enable a better under-
standing of trust to use it for trust-aware decision-
making. A direct implication is that analyzing trust in
a less aggregated fashion is desirable. Consequently,
trust assessment is conducted considering the quadru-
ple {Reliability, Quality, Competence, Shared Val-
ues} (Haghpanah and DesJardins, 2010; Lin et al.,
2005; Handfield, 2003; Morgan and Hunt, 1994).
Reliability is assessed based on the On-Time KPI
(ServiceNow, 2016), which represents the share of
ordered goods arriving on time. Similarly, Quality
is measured based on the Undamaged Goods KPI
(ServiceNow, 2016), marking the percentage of un-
damaged goods after inspection. In order to evalu-
ate the Competence of a supplier, the trust agent as-
sesses the order history. Beside the prior three fac-
tors only being based on the perceptions of a single
agent, Shared Value is added to integrate agent simi-
Combining Behavioral Experiments and Agent-based Social Simulation to Support Trust-aware Decision-making in Supply Chains
263

larity into the model. This measure allows to evaluate
the degree of equality between two agents ( j ∈ {1, 2})
in their weightings w
i j
of the quadruple {Reliability,
Quality, Competence, Shared Values} (Morgan and
Hunt, 1994). It is assessed via the euclidean distance
between the quadruples of both agents.
The computed value henceforth will be consid-
ered as the OrderFul f illment (OF). In combination
with the trust dimension weightings of the parent user
this value allows to update the trust score assigned to
a specific supplier. As a first step the weighted av-
erage (again weighted with w) of the difference be-
tween OrderFul f illment and weightings w will be
computed to obtain a trust update value.
To compute the new trust value the weighted av-
erage from above is weighted by and added to the old
trust value.
The influence of the impact of the update value
can be regulated by a learning rate α. Assigning a low
α value will smooth the shift, high values will speed
it up.
Additionally an indirect trust agent is proposed to
account for trust computation from witness informa-
tion as a second traditional source of trust information
(Sabater and Sierra, 2005). It collects all direct trust
values other agents assign to suppliers. From there the
agent is able to compute a mean trust value for a spe-
cific supplier. The degree to which this value will be
considered depends on the preferences of the parent
actor.
Depending on the degree of trust assigned to a
supplier by the evaluating trust agents the actor might
share additional information or even assign an open
order earlier (referred to as information sharing from
now).
4 VERIFICATION &
VALIDATION
In order to verify the correctness of the implemented
agents and actors the commonly used JUnit unit test-
ing framework was used. It appeared to be the
most reasonable choice as it was already integrated in
the Repast framework (Argonne National Laboratory,
2015).
A special focus of the tests have been the classes
used for trust assessment. This way it should be en-
sured that each dimension was computed correctly to
guarantee correct supplier selection.
Apart from these static tests the simulation re-
sults have been verified based on already existing
prior studies by (Dejonckheere et al., 2004), (Chat-
field et al., 2004) and (Chatfield and Pritchard, 2013).
The used measure of comparison is the BWE modeled
by the total variance amplification (TV
Amp
), which
compares an upstream node’s (k > 0) order variance
with the demand variance of a customer node (k = 0)
(Chatfield and Pritchard, 2013).
To achieve comparable values the proposed model
has been slightly adjusted: First, the SC was restricted
to have one actor per tier, neglecting lying actors. Pro-
duction has been simplified to consider only one input
and one output. Apart from production time, no ad-
ditional temporal effort is considered. The customer
demand is normally distributed with N (10, 1).
Both models - with and without information shar-
ing - can be assumed to be verified, since the results
match those of prior studies as expected. Looking
at the results in Tables 6 and 7 values are roughly
the same. Especially with regard to the outcomes of
(Dejonckheere et al., 2004) the differences are con-
siderably small. The larger gaps with regard to the
results of (Chatfield et al., 2004) and (Chatfield and
Pritchard, 2013) may be partly based on their use of a
custom simulation system called SISCO.
Given this verification, as a next step the effect of
the single components (e.g. trust agent or informa-
tion sharing) have to be evaluated, to understand their
influence on the BWE. The used metric was again
TV
Amp
.
The data acquired through the Trust Behavioral
Experiment was used to initialize the different agents
in the simulation model. This includes the discovered
profiles as well as the identified information sharing
threshold values.
Looking at the results presented in Table 8 and
Figure 1 several interesting observations can be made.
Number one is the fact that for all actors except the
Retailer the TVAmp value is smallest when all trust
and information sharing components are active, but
no Lying Actors are present. Retailers require the
presence of Lying Actors to that point. On the con-
trary the worst values come up whenever all trust
mechanisms are deactivated. Distributors and Man-
ufacturers reach the bottom under the presence of
Lying Actors, while Retailers and Wholesalers hit it
without their appearance.
Evaluating both the Table 8 and the Figure 1 fur-
ther, it becomes apparent that the TVAmp value is ris-
ing for each trust mechanism getting deactivated. So
(as described above) the Bullwhip effect is the weak-
est during the presence of trust, indirect trust and in-
formation sharing. Deactivating information sharing
results in the biggest leap of the TVAmp values. For
the experiment without Lying Actors it on average
across all actors increases by 162%, which to a large
degree is based on the 202% increase of the TVAmp
ICAART 2017 - 9th International Conference on Agents and Artificial Intelligence
264
0,00
0,50
1,00
1,50
2,00
2,50
3,00
3,50
4,00
4,50
Retailer
Info.-
Sharing
Indirect
Trust
Direct
Trust
No
Trust
Lying ActorNormal Actor
(a) TVAmp Retailer.
0,00
5,00
10,00
15,00
20,00
25,00
30,00
35,00
Wholesaler
Info.-
Sharing
Indirect
Trust
Direct
Trust
No
Trust
Lying ActorNormal Actor
(b) TVAmp Wholesaler.
Info.-
Sharing
0,00
20,00
40,00
60,00
80,00
100,00
120,00
Distributor
Indirect
Trust
Direct
Trust
No
Trust
Lying ActorNormal Actor
(c) TVAmp Distributor.
0,00
50,00
100,00
150,00
200,00
250,00
Manufacturer
Info.-
Sharing
Indirect
Trust
Direct
Trust
No
Trust
Lying ActorNormal Actor
(d) TVAmp Manufacturer.
Figure 1: Bullwhip-Effect visualized for the different Actors.
Table 6: Verification based on average bullwhip values with deactivated information sharing.
Retailer Wholesaler Distributor Manufacturer
(Dejonckheere et al., 2004) 1.67 2.99 5.72 11.43
(Chatfield et al., 2004) 2.22 5.21 11.51 23.77
(Chatfield and Pritchard, 2013) 2.23 5.21 11.39 23.31
Results 1.49 2.35 3.41 11.70
value for the Wholesaler. In the presence of Lying Ac-
tors the shift is less extreme, with an average increase
of 48% which is much more evenly distributed across
the separate actors. Disabling the direct trust and in-
direct trust further exhibits further negative influence
on the TVAmp score, however, the influence degree
is much smaller. So the overall increase of the Bull-
whip effect is at about 199% without Lying Agents
and about 65% for cases with such agents.
Comparing Figures 1(a) and 1(b) to the Figures
1(c) and 1(d) further reveals that the BWE impacts
Retailer and Wholesaler worse with no Lying Actor
included. Distributor and Manufacturer, however, are
mostly affected whenever such liars are present.
Analyzing the effects within one (actor to actor)
test case indicates that the strongest increase of the
BWE occurs between Retailer and Wholesaler. There
the TVAmp value rises by 590% on average. Between
Wholesaler and Distributor the average increase with
332% is still high. In the presence of Lying Agents
increase is about 497%, whereas cases without them
only increase by 168%. This difference in TVAmp
value impact caused by the Lying Agents can simi-
larly be observed looking at the supply chain from
beginning to end: SCs free of liars (test cases 1-4) ex-
hibit an average BWE increase of 403%, while SCs
affected by liars rise about 985% (∼ twice as strong).
5 CONCLUSIONS
Based on an experimental trust examination over dif-
ferent dimensions, this paper was successful in using
created insights to support decision making in order to
reduce the BWE. Due to the scarcity of trust related
supply chain data a gamified web-based trust behav-
ioral experiment was devised.
The conducted three stepped experiment lead to
the following observations: Step one was able to un-
cover three major procurement profiles regarding the
three dimensions price, delivery time and trustworthi-
ness. In step two the trust profiles for the previously
identified groups were established. Beside the insight
that for most people the dimensions of Competence,
Reliability and Quality were of equal importance, it
proved to be a useful cross-validation tool as well:
One group valuated Delivery Time lowest in it’s pro-
curement profile. Once price was out of consideration
(e.g. in the trust evaluation), the same group valu-
ated Reliability highest. This contradicts their low as-
sessment of Delivery Time since both are very similar
constructs (see Section 3). Furthermore a set of trust
information sharing thresholds has been discovered.
The acquired data was used to initialize the dif-
ferent agents in the developed simulation model. The
special focus has been to align the newly created sim-
ulation model with existing analytical SC models. For
a more realistic scenario the lying actors concept was
introduced, enabling existing actors to exhibit oppor-
tunistic behavior.
Furthermore it was possible to show the im-
portance of trust in the procurement and ordering
decision-making. The simulation experiment results
revealed that under the influence of trust, indirect trust
and information sharing the BWE is weakened. This
finding confirms the already existing theoretical ideas
from the supply chain literature where these concepts
have been identified as countermeasures for the BWE
(Moyaux et al., 2007). Additionally it was possible to
confirm existing believes about the difficulties of mit-
igating damaged trust relationships (Kim et al., 2006).
The Trust Behavioral Experiment has some limita-
Combining Behavioral Experiments and Agent-based Social Simulation to Support Trust-aware Decision-making in Supply Chains
265
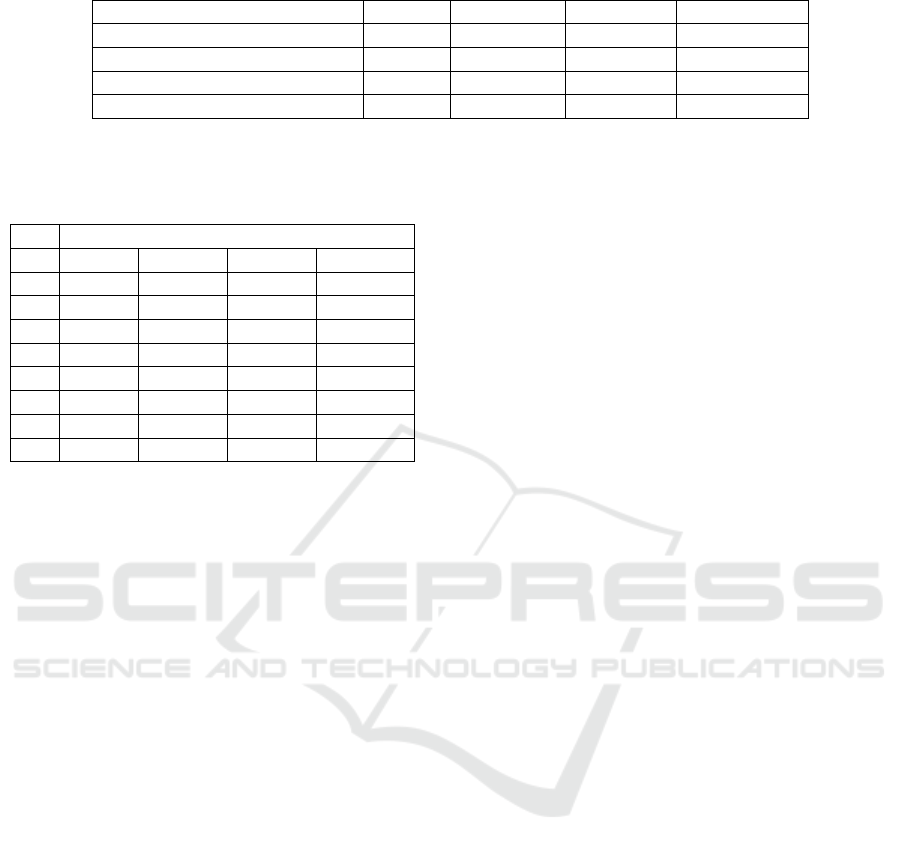
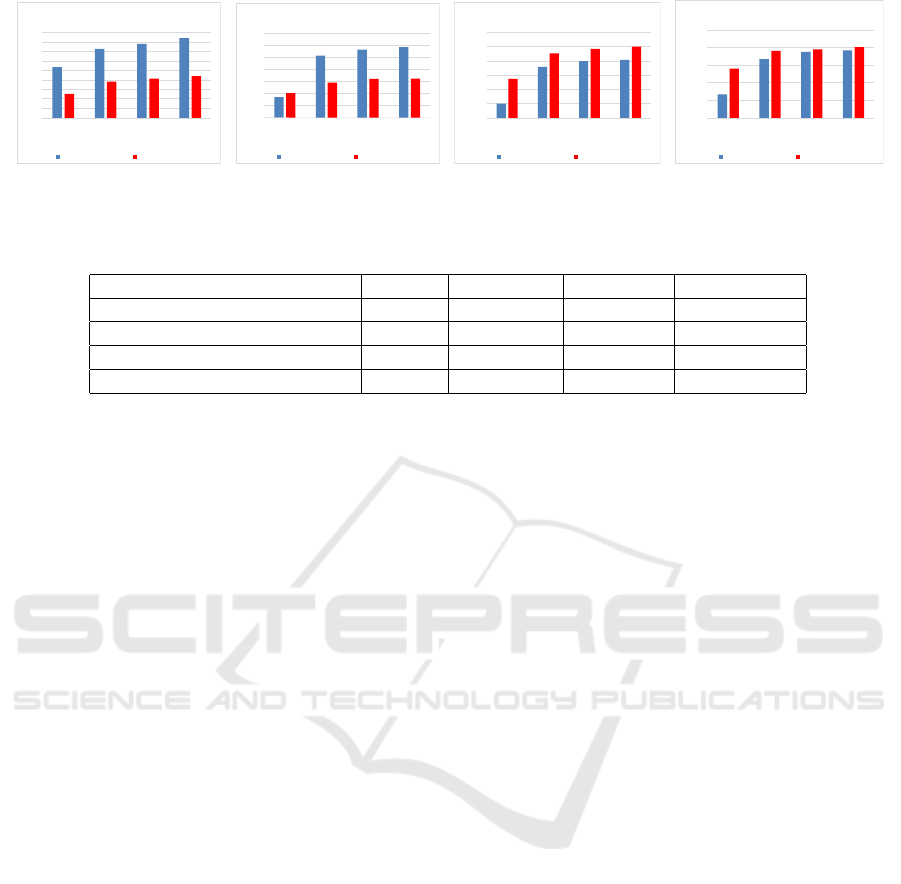
Table 7: Verification based on average Bullwhip values with activated information sharing.
Retailer Wholesaler Distributor Manufacturer
(Dejonckheere et al., 2004) 1.67 2.61 3.83 5.32
(Chatfield et al., 2004) 2.22 3.89 5.76 7.62
(Chatfield and Pritchard, 2013) 2.23 3.91 5.78 7.65
Results 1.38 2.11 2.92 10.89
Table 8: Bullwhip-Effect Values of the Validation Test
Cases. Legend: Test Case (TC), Retailer (R), Wholesaler
(W), Distributor (D) and Manufacturer (M).
Bullwhip-Effect Values
TC R W D M
1 2.6654 8.4928 19.8690 67.1102
2 3.6357 25.6233 71.5803 167.4304
3 3.9001 28.1745 79.3702 187.4566
4 4.1932 29.1924 81.1145 191.8513
5 1.2600 10.1519 54.5839 140.3891
6 1.9001 14.5047 90.5963 190.2219
7 2.0574 16.0391 96.8988 194.5419
8 2.1879 16.1255 99.9479 201.4702
tions. First results show that some participants seem
to assess received orders more randomly or rate di-
mensions without considering delay or quality. Am-
biguous explanations of that assessment or missing
background knowledge could be reasons for that. Po-
tential fixes would be raising demographic data, giv-
ing personal, introductory briefings or experimenting
with practitioners. Furthermore the sample size is rel-
atively small, yet sufficient to gain initial results. Al-
though not incorporated in this paper, current research
is taking place in order to increase participation by
improving the gaming experience. Additional dimen-
sions is also being considered.
Despite the fact that additional research is still
necessary, the preliminary results presented here re-
vealed that the use of computational trust mechanisms
can be helpful to reduce the Bullwhip Effect.
REFERENCES
Abdul-Rahman, A. and Hailes, S. (2000). Supporting trust
in virtual communities. In System Sciences, 2000.
Proceedings of the 33rd Annual Hawaii International
Conference on, pages 9–pp. IEEE.
Argonne National Laboratory (2015). Repast.
Ba, S. and Pavlou, P. A. (2002). Evidence of the Effect
of Trust Building Technology in Electronic Markets:
Price Premiums and Buyer Behavior. MIS Quarterly,
26(3):243–268.
Ba, S., Whinston, A. B., and Zhang, H. (2003). Build-
ing Trust in Online Auction Markets Through an Eco-
nomic Incentive Mechanism. Decision Support Sys-
tems, 35(3):273–286.
Bachmann, R. (2001). Trust, Power and Control in
Trans-Organizational Relations. Organization Stud-
ies, 22(2):337–365.
Braynov, S. and Sandholm, T. (2002a). Contracting With
Uncertain Level Of Trust. Computational Intelli-
gence, 18(4):501–514.
Braynov, S. and Sandholm, T. (2002b). Incentive Compat-
ible Mechanism for Trust Revelation. In Proceed-
ings of the First International Joint Conference on
Autonomous Agents and Multiagent Systems: Part 1,
pages 310–311, Bologna, Italy. ACM Press.
Burnett, C., Norman, T. J., Sycara, K., and Oren, N. (2014).
Supporting trust assessment and decision making in
coalitions. IEEE Intelligent Systems, 29(4):18–24.
Castelfranchi, C. and Falcone, R. (1998). Principles of Trust
for MAS: Cognitive Anatomy, Social Importance, and
Quantification. In Proceedings International Con-
ference on Multi Agent Systems (Cat. No.98EX160),
pages 72–79. IEEE Comput. Soc.
Chaib-draa, B. and M
¨
uller, J. (2006). Multiagent based sup-
ply chain management, volume 28. Springer Science
& Business Media.
Chatfield, D. C., Kim, J. G., Harrison, T. P., and Hayya,
J. C. (2004). The Bullwhip Effect-Impact of Stochas-
tic Lead Time, Information Quality, and Information
Sharing: A Simulation Study. Production and Opera-
tions Management, 13(4):340–353.
Chatfield, D. C. and Pritchard, A. M. (2013). Returns and
the bullwhip effect. Transportation Research Part E:
Logistics and Transportation Review, 49(1):159–175.
Christopher, M. (1999). Logistics and supply chain man-
agement: Strategies for reducing cost and improving
service financial times: Pitman publishing. london,
1998 isbn 0 273 63049 0 (hardback) 294+ 1× pp.
Clark, A. J. and Scarf, H. (1960). Optimal Policies for a
Multi-Echelon Inventory Problem. Management Sci-
ence, 6(4):475–490.
De Bruijn, H. and Herder, P. M. (2009). System and actor
perspectives on sociotechnical systems. IEEE Trans-
actions on Systems, Man, and Cybernetics-Part A:
Systems and Humans, 39(5):981–992.
Dejonckheere, J., Disney, S., Lambrecht, M., and Towill, D.
(2003). Measuring and avoiding the bullwhip effect:
A control theoretic approach. European Journal of
Operational Research, 147(3):567–590.
Dejonckheere, J., Disney, S., Lambrecht, M., and Towill,
D. (2004). The impact of information enrichment on
the Bullwhip effect in supply chains: A control engi-
ICAART 2017 - 9th International Conference on Agents and Artificial Intelligence
266

neering perspective. European Journal of Operational
Research, 153(3):727–750.
Donohue, K. and Siemsen, E. (2011). Behavioral opera-
tions: applications in supply chain management. Wi-
ley Encyclopedia of Operations Research and Man-
agement Science.
Forrester, J. W. (1958). Industrial dynamics: a major break-
through for decision makers. Harvard business re-
view, 36(4):37–66.
Gould, S. (2011). OpenForecast.
Greif, A., Milgrom, P., and Weingast, B. R. (1994). Co-
ordination, Commitment, and Enforcement: The Case
of the Merchant Guild. Journal of Political Economy,
102(4):745–776.
Ha, B.-C., Park, Y.-K., and Cho, S. (2011). Suppliers’ affec-
tive trust and trust in competency in buyers: Its effect
on collaboration. International Journal of Operations
& Production Management, 31(1-2):56–77.
Haghpanah, Y. and DesJardins, M. (2010). Using a Trust
Model in Decision Making for Supply Chain Manage-
ment. In Proceedings of the 3rd AAAI Conference on
Interactive Decision Theory and Game Theory, pages
25–29. AAAI Press.
Handfield, R. (2003). Trust in Supply Chain Relationships:
What Does It Mean to Trust? - Part I.
Houser, D. and Wooders, J. (2006). Reputation in Auctions:
Theory, and Evidence from eBay. Journal of Eco-
nomics & Management Strategy Management Strat-
egy, 15(2):353–369.
Kim, P. H., Dirks, K. T., Cooper, C. D., and Ferrin, D. L.
(2006). When more blame is better than less: The
implications of internal vs. external attributions for the
repair of trust after a competence-vs. integrity-based
trust violation. Organizational Behavior and Human
Decision Processes, 99(1):49–65.
Kim, W.-S. (2009). Effects of a trust mechanism on com-
plex adaptive supply networks: An agent-based social
simulation study. Journal of Artificial Societies and
Social Simulation, 12(3):4.
Kwon, I.-W. G. and Suh, T. (2005). Trust, commitment
and relationships in supply chain management: a path
analysis. Supply chain management: an international
journal, 10(1):26–33.
La Londe, B. J. and Masters, J. M. (1994). Emerging Logis-
tics Strategies: Blueprints for the Next Century. Inter-
national Journal of Physical Distribution & Logistics
Management, 24(7):35–47.
Laeequddin, M., Sahay, B. S., Sahay, V., and Waheed, K. A.
(2010). Measuring trust in supply chain partners’ rela-
tionships. Measuring Business Excellence, 14(3):53–
69.
Lin, A. F.-r., Sung, Y.-w., and Lo, Y.-p. (2005). Effects of
Trust Mechanisms on Supply-Chain Performance: A
Multi-Agent Simulation Study. International Journal
of Electronic Commerce, 9(4):91–112.
Marsh, S. P. (1994). Formalising Trust as a Computational
Concept. Disseration, University of Stirling.
Mentzer, J. T., DeWitt, W., Keebler, J. S., Min, S., Nix,
N. W., Smith, C. D., and Zacharia, Z. G. (2001).
Defining Supply Chain Management. Journal of Busi-
ness Logistics, 22(2):1–25.
Morgan, R. M. and Hunt, S. D. (1994). The Commitment-
Trust Theory of Relationship Marketing. Journal of
Marketing, 58(3):20–38.
Moyaux, T., Chaib-draa, B., and D’Amours, S. (2007). In-
formation sharing as a coordination mechanism for re-
ducing the bullwhip effect in a supply chain. IEEE
Transactions on Systems, Man, and Cybernetics, Part
C (Applications and Reviews), 37(3):396–409.
Ottens, M., Franssen, M., Kroes, P., and Van De Poel, I.
(2006). Modelling infrastructures as socio-technical
systems. International Journal of Critical Infrastruc-
tures, 2(2-3):133–145.
¨
Ozer,
¨
O., Zheng, Y., and Chen, K.-Y. (2011). Trust in
Forecast Information Sharing. Management Science,
57(6):1111–1137.
Pinyol, I. and Sabater-Mir, J. (2013). Computational trust
and reputation models for open multi-agent systems:
a review. Artificial Intelligence Review, 40(1):1–25.
Raimondo, M. A. (2000). The measurement of trust in mar-
keting studies: a review of models and methodologies.
In 16th IMP-conference, Bath, UK. Citeseer.
Resnick, P. and Zeckhauser, R. (2002). Trust Among
Strangers in Internet Transactions: Empirical Analy-
sis of eBay’s Reputation System. In Baye, M. R., edi-
tor, Advances in Applied Microeconomics, number 11,
pages 127–157. Emerald Group Publishing Limited.
Ring, P. S. and Van de Ven, A. H. (1994). Developmental
processes of cooperative interorganizational relation-
ships. Academy of management review, 19(1):90–118.
Rousseau, D. M., Sitkin, S. B., Burt, R. S., and Camerer,
C. (1998). Not so different after all: A cross-
discipline view of trust. Academy of management re-
view, 23(3):393–404.
Sabater, J. and Sierra, C. (2005). Review on Computational
Trust and Reputation Models. Artificial Intelligence
Review, 24(1):33–60.
ServiceNow (2016). % of undamaged goods after ship-
ping/transportation.
Tykhonov, D., Jonker, C., Meijer, S., and Verwaart, T.
(2008). Agent-based simulation of the trust and trac-
ing game for supply chains and networks. Journal of
Artificial Societies and Social Simulation, 11(3):1.
Yu, B. and Singh, M. P. (2002). An Evidential Model
of Distributed Reputation Management. In Proceed-
ings of the First International Joint Conference on
Autonomous Agents and Multiagent Systems: Part 1
- AAMAS ’02, pages 294–301, Bologna, Italy. ACM
Press.
Yu, H., Shen, Z., Leung, C., Miao, C., and Lesser, V. R.
(2013). A survey of multi-agent trust management
systems. IEEE Access, 1:35–50.
Zacharia, G., Moukas, A., and Maes, P. (2000). Collab-
orative reputation mechanisms for electronic market-
places. Decision Support Systems, 29(4):371–388.
Combining Behavioral Experiments and Agent-based Social Simulation to Support Trust-aware Decision-making in Supply Chains
267
