
Measuring the Efficiency of the Food Industry in Central and East
European Countries by using the Data Envelopment Analysis
Approach
Zrinka Lukač and Margareta Gardijan
Faculty of Economics and Business, University of Zagreb, Trg J.F. Kennedyja 6, Zagreb, Croatia
Keywords: Efficiency, Competitiveness, Food Industry, Data Envelopment Analysis.
Abstract: The food industry plays an important role in economy of many countries. It is the leading manufacturing
industry in EU in terms of turnover, value added and employment. However, it has been facing a decrease in
competitiveness lately. In this paper we study the competitiveness of very large companies from the food
industry sector in central and east European countries (CEE) by measuring their efficiency within the Data
Envelopment Analysis (DEA) approach. The efficiency analysis is conducted by using the BCC model
where certain financial ratios are used as its inputs and outputs. The study includes more than 200 very large
companies from 13 CEE countries over time period from 2005-2013. The research results have shown that
although some countries were more efficient than the others during the entire research period, no patterns in
the efficiency of the food industry subsectors could be recognised. On the other hand, DEA approach
enabled recognizing sources of inefficiency on a national level.
1 INTRODUCTION
The food industry is a very important component of
the economy of many countries and has a unique
role in expanding their economic opportunities. Its
impact is not limited only to the economic growth
but also affects various aspects of the society.
Together with agriculture it is the main source of
national income for most developing countries. Even
in developed countries its role is of utmost
importance. For example, the food and drink
industry is the first manufacturing industry in the
EU, leading in terms of turnover (€1090 billion or
15.6%), value added (€212 billion or 13%) and
employment (4.25 billion people in direct
employment or 15.2%) (FoodDrink Europe, 2016).
Statistical classification of economic activities in the
European Community, abbreviated as NACE,
classifies food industry as sector C10. Its 9
subsectors are shown in Table 1.
In 2013, the food industry sector in Europe
included 264.1 thousand enterprises that employed
13.6% of the total manufacturing workforce in and
had a wage-adjusted labour productivity ratio of
157.1% (manufacturing ratio average is 148,0%).
Almost 60% of these companies were engaged in
activities classified under C.10.7, followed by
approximately 15% in C.10.1 and 23.3% in C.10.8
(Eurostat 2013).
Table 1: Classification of food industry sector C10.
C10.1 Production, processing, preserving of meat, meat
products
C10.2 Processing and conservation of fish, crustaceans
and molluscs
C10.3 Processing and conservation of fruit and
vegetables
C10.4 Manufacture of vegetable and animal fats and
oils
C10.5 Manufacture of dairy products
C10.6 Manufacture of milling products, starches and
starch products
C10.7 Manufacture of bakery products and pastas
C10.8 Manufacture of other foodstuffs
C10.9 Manufacture of products for animal feed
The leading European countries in the food
industry are Germany, France, UK and Italy, but
certain central and east European (CEE) countries,
such as Bulgaria, Romania and Poland, have one of
the greatest wage-adjusted labour productivity
ratios. However, the EU food and drink industry is
facing a decrease in competitiveness lately. Despite
LukaÄ Z. and Gardijan M.
Measuring the Efficiency of the Food Industry in Central and East European Countries by using the Data Envelopment Analysis Approach.
DOI: 10.5220/0006196303850392
In Proceedings of the 6th International Conference on Operations Research and Enterprise Systems (ICORES 2017), pages 385-392
ISBN: 978-989-758-218-9
Copyright
c
2017 by SCITEPRESS – Science and Technology Publications, Lda. All rights reserved
385

that fact, no analysis of the food sector in CEE has
been made recently.
In this paper, we study the competitiveness of
large companies from food industry sector in 13
CEE countries (Bosnia and Herzegovina, Bulgaria,
Croatia, Czech Republic, Hungary, Latvia,
Lithuania, Montenegro, Poland, Romania, Serbia,
Slovakia and Slovenia). The study includes all very
large companies from food sector for which data
was provided by AMADEUS database, that is over
200 very large companies during the time period
from 2005-2013. We investigated their relative
efficiency using the BCC model from the Data
Envelopment Analysis (DEA). DEA is a
nonparametric method for measuring the relative
performance of decision making units (DMU’s) and
identifying efficient production frontiers in presence
of multiple inputs and outputs. The method was
developed by Charnes, Cooper and Rhodes
(Charnes, Cooper and Rhodes, 1978). In our
analysis, DMUs are particular companies, while
inputs and outputs of the BCC model are their
financial ratios. Based on the efficiency scores of
companies, we draw conclusions about the
efficiency of the food industry subsectors as well as
the efficiency of food industries of particular
countries. Also, we were able to identify sources of
inefficiency of certain countries, which might assist
policy makers in developing strategies which might
improve competitiveness of their food industry
sectors and thus affect their economic growth.
2 LITERATURE REVIEW
Given the role the food industry plays in the
economy of many countries as well as in global
economy there are many publications issued by
official governmental and non-governmental
organizations, such as Food and Agriculture
Organization of the United Nations (FAO) or
European Commission (EC), that deal with the
agribusiness, its role in economic development and
its competitiveness. Each year FAO publishes The
State of Food and Agriculture report. In its 1997
issue special chapter was devoted to the subject of
agro-processing industry and economic development
(FAO, 1997). In 2009, FAO has published another
document on key factors affecting the development
and competitiveness of agro-industries (FAO, 2009).
Given the decrease in the relative
competitiveness of EU food and drink industry
compared to other world food producers in terms of
slower growth in labour productivity and added
value, EC is actively taking efforts to come up with
the policy measures which would support the
competitiveness of that sector. It also publishes
studies which assess EU food and drink industry
competitive positions. Some of such recent studies
on the competitive position of the European food
and drink industry commissioned by EC are
(Wijnands and Verhoog, 2016) and (European
Commission, 2016).
Verschlede et al. (2014) conducted a general
study to obtain insight into firm-level
competitiveness across all sectors in Europe,
including the food industry, by using a
semiparametric stochastic metafrontier approach.
Many studies have used DEA approach to measure
efficiency and competitiveness of the food industry.
Charles and Zegarra (2014) have developed a
regional competitiveness index by using the
methodology based on DEA to measure and rank the
competitiveness of all the regions of Peru.
Rodmanee and Huang (2013) have used a relational
two-stage DEA to evaluate the efficiency of 23 food
and beverage companies in Thailand. Shamsudin et
al. (2011) used the DEA approach to evaluate the
market competitiveness of small and medium
enterprises in the food industry in Malaysia. Study
conducted by Tektas and Tosun (2010) benchmarks
the supply and chain performance of Turkish food
and beverage companies by using DEA. The DEA-
efficiency and productivity changes in the food
industry in India during pre and post liberalisation
period were studied by Ali et al. (2009). The former
also identifies the causes of inefficiency across
various sectors. Kocisova (2015) investigates the
relative efficiency of the agricultural sector in the
EU using DEA during the period 2007-2011, where
decision-making units (DMUs) are agricultural
subsectors. The paper by Kocisova (2015) also gives
a good literature review of different approaches to
measuring efficiency in the agricultural sector in
Europe. However, there are no recent studies of the
competitiveness of European food industry by using
the DEA approach.
3 METHODOLOGY
The mathematical formulation of the basic DEA
CCR model (Charnes, Cooper and Rhodes, 1978) is
as follows. We observe N decision making units,
denoted as DMU
1
, DMU
2,
…,DMU
N
, that use the
same n inputs in order to produce the same m
outputs. Let x
ij
be an input i for some DMU
j
,
ICORES 2017 - 6th International Conference on Operations Research and Enterprise Systems
386

1, ,in
and y
rj
its output r,
1, ,rm
,
1, , .
j
N
Therefore, a particular DMU
j
is
described by vectors
12
,,,
j
jnj
x
xxX
and
12
,,,
j
jmj
y
yyY
. In order to make the model
stable, it is recommended that
max ,3 .
N
mn m n For an arbitrary decision
making unit DMU
0
=DMU
j
,
1, , ,
j
N
a virtual
input
11
...
onno
ux ux
and a virtual output
11
...
ommo
vy v y
are formed with (initially) unknown
weights (v
r
) and (u
i
). The model can be input or
output oriented, depending on whether DMUs’ aim
is to minimize the inputs for a given level of outputs
or vice versa. In the output oriented approach, these
weights are determined by solving the following
fractional programming model for each
DMU
0
=DMU
j
:
11
11 2 2
,..., , ,...,
11 2 2
11 2 2
11 2 2
...
max ,
...
subject to
...
1, 1, , ,
...
,0,,,
ms
oo mmo
vvuu
oo nno
jj mmj
jj nnj
ir
vy vy v y
ux ux ux
uy uy u y
jN
vx vx v x
uv ir
(1)
where
0
is a non-Archimedean element. Using
Charnes-Cooper transformation (Charnes and
Cooper, 1962) this fractional programming model
can be linearized and also written in its envelopment
form (Cooper, Seiford and Zhu, 2011).
Since CCR model assumes constant returns to
scale, Banker, Charnes and Cooper (Banker,
Charnes and Cooper, 1984) developed a generalised
DEA model that assumes variable returns to scale
(VRS). Their significant contribution to the DEA
was the idea to let each DMU use the set of weights
that puts it in the best position regarding the other
DMUs (www.deazone.com [10.7.2013]). In output-
oriented BCC model, the measure of technical
efficiency ϕ is obtained by solving the following
linear program for each DMU
0
=DMU
j
:
,
0
1
0
1
1
max
1
,
,
1, 2 ,
,
0, ,,
N
jj
j
n
jj
j
N
j
j
j
es s
s
s
jN
λ
XX
YY
(2)
where s
-
, s
+
are vectors of slack variables and θ is the
solution of the dual problem. If we denote the
optimal solution as
( , , )
s
s
, then DMU
0
is
efficient iff ϕ=1 and
s
=
s
= 0. DMU
0
is weakly
efficient iff ϕ* = 1 and
s
≠ 0 or
s
≠ 0 in some
alternate optima (Cooper, Seiford and Zhu, 2011).
This study uses BCC model for several reasons.
First, it is a relatively simple tool that gives the
needed results. Secondly, it allows assuming
variable returns to scale, and thirdly, it can handle
negative data that is often found in financial analysis
(Pastor and Ruiz, 2007).
4 DATA AND RESULTS
The data sample for our study included all the very
large food manufacturers in CEE countries for which
data were available in AMADEUS database. We
considered the time period from 2005-2013. The
number of companies varies between 235 in 2005
and 284 in years 2007 and 2008 (table A1 in
appendix). There are several reasons why it is
interesting to analyse the segment of very large
companies. On average, very large companies from
this database hold on around 40.2% of total asset
and 37,52% of all the capital in food industry of the
countries observed during the period of analysis.
Also, very large companies have employed 22.28%
of the total workforce (on average) within the CEE
food industry sector. The data shows that during
2005-2013 the average profit margin (PM) of very
large producers in food industry sector was smaller
than the PM of large companies. Compared to
medium sized companies, the profit margin of very
large companies was smaller only in years before
2010. Furthermore, when compared to companies
classified as small, they reaped greater profit margin.
Data shows that the number of very large food
producers has been increasing over the years. The
choice of variables used for evaluating the
companies was determined by the availability of
data. Since the most commonly reported data in
AMADEUS dataset are operating revenue, total
asset, capital and profit margin, these variables were
used to investigate the relative efficiency of the very
large food producers in CEE countries. Given the
fact that DEA cannot deal with missing values
(Smirlis, Maragos and Despotis, 2006), companies
with missing data were excluded from the study.
This reduced the sample by not more than 5% of the
total number of companies in each year. The ratio of
profit/loss before tax to total asset (ROA) and profit
Measuring the Efficiency of the Food Industry in Central and East European Countries by using the Data Envelopment Analysis Approach
387
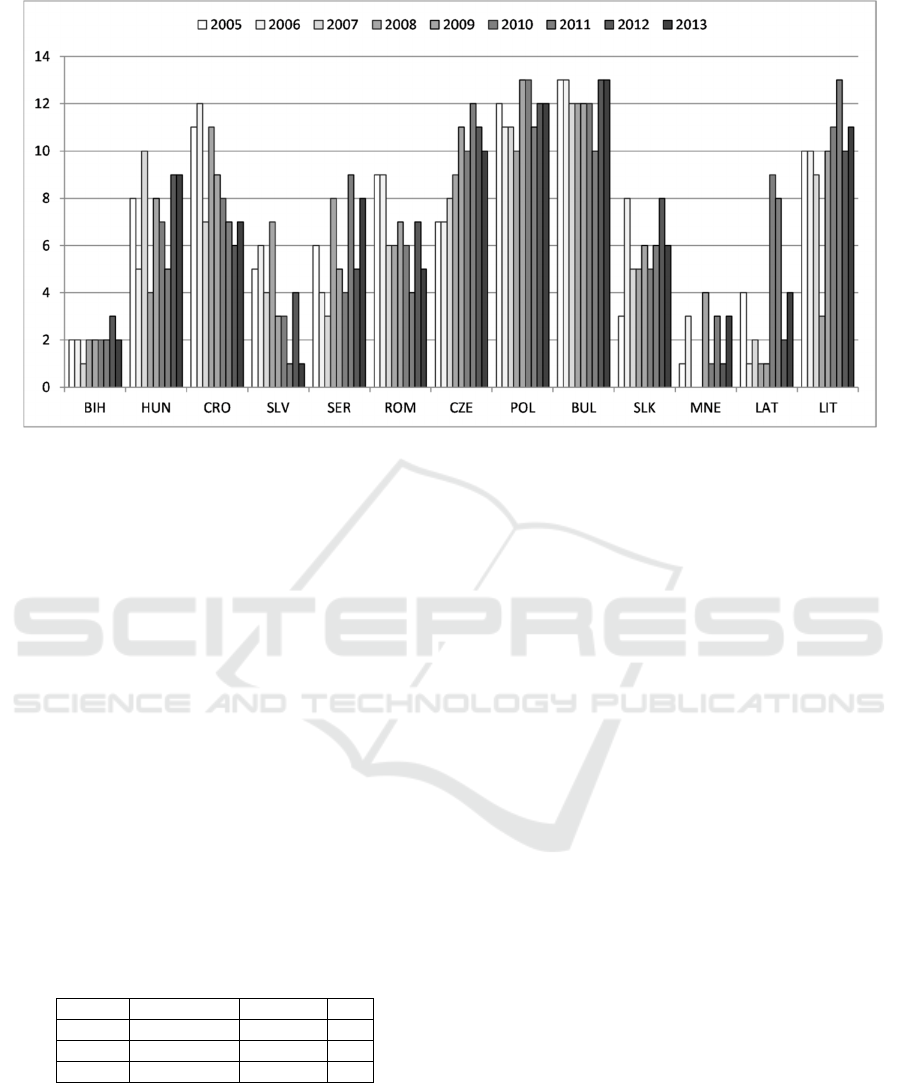
Figure 1: Relative position of countries by years during 2005-2013.
margin were used as indicators of profitability. Since
capital and operating revenue are given in absolute
terms, we introduce their ratio (capital/operating
revenue) as a measure of productivity of capital.
Classification of companies by their subsector is
presented in table A2 in the appendix.
DEA demands that there is at least one variable
considered as input and one variable considered as
output. Since greater values of ROA and profit
margin are preferred, these variables were taken as
outputs, while the productivity of capital was taken
in its inverse form (revenue/capital) and considered
as an input of the BCC model. The minimum and
maximum values of correlation coefficients among
variables for each year during the time period from
2005-2013 are given in Table 2. The correlation
coefficients between input and output variables are
meaningful and indicate that there are no redundant
variables.
Table 2: Minimum and maximum values from the
correlation matrix.
ca
p
/rev ROA RM
ca
p
/rev 1
ROA -0,22 / -0,08 1
RM -0,61 / -0,05 0,6 / 0,73 1
For each year, the rankings of companies were
obtained by solving the BCC model. The results
showing the most efficient and 5 least efficient
companies are reported in tables A3 (years 2005-
2009) and A4 (years 2010-2014) in the appendix.
Averaging the efficiency ratios of food
companies from a specific country allows ranking of
countries by their food industry efficiency. Figure 1
shows the relative positions of countries in time
period 2005-2013. It is obvious that Bulgaria,
Poland, Czech Republic and Hungary are the leading
countries in this sector. Bosnia and Herzegovina is
the least efficient country. On the other hand,
averaging the rankings within each food industry
subsector allows recognising the changes in the
relative efficiency over the years. The results
illustrated in Figure A1 in the appendix show that
subsector C10.7 is strongly at the bottom. Also,
C10.9 and C10.2 are in the middle of the range of
relative rankings with respect to other sectors for
each year of the considered period. However, there
are large oscillations of average efficiency ranking
within subsectors during 2005-2013.
DEA also allows recognizing the weaknesses of
a specific DMU. It is given by the percentage
difference of DMUs inputs and outputs compared to
its efficient projection on the efficient frontier. By
averaging these percentage differences within a
single country, we got indicators of competitive
advantages and inefficiency sources, as shown in
tables A5, A6 and A7 in the appendix. These results
show that, on average, efficient countries have small
deviations from their projections in both outputs and
input. On the other hand, the inefficient countries
have large deviations from projections, again in both
outputs and input. Overall, each country has
different sources of strengths and weaknesses, as
shown by table A5, A6 and A7 in the appendix.. The
ICORES 2017 - 6th International Conference on Operations Research and Enterprise Systems
388

results obtained on a company level, as well as on
the country level, can be used as guidelines for
assisting policy makers in creating policies which
might lead to improving efficiency and
competitiveness, thus also having positive effects on
economic growth.
5 CONCLUSIONS
The food industry plays an important role in the
economy of many countries. Developing its
competitiveness has positive effects on long-term
economic growth. Therefore it is important to assist
the policy makers in identifying sources of
inefficiency and developing strategies which would
improve its competitiveness. In this study we have
conducted efficiency analysis of very large
companies in the food sector of CEE countries using
the DEA approach, namely the BCC model. The
results of the BCC model identified Bulgaria,
Poland, Czech Republic and Hungary as leader CEE
countries in terms of efficiency of very large
companies in the food sector in the period of 2005-
2013. Bosnia and Herzegovina, Montenegro and
Slovakia were relatively inefficient in this dataset.
Croatia and Romania showed to be somewhere in
the top middle, which is rather surprising since
Romanian food industry is considered as more
developed. Moreover, the model detects the ex-post
efficiency/ inefficiency of decision-making units.
The results indicate variables where improvements
can be made. It also indicates the sources of
efficiency which a company/ country should
strengthen as its competitive advantage. The
findings are company/country specific. However, the
analysis does not include any future projections or
effects of the uncertainty. Limitations of this study
are related to the availability of financial data. It
must be noted that small and medium enterprises are
poorly covered in AMADEUS database. This
restricts the number of companies in the sample,
leading to conclusions that cannot be generalized.
As for further research, in order to derive the
generalized results, the analysis should also include
small, medium and large companies within food
industry, but that would require using models which
allow missing data. Also, it would be interesting to
conduct the similar analysis for all European
countries.
ACKNOWLEDGEMENTS
This research has been fully supported by Croatian
Science Foundation under the project The role of
structural reforms in boosting external
competitiveness in European Union countries.
REFERENCES
Ali, J., Singh, S.P., Ekanem, E., 2009. Efficiency and
Productivity Changes in the Indian Food Processing
Industry: Determinants and Policy
Implications.International Food and Agribusiness
Management, Vol. 12 (1), pp 43- 66
Banker, R. D., Charnes, A., Cooper, W. W. 1984. Some
Models for Estimating Technical and Scale
Inefficiencies in Data Envelopment Analysis.
Management Science, Vol. 30 (9), pp 1078–1092
Charles, V., Zegarra, L.F., 2014. Measuring regional
competitiveness through Data Envelopment Analysis:
A Peruvian case. Expert Systems with Applications,
Vol. 41, pp 5371-5381
Charnes, A., Cooper, W.W,. Rhodes, E., 1978. Measuring
the efficiency of decision making units, European
Journal of Operations Research, Vol. 2 (6), pp 429-
444
Charnes, A., Cooper, W.W. 1962. Programming with
linear fractional functionals. Naval Research Logistics,
Vol 9 (3-4), September - December 1962, pp 181–186
Cooper, W.W., Seiford, L.M., Zhu, Joe (eds.) 2011. Data
Envelopment Analysis: History, Models, and
Interpretations, In: Handbook on Data Envelopment
Analysis:International Series in Operations Research
& Management Science Springer 2011, pp. 1-39
European Commission, 2016. The competitive position of
the European food and drink industry, Final report.
Available at: http://edz.bib.uni-mannheim.de
/daten/edz-h/gdb/16/EA0416075ENN.pdf
FAO, 1997. The State of Food and Agriculture 1997
(SOFA):The Agroprocessing Industry and Economic
Development. Available at:
http://www.fao.org/docrep/w5800e/W5800e00.htm
FAO, 2009. Agro-industries for Development. Available
at: http://www.fao.org/docrep/017/i3125e/i3125e00
.pdf
FoodDrink Europe, 2016. A Competitive EU Food and
Drink Industry for Growth and Jobs: Ambitions for
2025. Priorities and policy recommendations.
Available at: http://www.fooddrinkeurope.eu/uploads/
publications_documents/Competitive_food_industry_
growth_jobs_report.pdf
Kocisova, K., 2015. Application of the DEA on
themeasurment of efficiency in the EU
countries.Agricultural Economics – Czech, Vol. 61
(2), pp 51-62
Pastor, J. T., Ruiz, J. L., 2007. Variables With Negative
Values in Dea. In: Modelling Data Irregularities And
Measuring the Efficiency of the Food Industry in Central and East European Countries by using the Data Envelopment Analysis Approach
389

Structural Complexities. In Data Envelopment
Analysis, Cook, W., Zhu, J. (eds.). Springer, e–book,
pp 63–84.
Rodmanee, S., Huang, W., 2013. Efficiency Evaluation of
Food and Beverage Companies in Thailand: An
Application of Relational Two-Stage Data
Envelopment Analysis.International Journal of Social
Science and Humanity, Vol. 3 (3), pp 202-205
Shamsudin, M.N., Yodfiatfinda, Mohamed, Z.A., Yusop,
Z., Radam, A., 2011. Evaluation of market
competitiveness of SMEs in the Malaysian Food
Processing Industry. Journal of Agribusiness
Marketing, Vol. 4., pp 1-20
Smirlis, Y. G., Maragos, E. K., Despotis, D. K. 2006. Data
Envelopment Analysis with Missing Values: An
Interval DEA Approach. Applied Mathematics and
Computation, Vol. 177 (1), pp 1–10
STATISTICAL OFFICE OF THE EUROPEAN
COMMUNITIES. (2016). EUROSTAT:
Manufacturing statistics - NACE Rev. 2. Available at:
http://ec.europa.eu/eurostat/statistics-explained/index.
php/Manufacturing_statistics_-_NACE_Rev._2
Tektas, A., Tosun, E.O., 2010. Performance
Benchmarking in Turkish Food and Beverage
Industry. Communications of the IBIMA, Vol. 2010
Verschelde, M., Dumont, M., Rayp, G., Merlevede, B.,
2016. Semiparametric stochastic metafrontier
efficiency of European manufacturing firms. Journal
of Productivity Analysis, Vol. 45, No. 1, pp 53-69
Wijnands, J.H.M., Verhoog, D.,2016. Competitiveness of
the EU food industry; Ex-post assessment of trade
performance embedded in international economic
theory.Wageningen, LEI Wageningen UR (University
& Research centre), LEI Report 2016-018. Available
at: http://edepot.wur.nl/369980
APPENDIX
In this section we bring the figure and tables that we
have referenced in the text.
Table A1: Number of companies per country per year included in the study.
2005 2006 2007 2008 2009 2010 2011 2012 2013
BIH
11 12 15 14 14 12 11 7 8
HUN
11 10 13 13 13 14 15 15 15
CRO
17 17 17 17 17 17 17 17 15
SLV
3 4 4 4 4 4 4 4 4
SER
50 53 54 55 49 48 48 49 43
ROM
40 28 40 42 42 40 43 42 42
CZE
13 11 14 14 16 17 16 17 17
POL
51 65 72 76 86 85 85 84 78
BUL
3 4 5 6 7 6 6 6 7
SL
K
6 11 10 11 11 11 11 11 11
MNE
3 3 0 0 6 6 7 6 1
LAT
1 1 1 1 1 1 1 2 2
LIT
7 8 8 8 8 8 8 8 8
216 227 253 261 274 269 272 268 251
Table A2: Number of companies per activity (by NACE classification) per year included in the study.
2005 2006 2007 2008 2009 2010 2011 2012 2013
C10.7
5 5 335544 2
C10.7.1
26 26 28 28 27 29 28 25 24
C10.8.2
16 16 17 18 21 21 20 21 20
C10.8.4
1 1 222222 2
C10.6.1
29 29 31 34 33 32 31 33 29
C10.8.6
3 3 333333 3
C10.5.2
1 1 111111 1
C10.7.3
1 1 223333 3
C10.8.9
3 3 567699 8
C10.9.1
22 22 23 23 24 23 25 23 22
C10.9.2
5 5 556666 6
C10.6.2
6 6 677777 7
C10.8.1
14 14 15 15 18 16 17 17 16
C10.5.1
39 39 47 47 49 49 48 48 47
C10.2
7 7 789998 8
C10.1.1
25 25 29 29 27 26 29 27 26
C10.3.1
2 2 222222 2
C10.1.2
9 9 12 12 12 12 11 12 9
C10.1.3
13 13 15 16 18 17 17 17 16
ICORES 2017 - 6th International Conference on Operations Research and Enterprise Systems
390

Table A3: Efficient and 5 least efficient companies, 2005-2009.
2005 2006 2007 2008 2009
ROM124.C10.1.1 POL145.C10.1.3 ROM160.C10.6.2 POL51.C10.8.2 POL94.C10.9.2
CRO143.C10.1.3 SER169.C10.1.1 POL184.C10.1.3 SER120.C10.1.1 POL150.C10.8.2
POL192.C10.9.1 POL191.C10.9.1 POL206.C10.5.1 BUL194.C10.8.6 BUL157.C10.8.6
POL207.C10.8.1 ROM211.C10.1.1 ROM199.C10.1.1 ROM175.C10.5.1
POL222.C10.9.1 POL228.C10.9.1 ROM177.C10.1.1
ROM240.C10.1.3 ROM188.C10.1.3
POL260.C10.3.1 POL239.C10.9.1
…
…
…
…
…
BIH133.C10.1.1 BIH1.C10.7 BIH179.C10.1.1 SER72.C10.6.1 SER78.C10.6.1
MNE161.C10.8.4 ROM154.C10.8.2 SER42.C10.7.1 LAT216.C10.2 BIH6.C10.6.1
SER61.C10.6.1 SER37.C10.8.2 SER74.C10.6.1 SER93.C10.6.2 ROM217.C10.6.1
BIH6.C10.6.1 BIH126.C10.1.1 ROM201.C10.6.1 SLK156.C10.8.1 ROM189.C10.1.3
SER59.C10.6.1 BIH4.C10.6.1 SER193.C10.9.1 ROM205.C10.7.1 BIH77.C10.6.1
Table A4: Efficient and 5 least efficient companies, 2010-2014.
2010 2011 2012 2013
ROM139.C10.1.1 SER55.C10.7.1 ROM127.C10.1.1 HUN8.C10.6.2
POL148.C10.1.1 SER110.C10.8.1 ROM159.C10.1.1 ROM78.C10.8.9
POL180.C10.1.3 ROM135.C10.1.1 ROM198.C10.6.1 ROM116.C10.1.1
BUL193.C10.8.6 MNE197.C10.1.1 SER273.C10.6.1 BUL157.C10.8.1
ROM203.C10.1.1 ROM200.C10.1.1 ROM161.C10.1.1
POL227.C10.1.3 POL233.C10.8.2 POL207.C10.8.2
POL233.C10.8.2 POL238.C10.9.1 SER257.C10.6.1
POL238.C10.9.1
POL273.C10.1.2
…
… … …
SER86.C10.6.1 POL219.C10.2 CZE 50.C10.7.1 POL24.C10.6.1
BIH1.C10.7 ROM152.C10.1.3 SER68.C10.8.2 HUN44.C10.1.1
SER85.C10.6.1 ROM180.C10.7.1 ROM38.C10.5.1 ROM38.C10.5.1
ROM211.C10.6.1 ROM206.C10.6.1 ROM171.C10.7.1 SER152.C10.9.1
ROM158.C10.1.3 POL226.C10.1.1 POL232.C10.2 ROM37.C10.5.1
Table A5: Average inefficiency of input (%).
2005 2006 2007 2008 2009 2010 2011 2012 2013
BIH -12.47 -93.43 -54.31 -71.16 -71.55 -68.24 -89.83 -69.37 -61.04 -66.30
HUN 0.00 -51.63 0.00 -6.53 -4.20 -3.30 -44.64 0.00 0.00 -13.79
CRO -4.74 -78.34 -17.33 -29.32 -31.67 -30.31 -62.47 -23.32 -3.32 -34.69
SLV 0.00 -87.01 -1.48 -3.56 -1.79 0.00 -82.84 -1.81 0.00 -22.31
SER -1.74 -88.61 -26.01 -34.22 -36.78 -33.64 -77.00 -18.06 -14.22 -39.51
ROM 0.00 -59.87 -3.49 -19.73 -15.72 -18.17 -56.67 -11.36 -14.91 -23.13
CZE 0.00 -67.09 0.00 -2.42 -6.37 -6.67 -50.13 -4.07 -3.70 -17.09
POL 0.00 -47.32 -3.23 -13.00 -12.57 -8.13 -37.01 -5.59 -7.65 -15.86
BUL 0.00 -42.88 -6.83 0.00 -13.23 0.00 -45.95 -11.62 -4.18 -15.06
SL
K
0.00 -86.68 -20.31 -27.10 -32.90 -31.38 -72.88 -18.95 -20.80 -36.27
MNE -33.30 -92.81 -61.96 -69.62 -82.42 -74.93 0.00 -69.17
LAT 0.00 -93.18 -13.73 -87.51 -57.19 -32.91 -92.54 -9.04 -16.19 -48.26
LIT 0.00 -75.23 0.00 -5.55 -8.28 -8.30 -66.28 -3.45 -7.47 -20.89
-4.02 -74.16 -12.23 -25.01 -27.25 -23.90 -66.20 -19.35 -11.81
Measuring the Efficiency of the Food Industry in Central and East European Countries by using the Data Envelopment Analysis Approach
391
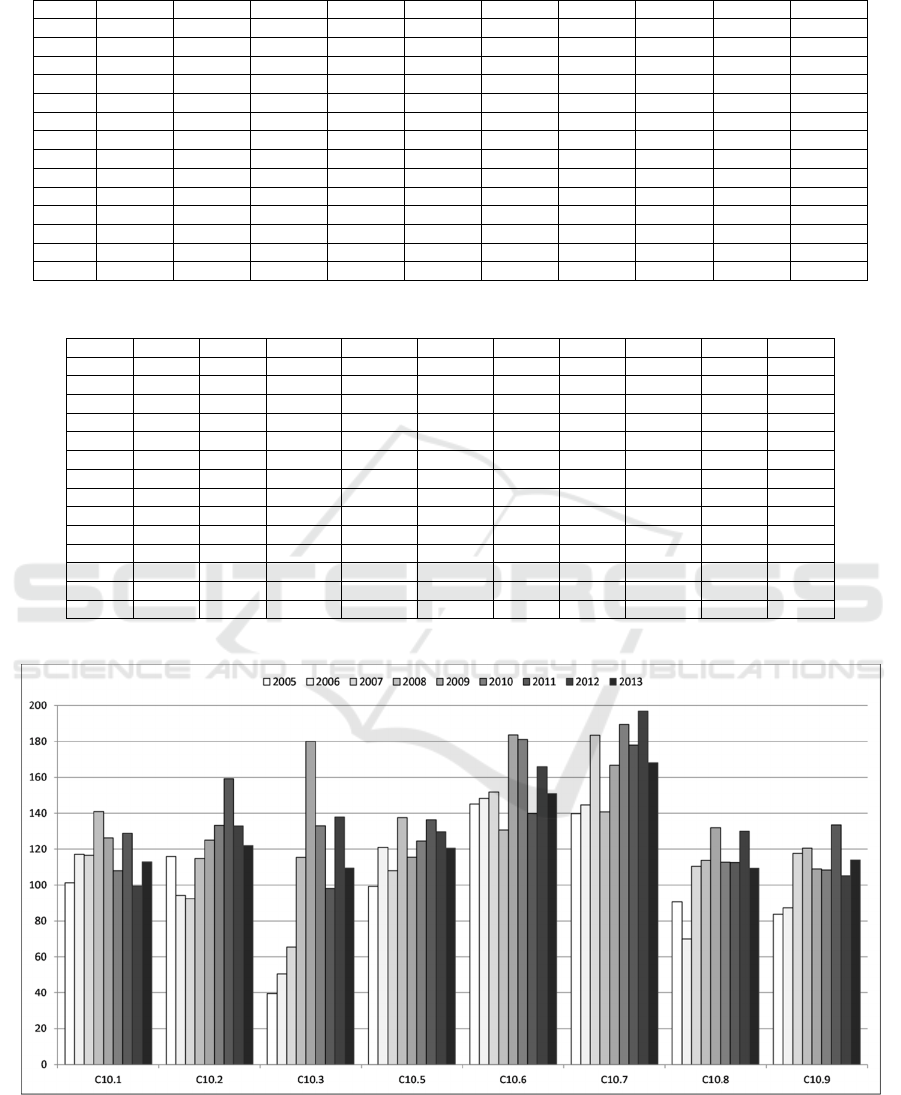
Table A6: Average inefficiency of ROA (%).
2005 2006 2007 2008 2009 2010 2011 2012 2013
BIH 132.62 202.75 95.25 44.51 180.67 87.99 24.95 27.55 57.74 99.53
HUN 61.85 154.15 64.06 30.88 60.27 54.57 23.12 19.33 45.07 58.53
CRO 75.76 117.78 68.16 23.89 57.40 54.77 21.51 24.26 44.97 55.44
SLV 99.31 178.00 78.30 28.39 67.17 64.45 24.76 25.35 52.31 70.72
SER 130.10 210.06 89.24 36.81 73.81 71.13 19.59 24.73 46.22 81.93
ROM 71.17 149.79 67.95 66.78 187.90 74.18 26.33 21.96 50.27 83.26
CZE 64.00 151.69 68.51 27.62 61.50 50.22 18.84 18.45 36.53 57.60
POL 55.45 98.12 50.72 29.10 56.19 39.77 18.95 18.90 34.95 45.90
BUL 60.21 74.20 53.84 24.77 46.49 38.94 18.16 16.70 27.88 41.66
SL
K
150.02 166.41 79.19 41.93 63.50 61.68 21.65 22.11 45.22 75.81
MNE 135.35 184.93 67.16 88.34 22.23 30.35 48.75 88.06
LAT 99.33 250.19 79.78 0.00 75.48 51.94 22.03 28.03 49.93 75.85
LIT 58.88 118.77 68.26 29.79 57.70 44.91 19.59 19.18 36.39 52.14
91.85 158.22 71.94 32.04 81.17 60.22 21.67 22.84 44.33
Table A7: Average inefficiency of profit margin (%).
2005 2006 2007 2008 2009 2010 2011 2012 2013
BIH 79.26 44.78 281.26 145.80 169.59 87.99 28.68 41.88 85.22 107.16
HUN 27.23 26.89 60.99 29.82 57.04 53.67 24.22 29.04 45.07 39.33
CRO 29.28 19.22 66.83 23.86 55.33 52.77 36.07 37.24 44.97 40.62
SLV 33.85 28.11 78.30 28.39 67.17 64.45 25.54 41.09 52.31 46.58
SER 49.98 33.41 85.23 43.61 72.96 72.64 26.69 53.01 97.32 59.43
ROM 29.35 26.01 72.35 52.22 77.77 88.60 33.93 49.74 53.95 53.77
CZE 26.91 25.99 63.10 26.42 57.31 49.26 20.25 26.69 37.08 37.00
POL 25.25 21.16 50.09 27.23 46.72 38.34 20.23 28.16 34.87 32.45
BUL 23.71 16.48 53.84 24.77 43.70 38.94 18.83 23.00 27.88 30.13
SL
K
42.78 24.71 79.19 41.93 63.50 61.68 26.38 33.47 45.22 46.54
MNE 76.80 34.08 67.16 65.20 29.64 299.42 48.75 88.72
LAT 33.45 37.07 79.78 131.69 75.48 51.94 23.11 45.77 49.93 58.69
LIT 27.62 23.84 68.26 29.79 57.70 44.91 21.48 28.79 36.39 37.64
38.88 27.83 86.60 50.46 70.11 59.26 25.77 56.71 50.69
Figure A1: Rankings of food industry subsectors by years.
ICORES 2017 - 6th International Conference on Operations Research and Enterprise Systems
392
