
Designing Charging Infrastructure for a Fleet of Electric Vehicles
Operating in Large Urban Areas
Michal Koh
´
ani
1
, Peter Czimmermann
1
, Michal V
´
a
ˇ
na
1
, Matej Cebecauer
2
and
ˇ
Lubo
ˇ
s Buzna
1,3
1
Department of Mathematical Methods and Operations Research, University of
ˇ
Zilina,
Univerzitn
´
a 8215/1, SK-01026
ˇ
Zilina, Slovakia
2
Department of Transport Science, KTH Royal Institute of Technology, Teknikringen 10, SE-100 44 Stockholm, Sweden
3
ERA chair for Intelligent Transport Systems, University of
ˇ
Zilina, Univerzitn
´
a 8215/1, SK-01026
ˇ
Zilina, Slovakia
Keywords:
Electric Vehicles, Charging Infrastructure, Urban Areas, GPS Traces.
Abstract:
Here, we propose a method to design a charging infrastructure for a fleet of electric vehicles such as a fleet
of taxicabs, fleet of vans used in the city logistics or a fleet of shared vehicles, operating in large urban areas.
Design of a charging infrastructure includes decisions about charging stations location and number of charging
points at each station. It is assumed that the fleet is originally composed of vehicles equipped with an internal
combustion engine, however, the operator is wishing to replace them with fully electric vehicles. To avoid an
interaction with other electric vehicles it is required to design a private network of charging stations that will be
specifically adapted to the operation of a fleet. It is often possible to use GPS traces of vehicles characterizing
actual travel patterns of individual vehicles. First, to derive a suitable set of candidate locations from GPS
data, we propose a practical procedure where the outcomes can be simply controlled by setting few parameter
values. Second, we formulate a mathematical model that combines location and scheduling decisions to ensure
that requirements of vehicles can be satisfied. We validate the applicability of our approach by applying it to
the data characterizing a large taxicab fleet operating in the city of Stockholm. Our results indicate that this
approach can be used to estimate the minimal requirements to set up the charging infrastructure.
1 INTRODUCTION
Road transport produces 20% of total carbon diox-
ide (CO
2
) emissions, which is the main greenhouse
gas. While these emissions decreased by 3.3% in
2012, they are still 20.5% higher than in 2011 and it
could have been even more if there is no economic
crises (Europen Commision, 2015). It is therefore
expected that in order to reduce CO
2
emission in
densely populated urban areas, it will be desired to
continue electrification of individual and public trans-
port. However, electrification of transport itself does
not ensure the reduction of CO
2
emission, also the the
higher penetration of renewable sources of electrical
energy is necessary. Advances in battery technologies
and continuously decreasing prices of electric vehi-
cles may soon increase the interest in converting large
fleets of vehicles serving urban areas into electric, be-
cause the expected benefits could be considerable due
to high utilization of such vehicles. Thus, high pur-
chase costs of a new electric vehicle can be more eas-
ily compensated by lower operational costs. To avoid
delays in charging, caused by interaction with other
electric vehicles, a choice of a fleet operator can be to
build their own charging infrastructure.
The topic of planning charging infrastructure for
electric vehicles is rapidly growing in the scientific lit-
erature. The attention of researchers has been focus-
ing on creating models that would be able to predict
the future expansion of electric vehicles (Sears et al.,
2014) as well as models designed to estimate the size
of the future demand for charging vehicles (Yi and
Bauer, 2014). An approach, where GPS traces of ve-
hicles collected in two Italian cities were used to ex-
tract the travel behaviour and to estimate the expected
demand for charging vehicles, was used in (Paffumi
et al., 2015; Gennaro et al., 2015). Such analysis can
provide valuable hints when searching for suitable po-
sitions of charging stations. Data driven approach to
predict the penetration of EVs in the region of Lis-
bon and the future refuelling demand was proposed
in (Frade et al., 2011).
Optimization algorithms have been often used to
address this problem as well. In (Dickerman and Har-
360
Kohà ˛ani M., Czimmermann P., Và ˛aÅ
´
La M., Cebecauer M. and Buzna Ä¡.
Designing Charging Infrastructure for a Fleet of Electric Vehicles Operating in Large Urban Areas.
DOI: 10.5220/0006194403600368
In Proceedings of the 6th International Conference on Operations Research and Enterprise Systems (ICORES 2017), pages 360-368
ISBN: 978-989-758-218-9
Copyright
c
2017 by SCITEPRESS – Science and Technology Publications, Lda. All rights reserved

rison, 2010) was used a city transportation model to
verify various locations of charging stations, which
were generated by the genetic algorithm. A bi-level
approach was proposed by (Jung et al., 2014). On
the upper level is solved the location problem (con-
sidering the capacity of charging stations), where the
total costs and waiting time are minimized. On the
lower level is used simulation approach to evaluate
each design. Simulation as a validation tool has
been used relatively often (Sweda and Klabjan, 2011).
In (Xi et al., 2013) authors developed the simulation-
optimization approach, where the area is divided into
regions. The OD-matrix for the regions is known and
it is used to estimate the EV flows between them. Lin-
ear IP model is used to determine the location and size
of charging stations subject to limited budget. Simu-
lation model is used to estimate the expected number
of vehicles successfully charged at each candidate lo-
cation. (Dong et al., 2014) proposed an approach that
allows for analyzing the impact of public charging in-
frastructure deployment on increasing electric miles
travelled. A genetic algorithm is used to find loca-
tions of charging stations and it is evaluated by the
activity-based assessment method. Combination of
a simulation approach with a genetic algorithm that
utilizes GPS traces of vehicles was presented in (Tu
et al., 2015).
Several authors considered a location problem
leading to a mixed integer programming problem. For
example, in (Chen et al., 2013) the demand for charg-
ing electric vehicles on public parking lots was esti-
mated, based on a traffic survey conducted in the city
of Seattle. The suitable location of charging stations
was found by minimising the costs and the optimi-
sation problem was solved by a general purpose opti-
misation solver. A similar methodology was also used
for the city of Lyon (Baouche et al., 2014) and the city
of Coimbra (Cavadas et al., 2014). When designing
a network of charging stations, capacity constraints
are typically included in the model (Lam et al., 2014;
Ghamami et al., 2016) and apart from minimising
costs, the area covered within the driving distance
is maximised (Yi and Bauer, 2014). Methodologi-
cally different approach has been presented in (Mom-
tazpour et al., 2012). Here authors considered con-
straints implied by the daily activity of car users and
the capacity of electrical network and the location of
charging stations were found by the clustering algo-
rithm. The advantage of this approach is that several
types of constraints can be taken into account simul-
taneously, without significantly affecting the compu-
tational complexity of the algorithm.
The special class of models was developed to
cover trajectories of vehicles (MirHassani and Ebrazi,
2013; Capar et al., 2013). This approach is applica-
ble in the design of the charging infrastructure along
a highway to cover for long distance trips. An elegant
way how to locate charging stations along the paths
was proposed by (MirHassani and Ebrazi, 2013). The
approach is based on adding artificial links to the net-
work graph conecting places that fulfil some reach-
ability rules. The model locates the minimum num-
ber of refuelling stations along paths to make the path
traversal feasible. The approach (Chung and Kwon,
2015) further extends (MirHassani and Ebrazi, 2013)
by considering multi-period case.
As our contribution, we propose an approach that
is purely based on an optimization approach where we
combine location and scheduling problems and thus
we avoid the need to validate the locations and ca-
pacity of charging stations by computer simulations.
Because the approach is based on historic data it can
be used to estimate the minimum design of the sys-
tem that is sufficient to cope with various scenarios
occurring in the past.
The paper is organized as follow: in section 2 we
describe the data requirements and the methodology.
In section 3, we describe the data used in the case
study and we introduce the results of numerical exper-
iments. To conclude, we summarise our main findings
in section 4.
2 METHODOLOGY
2.1 Data Requirements
The proposed method to design the network of pri-
vate charging stations relies on two datasets. The
first dataset is expected to contain historical low-
frequency GPS data describing the mobility patterns
of individual vehicles that belong to the fleet. Data
should be collected for several, typical and suffi-
ciently long time periods representing relevant sce-
narios that should be included in the design of the
charging network. To collect low frequency data is
much easier in practice as there is no need to use ex-
pensive GPS trackers, however, such data are not pre-
cise enough to determine the travel distances. There-
fore we need the graph model of the road network
including data about nodes, edges and their elevation.
Using this data we can perform the map matching and
estime the travel distances much more precisely by in-
ducing them from the road network.
Designing Charging Infrastructure for a Fleet of Electric Vehicles Operating in Large Urban Areas
361

2.2 Algorithm to Determine a
Candidate Set of Charging Station
Locations
In this paper, we will explore the case where to
recharge an electric vehicle, we use only the time
when it is parking for a long enough time. Thus, if
possible, we do not wish to affect the current trajecto-
ries that are taken by vehicle drivers. The proposed
methodology allows then to evaluate what percent-
age of vehicles could be transformed to electric ve-
hicles without affecting their operation with the mini-
mal requirements on building the charging infrastruc-
ture. Therefore, we use the historic GPS data to iden-
tify the set of suitable candidate locations for charging
stations. Here, we aim to identify locations where the
large number of vehicles frequently parks. To do so,
we proposed the following two-phase procedure:
• Phase 1: Identify the set of candidate locations
for charging stations as locations where many ve-
hicles tend to park for a long enough time.
• Phase 2: Identify the set of vehicles that can be
served by selected set of candidate locations.
To determine the set of candidate locations, fol-
lowing parameters are used. As an parking event we
identify the time period, when the average speed of a
vehicle is below the maximum speed limit V
max
for at
least a time period of T
min
. To ensure that we select a
relevant set of candidate location we require for each
candidate to be associated with at least M
min
parking
events taking place in its circular neighbourhood de-
fined by the radius of R
max
.
In the first phase, we process one-by-one the GPS
traces of all vehicles executing the following steps
(see Figure 1):
• Step 1: Identify in the GPS trace the traversals
that have the average speed below the speed limit
V
max
.
• Step 2: Identify in the GPS trace the maximum
connected sequences of traversals longer than the
time period T
min
.
• Step 3: Identify as a candidate location the last
node of each connected sequence if there is no
other candidate location within the distance R
max
.
After processing all GPS traces we remove all
candidate locations that are associated with less than
M
min
parking events.
The second phase of the procedure evaluates the
proposed set of candidate locations and identifies the
set of vehicles that could be replaced by the elec-
tric vehicles. For each vehicle we evaluate its trajec-
tory and we evaluate whether it could be sufficiently
Figure 1: Diagram illustrating the identification of candi-
date locations. Nodes represent GPS position of the vehicle
in time t
i
, links are traversals between two GPS positions.
Black coloured links represent traversals, where the average
speed v
i
is below the limit V
max
and black coloured node
represents the candidate location.
recharged during parking events, to cover the travel
distances. Here we consider the unlimited capacity of
charging points being locating in each candidate lo-
cation. We assume that the capacity of each vehicle
is K (measured in kilometres), i.e. it corresponds to
the reachable driving distance. As a vehicle is driven
its state of charge is decreasing by substricting from
it the travel distance. Each time unit when the vehicle
is charged we increase its state of charge by the value
of P. We record the number of vehicles that cannot
be served by a given set of candidate locations. In the
mathematical model we consider only vehicles that
can be recharged, otherwise the proposed mathemati-
cal model has no feasible solution.
2.3 Mathematical Model
We aim to minimize the costs that are required to set
up the charging infrastructure. Due to the fact that
in our approach we expect to locate charging stations
of the same type, we minimize just the number of
charging points. Previous studies (Sweda and Klab-
jan, 2011; Xi et al., 2013; Dong et al., 2014) indicated
that an important requirement is to consider queueing
behaviour of vehicles while charging. Therefore we
formulate a location optimization problem consider-
ing the scheduling problem to ensure that there exist
a feasible schedule how to recharge vehicles.
We assume that the algorithm introduced in the
previous section was used to produce the set of candi-
date location where it is possible to locate the charg-
ing infrastructure I. To schedule the individual charg-
ing time slots we split the time into the set of non-
overlapping time intervals T . Then for each vehicle
we distinguish two possible states (see Figure 2). A
vehicle is either parking at the candidate locations and
it is available for charging or it is located somewhere
else where it cannot be charged.
The maximum number of charging stations is lim-
ited to p. We consider that the fleet is composed of
the set of vehicles C and each vehicle is equipped by
the battery, which when fully charged allows for driv-
ing the vehicle for the distance K. From the data we
ICORES 2017 - 6th International Conference on Operations Research and Enterprise Systems
362

Figure 2: Diagram illustrating the movement of individual
vehicles between the candidate locations. Vehicle is either
parking at the candidate locations and thus it is available for
charging (coloured rectangles) or it is located somewhere
where it cannot be charged (coloured dashed lines).
extract for each vehicle c ∈ C an ordered sequence of
parking events R
c
and we determine the list N
cr
of all
time intervals t ∈ T that have an overlap with parking
event r ∈ R
c
. The fraction of the time interval t ∈ T
the vehicle c ∈ C is parking we denote as a
ct
∈
0, 1
.
To simplify the description of the mathematical model
we define B
itc
∈ {0, 1}, where B
itc
= 1 if the vehicle
c ∈ C parks at the location i ∈ I during the time inter-
val t ∈ T and B
itc
= 0 otherwise. We use the graph of
the road network to extract the information about the
real travel distances. Vehicle c ∈ C drives u
cr
kilome-
tres while driving from the parking event r − 1 to the
parking event r. Each vehicle enters into the model
with an fictive parking event r = 0 of zero duration
and exits with an fictive parking event r = r
c
of zero
duration. Symbol M denotes the big − M constant.
Decisions are described by the set of variables:
• y
i
∈ {0, 1} for i ∈ I, where y
i
= 1 if the charging
station is located at the candidate location i and
y
i
= 0 otherwise,
• s
i
∈ Z
+
for i ∈ I, representing the number of
charging points allocated to the station i ∈ I,
• x
ct
∈ {0, 1} for c ∈ C, t ∈ T , where x
ct
= 1 when
vehicle c ∈ C is being charged during the time in-
terval t ∈ T and x
ct
= 0 otherwise, and
• d
cr
≥ 0 for c ∈ C, r ∈ R
c
∪ {0} ∪ {r
c
} corresponds
to the distance that the vehicle c ∈ C at the begin-
ning of the parking event r ∈ R
c
is able to drive.
Making use of these notation we formulate the
location-scheduling problem that is shown in Fig-
ure 3.
In the objective function of the problem (1) we
minimize the number of located charging points.
Constraint (2) ensures that we do not locate more than
p charging stations. This constraints approximates the
limitations that are associated with the establishment
of a new charging station. Constraints (3) make sure
that we can assign charging points only to located
charging stations. In each time interval we cannot
use more charging points than available as it is spec-
ified by the set of constraints (4). We initialize the
system by limiting the driving distance to αK, where
α > 0 is parameter of the model (see constraints (5)).
Constraints (6) ensure that battery capacity is not ex-
ceeded and constraints (7) ensure contiguity in charg-
ing and discharging of batteries.
3 NUMERICAL EXPERIMENTS
3.1 Data
In the case study we consider a fleet of more than
1,500 taxicabs operating in the area of Stockholm dis-
trict, in Sweden. Each vehicle reported on average
every 90 seconds its id, GPS position, time-stamp
and information whether it is hired or not. For the
case study we selected four weeks (see Figure 4), al-
together comprised of 8,989,143 probe data records.
These four weeks represent different scenarios: week
1 is a typical spring week with 1542 taxicabs, week 2
represents typical summer week with 1526 taxicabs,
week 3 is the Christmas week with 1491 taxicabs and
week 4 is a special week, when the major disruption
of the public transport occurred due to many failed
railway connections, with 1550 taxicabs.
As the reporting frequency of probe data is rela-
tively low, to be able to measure the travel distances
more accurately we map-matched the probe data onto
the road network using the methodology proposed
in (Rahmani and Koutsopoulos, 2013). Thus, we use
the road network to estimate the travel distance. In
the digital model of the road network each link is at-
tributed a number of parameters, including the length,
presence of a traffic signal, road class, speed limit and
etc. The graph of road network used in the case study
consists of 231,839 links. In Figure 5 we show ac-
cumulated number of traversals by taxicabs over all
four weeks for all links of the road network. We have
no traversals for 97,720 links, where 96% of these are
class 5 links. Conversely, the largest frequency of us-
age we observe on class 1 links connecting the city of
Stockholm with the airports and in the city centre.
3.2 Numerical Results
We set the following values of parameters: the driving
range of all vehicles K = 300 km, the initial fraction
of the driving range α = 0.5, the charging speed P =
5 km/min., we do not limit the number of charging
stations, i.e., p = |I|, V
max
= 0.1 m/s and T
min
= 15
min. When constructing the mathematical model we
Designing Charging Infrastructure for a Fleet of Electric Vehicles Operating in Large Urban Areas
363

Model formulation
Minimize
∑
i∈I
s
i
(1)
subject to
∑
i∈I
y
i
≤ p (2)
My
i
≥ s
i
for i ∈ I (3)
∑
c∈C
B
itc
x
ct
≤ s
i
for i ∈ I,t ∈ T (4)
d
c0
≤ αK (5)
d
cr
+
∑
t∈N
c,r
a
ct
x
ct
P ≤ K for c ∈ C, r ∈ R
c
∪ {r
c
} (6)
d
cr
≤ d
c,r−1
− u
cr
+
∑
t∈N
c,r−1
a
ct
x
ct
P for c ∈ C, r ∈ R
c
∪ {r
c
} (7)
Figure 3: Mathematical formulation of the location-scheduling optimization problem.
Figure 4: The travel distance, the travel distance when the
taxicabs were hired, the number of unique taxicabs and
dates of individual weekdays in weeks 1-4 that we selected
for the case study.
discretize the time in steps of 15 minutes. Results of
experiments are shown in Tables 1 - 4.
Numerical experiments were performed on the
computer equipped with CPU Intel (R) Core i7-
5500U CPU with two 3 GHz cores and with 8 GB
RAM. Mathematical model was solved using IP-
solver FICO Xpress IVE 7.3.
Based on the initial experiments we selected
the folowing values of input parameters R
max
∈
{100, 500, 1000} meters and M
min
∈ {100, 150, 800}
parking events to cover the broad range of situations.
In tables we report the following output values ob-
tained from the algorithm that is used to determine
a set of candidate locations : |I| is the cardinality of
the set of candidate locations identified in the Phase
1, Cars is the number of taxicabs that are determined
in the Phase 2 as the vehicles that can be served by
the set of candidate locations. Optimization outputs
are the following: Stations is the number of located
charging stations, CP
total
represents the total number
of charging points in all charging stations and CP
max
is the maximal number of charging points located in
one charging station. Column Time contains compu-
tational time in seconds. We restricted the running
time of a single experiment to 30 minutes. If the op-
timal solution was not found within this time limit, in
the column Gap we report the relative gap between
the upper and lower bounds of the optimal solution.
In two cases the solver was not able to find any fea-
sible integer solution within the given time limit what
is indicated by the symbols ’***’ in the particular row
of the table.
To verify the proposed approach, we visualised
the resulting locations of charging stations for the sce-
nario Week 1 and the parameter values R
max
= 100
meters and M
min
= 150 parking events. Results are
shown in the Figure 6.
4 EVALUATION OF RESULTS
AND CONCLUSIONS
In this contribution we present an initial design of
the method to deploy the charging infrastructure for
a fleet of electric vehicles operating in large urban
areas. The operation of the fleet is described by the
GPS traces characterizing the actual travel patterns of
ICORES 2017 - 6th International Conference on Operations Research and Enterprise Systems
364

Table 1: Results of numerical experiments for the scenario Week 1.
R
max
M
min
Cars | I | Stations CP
total
CP
max
Time[s] Gap[%]
100 800 609 3 3 14 9 1.88 0.00
150 1186 27 27 38 6 1800.00 5.26
100 1287 44 44 54 6 22.10 0.00
500 800 1102 5 5 20 10 46.05 0.00
150 1442 46 40 44 5 1800.00 2.27
100 1475 77 51 54 4 1800.00 4.50
1000 800 1347 7 7 19 6 1800.00 21.05
150 1499 51 39 42 3 1800.00 4.57
100 1510 70 51 55 3 1800.00 46.90
Table 2: Results of numerical experiments for the scenario Week 2.
R
max
M
min
Cars | I | Stations CP
total
CP
max
Time[s] Gap[%]
100 800 785 4 4 17 9 2.828 0.00
150 1292 30 30 35 4 16.642 0.00
100 1363 46 44 49 4 27.673 0.00
500 800 1188 5 5 18 7 1800.00 22.22
150 1477 46 36 38 2 218.37 0.00
100 1498 73 47 49 2 1800.00 272.97
1000 800 1409 8 8 19 5 1800.00 30.84
150 1506 50 38 63 3 1800.00 72.03
100 1513 69 *** *** *** *** ***
Table 3: Results of numerical experiments for the scenario Week 3.
R
max
M
min
Cars | I | Stations CP
total
CP
max
Time[s] Gap[%]
100 800 449 2 2 4 2 0.34 0.00
150 1019 24 24 27 2 2.84 0.00
100 1094 36 36 37 2 6.83 0.00
500 800 843 4 4 5 2 6.17 0.00
150 1324 39 37 39 2 46.86 0.00
100 1359 57 52 53 2 291.05 0.00
1000 800 1172 6 6 11 2 27.80 0.00
150 1417 43 38 39 2 547.72 0.00
100 1445 65 47 48 2 898.37 0.00
Table 4: Results of numerical experiments for the scenario Week 4.
R
max
M
min
Cars | I | Stations CP
total
CP
max
Time[s] Gap[%]
100 800 631 3 3 17 13 7.66 0.00
150 1221 33 33 39 7 1800.00 2.56
100 1325 50 49 53 5 38.21 0.00
500 800 1097 5 5 19 10 1800.00 5.26
150 1491 50 40 42 3 1800.00 2.38
100 1515 80 56 58 3 1800.00 16.5
1000 800 1408 9 9 21 6 1800.00 18.67
150 1525 29 27 39 7 128.50 0.00
100 1534 74 *** *** *** *** ***
individual vehicles. In the first phase we used a prac-
tical procedure to derive from data a suitable set of
candidate locations for charging stations, where the
outcomes can be controlled by setting a few param-
eter values only. In the next step, vehicles that can
be served from the set of candidate locations are se-
lected. In the second phase, we formulated a mathe-
matical model that combines location decisions with
Designing Charging Infrastructure for a Fleet of Electric Vehicles Operating in Large Urban Areas
365
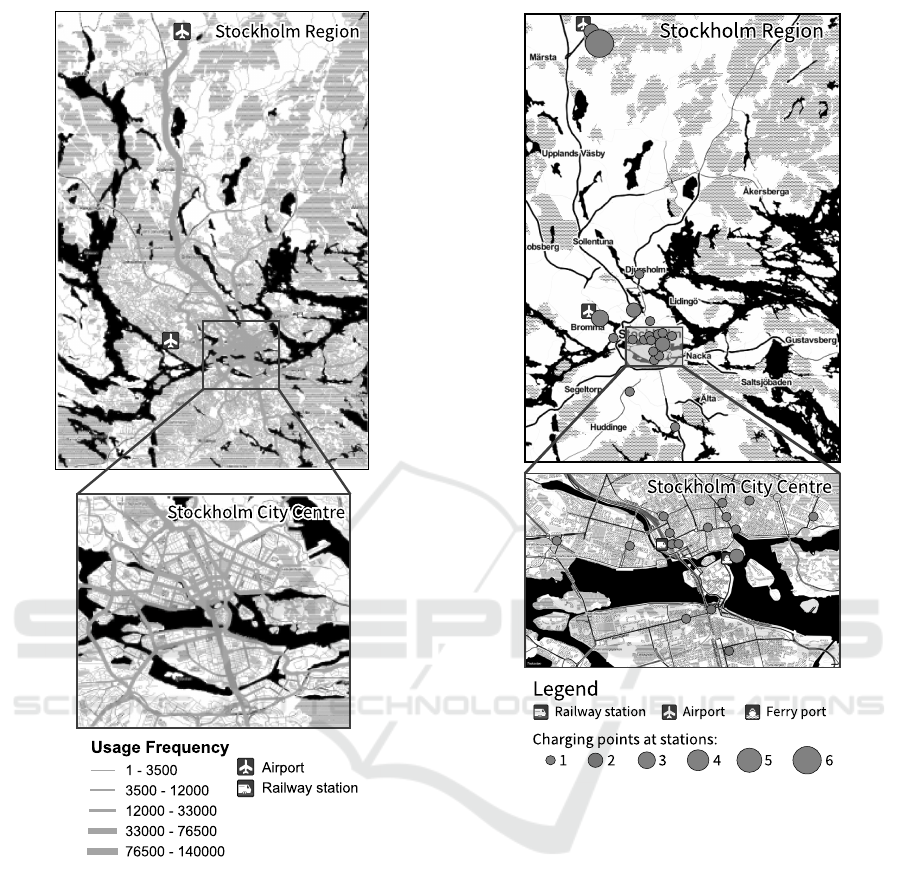
Figure 5: Visualisation of the road network considered in
the case study. Thickness of each link indicates the number
of traversals by the vehicles belonging to the taxicab fleet.
scheduling decisions to ensure that for a given design
there exists a time schedule that allows satisfying re-
quirements of all vehicles selected in the first phase.
The limits of the proposed approach were tested by
applying it to the real-world data characterizing the
driving behaviour of a large taxicab fleet operating in
the city of Stockholm. From the numerical experi-
ments we derive the following main conclusions:
• Our results indicate that this approach can be used
to estimate the minimal requirements to set up the
charging infrastructure. The proposed method is
able to handle relatively large instances of prob-
lems independently on the scenario. Problems
Figure 6: Locations of charging points obtained for the sce-
nario Week 1 and the values of input parameters R
max
= 100
meters and M
min
= 150 parking events.
with R
max
∈ {100, 500} and M
min
∈ {150, 800}
are often solved to optimality or with small gap
only.
• Charging points are typically located at parking
lots in the vicinity of airports, railways stations
and other public spaces, which seem to be natural
locations for them.
• When comparing the results across selected sce-
narios we find similar numbers of located stations
in weeks 1, 2 and 4 and significantly smaller num-
ber of charging points in week 3, which is the
most quiet week.
• We did not limit the number of charging stations
by setting the value of the parameter p. Hence,
the number of charging stations was limited only
by the set of candidate locations |I|. From the
ICORES 2017 - 6th International Conference on Operations Research and Enterprise Systems
366

solutions we can see that if |I| is large enough,
the optimization model has the tendency to se-
lect the large set of charging stations with only
few charging points more frequently than locat-
ing only few charging stations with many charg-
ing points. Such design can be also favourable
for the electricity network as it will not load the
network largely at few locations, but the load is
spatially more distributed.
• When we set the radius of charging points to
R
max
= 1000 meters, the number of charging op-
portunities gets high and the solved problem,
especially during the busy weeks, becomes in-
tractable when solved by a general purpose solver.
This result indicates the limits of this methodol-
ogy.
Although these initial results look promising, fur-
ther steps are needed to refine the proposed approach.
Considering the scheduling problem in the optimiza-
tion model makes sure that there exists a time sched-
ule to recharge all vehicles. However, this informa-
tion is derived from the past data and it remains un-
clear how hard it is to find a feasible schedule in the
system operation when the drivers do not have the
prior information about the departure from the park-
ing positions. Moreover, we assume that the parame-
ter R
max
determines the maximum distance the drivers
accept to drive from the parking position to the clos-
est charging station. It could be beneficial to consider
more complex strategies to determine the charging
station the driver decides to use. Another challenge
is in combining scenarios in a way that the resulting
problem can still be solved for the long enough time
period and we obtain as an output the robust design of
the charging infrastructure that is suitable for all con-
sidered scenarios. To overcome the limits of proposed
methodology, it would be beneficial to use heuristic
apporoaches to expand the size of solved problems.
ACKNOWLEDGEMENTS
This work was supported by the research grants
VEGA 1/0463/16, APVV-15-0179, and it was facil-
itated by the FP 7 project ERAdiate [621386].
REFERENCES
Baouche, F., Billot, R., Trigui, R., and Faouzi, N. E. E.
(2014). Efficient Allocation of Electric Vehicles
Charging Stations: Optimization Model and Appli-
cation to a Dense Urban Network. IEEE Intelligent
Transportation Systems Magazine, 6(3):33–43.
Capar, I., Kuby, M., Leon, V. J., and Tsai, Y.-J. (2013). An
arc cover–path-cover formulation and strategic anal-
ysis of alternative-fuel station locations. European
Journal of Operational Research, 227(1):142–151.
Cavadas, J., Correia, G., and Gouveia, J. (2014). Electric
Vehicles Charging Network Planning, pages 85–100.
Springer International Publishing, Cham.
Chen, T., Kockelman, K., and Khan, M. (2013). Locat-
ing Electric Vehicle Charging Stations. Transporta-
tion Research Record: Journal of the Transportation
Research Board, 2385:28–36.
Chung, S. H. and Kwon, C. (2015). Multi-period planning
for electric car charging station locations: A case of
Korean Expressways. European Journal of Opera-
tional Research, 242(2):677–687.
Dickerman, L. and Harrison, J. (2010). A New Car, a New
Grid. IEEE Power and Energy Magazine, 8(2):55–61.
Dong, J., Liu, C., and Lin, Z. (2014). Charging infras-
tructure planning for promoting battery electric ve-
hicles: An activity-based approach using multiday
travel data. Transportation Research Part C: Emerg-
ing Technologies, 38:44–55.
Europen Commision (2015). Road transport:
Reducing CO2 emissions from vehicles.
http://ec.europa.eu/clima/policies/transport/vehicles/.
Frade, I., Ribeiro, A., Gonc¸alves, G., and Antunes, A.
(2011). Optimal location of charging stations for elec-
tric vehicles in a neighborhood in Lisbon, Portugal.
Transportation research record: journal of the trans-
portation research board, (2252):91–98.
Gennaro, M. D., Paffumi, E., and Martini, G. (2015).
Customer-driven design of the recharge infrastructure
and Vehicle-to-Grid in urban areas: A large-scale ap-
plication for electric vehicles deployment. Energy,
82:294–311.
Ghamami, M., Nie, Y. M., and Zockaie, A. (2016). Plan-
ning charging infrastructure for plug-in electric vehi-
cles in city centers. International Journal of Sustain-
able Transportation, 10(4):343–353.
Jung, J., Chow, J. Y., Jayakrishnan, R., and Park, J. Y.
(2014). Stochastic dynamic itinerary interception re-
fueling location problem with queue delay for elec-
tric taxi charging stations. Transport.Research Part
C: Emerging Technologies, 40:123–142.
Lam, A. Y. S., Leung, Y. W., and Chu, X. (2014). Elec-
tric Vehicle Charging Station Placement: Formula-
tion, Complexity, and Solutions. IEEE Transactions
on Smart Grid, 5(6):2846–2856.
MirHassani, S. A. and Ebrazi, R. (2013). A Flexible Refor-
mulation of the Refueling Station Location Problem.
Transportation Science, 47(4):617–628.
Momtazpour, M., Butler, P., Hossain, M. S., Bozchalui,
M. C., Ramakrishnan, N., and Sharma, R. (2012). Co-
ordinated Clustering Algorithms to Support Charging
Infrastructure Design for Electric Vehicles. In Pro-
ceedings of the ACM SIGKDD International Work-
shop on Urban Computing, UrbComp ’12, pages 126–
133, New York, NY, USA. ACM.
Paffumi, E., Gennaro, M. D., Martini, G., and Scholz, H.
(2015). Assessment of the potential of electric vehi-
Designing Charging Infrastructure for a Fleet of Electric Vehicles Operating in Large Urban Areas
367

cles and charging strategies to meet urban mobility re-
quirements. Transportmetrica A: Transport Science,
11(1):22–60.
Rahmani, M. and Koutsopoulos, H. N. (2013). Path infer-
ence from sparse floating car data for urban networks.
Transportation Research Part C: Emerging Technolo-
gies, 30:41–54.
Sears, J., Glitman, K., and Roberts, D. (2014). Forecasting
demand of public electric vehicle charging infrastruc-
ture. In Technologies for Sustainability, 2014 IEEE
Conference, pages 250–254.
Sweda, T. and Klabjan, D. (2011). An agent-based deci-
sion support system for electric vehicle charging in-
frastructure deployment. In 2011 IEEE Vehicle Power
and Propulsion Conference, pages 1–5.
Tu, W., Li, Q., Fang, Z., Shaw, S.-l., Zhou, B., and Chang,
X. (2015). Optimizing the locations of electric taxi
charging stations: A spatial–temporal demand cov-
erage approach. Transportation Research Part C:
Emerging Technologies, pages –.
Xi, X., Sioshansi, R., and Marano, V. (2013). Simulation–
optimization model for location of a public electric
vehicle charging infrastructure. Transportation Re-
search Part D: Transport and Environment, 22:60–69.
Yi, Z. and Bauer, P. H. (2014). Spatio-Temporal Energy
Demand Models for Electric Vehicles. In 2014 IEEE
Vehicle Power and Propulsion Conference (VPPC),
pages 1–6.
ICORES 2017 - 6th International Conference on Operations Research and Enterprise Systems
368
