
A Robust Method for Blood Vessel Extraction in Endoscopic Images with
SVM-based Scene Classification
Mayank Golhar
1
, Yuji Iwahori
2
, M. K. Bhuyan
1
, Kenji Funahashi
3
and Kunio Kasugai
4
1
Indian Institute of Technology Guwahati, 781039, Guwahati, India
2
Chubu University, 487-8501, Kasugai, Japan
3
Nagoya Institute of Technology, 465-8555, Nagoya, Japan
4
Aichi Medical University, Nagakute, 480-1195, Japan
mayankgolhar@gmail.com, iwahori@cs.chubu.ac.jp, mkb@iitg.ernet.in, kenji@nitech.ac.jp, kuku3487@aichi-med-u.ac.jp
Keywords:
Endoscopy, Scene Classification, SVM, Blood Vessel, Frangi Vesselness.
Abstract:
This paper proposes a model for blood vessel detection in endoscopic images. A novel SVM-based scene
classification of endoscopic images is used. This SVM-based model classifies images into four classes on
the basis of dye content and blood vessel presence in the scene, using various colour, edge and texture based
features. After classification, a vessel extraction method is proposed which is based on the Frangi vessel-
ness approach. In original Frangi Vesselness results, it is observed that many non-blood vessel edges are
inaccurately detected as blood vessels. So, two additions are proposed, background subtraction and a novel
dissimilarity-detecting filtering procedure, which are able to discriminate between blood vessel and non-blood
vessel edges by exploiting the symmetric nature property of blood vessels. It was found that the proposed
approach gave better accuracy of blood vessel extraction when compared with the vanilla Frangi Vesselness
approach and BCOSFIRE filter, another state-of-art vessel delineation approach.
1 INTRODUCTION
Detection and analysis of blood vessels plays a major
role in medical diagnosis in large number of areas like
retinopathy, endoscopy etc. The detection and analy-
sis of retinal blood vessels may lead to early diagnosis
and prevention of diseases, such as diabetic retinopa-
thy, a leading cause of blindness. Similarly, in case
of blood vessels lining the colon wall, changes in the
shape and structure of blood vessels are symptoms of
various diseases. In inflammatory bowel diseases like
Crohn’s disease and Ulcerative Colitis, there is an in-
crease in size of vessels. Whereas, a decrease in the
size of vessels causes reduced blood supply, leading
to Ischemic bowel disease like Ischemic Enterocolitis
(Kumar et al., 2014).
While a plethora of blood vessel extraction algo-
rithms are available for retinal images (Fraz et al.,
2012), such is not the case with endoscopic images.
There are some generic segmentation methods which
could be used for endoscopic blood vessel detection,
but they are not very accurate due to special con-
ditions encountered in endoscopic images like high
specular reflection, non-blood vessel patterns, de-
formable colon walls etc. Thus, this paper proposes
a novel algorithm for blood vessel extraction specific
for endoscopic images.
Initially, classification of images into four classes
based on whether they contain ink, and whether they
contain blood vessels is done using SVM. To the best
of our knowledge, this is the first instance of such
type of classification been done for endoscopic im-
ages. Classification of tumor in endoscope images
has been attempted using pit pattern features (Hafner
et al., 2007). But this is applicable only for magni-
fied endoscopic images focused on tumor, whereas
the method proposed, performs classification using
higher level features encompassing the complete im-
age information. Section 2.1 discusses the proposed
classification process in detail.
In (Lin et al., 2015), colon wall’s blood vessels’
branching points and branching segments are consid-
ered as features. Their approach is based on Frangi
vesselness (Frangi et al., 1998) for blood vessel de-
tection. This is followed by Ridgeness-based Circle
Test and Ridgeness-based Segment Test for detect-
ing branching points and branching segments respec-
tively. But their algorithm fails to discriminate be-
tween blood vessel edges and edges from structures
148
Golhar, M., Iwahori, Y., Bhuyan, M., Funahashi, K. and Kasugai, K.
A Robust Method for Blood Vessel Extraction in Endoscopic Images with SVM-based Scene Classification.
DOI: 10.5220/0006192601480156
In Proceedings of the 6th International Conference on Pattern Recognition Applications and Methods (ICPRAM 2017), pages 148-156
ISBN: 978-989-758-222-6
Copyright
c
2017 by SCITEPRESS – Science and Technology Publications, Lda. All rights reserved
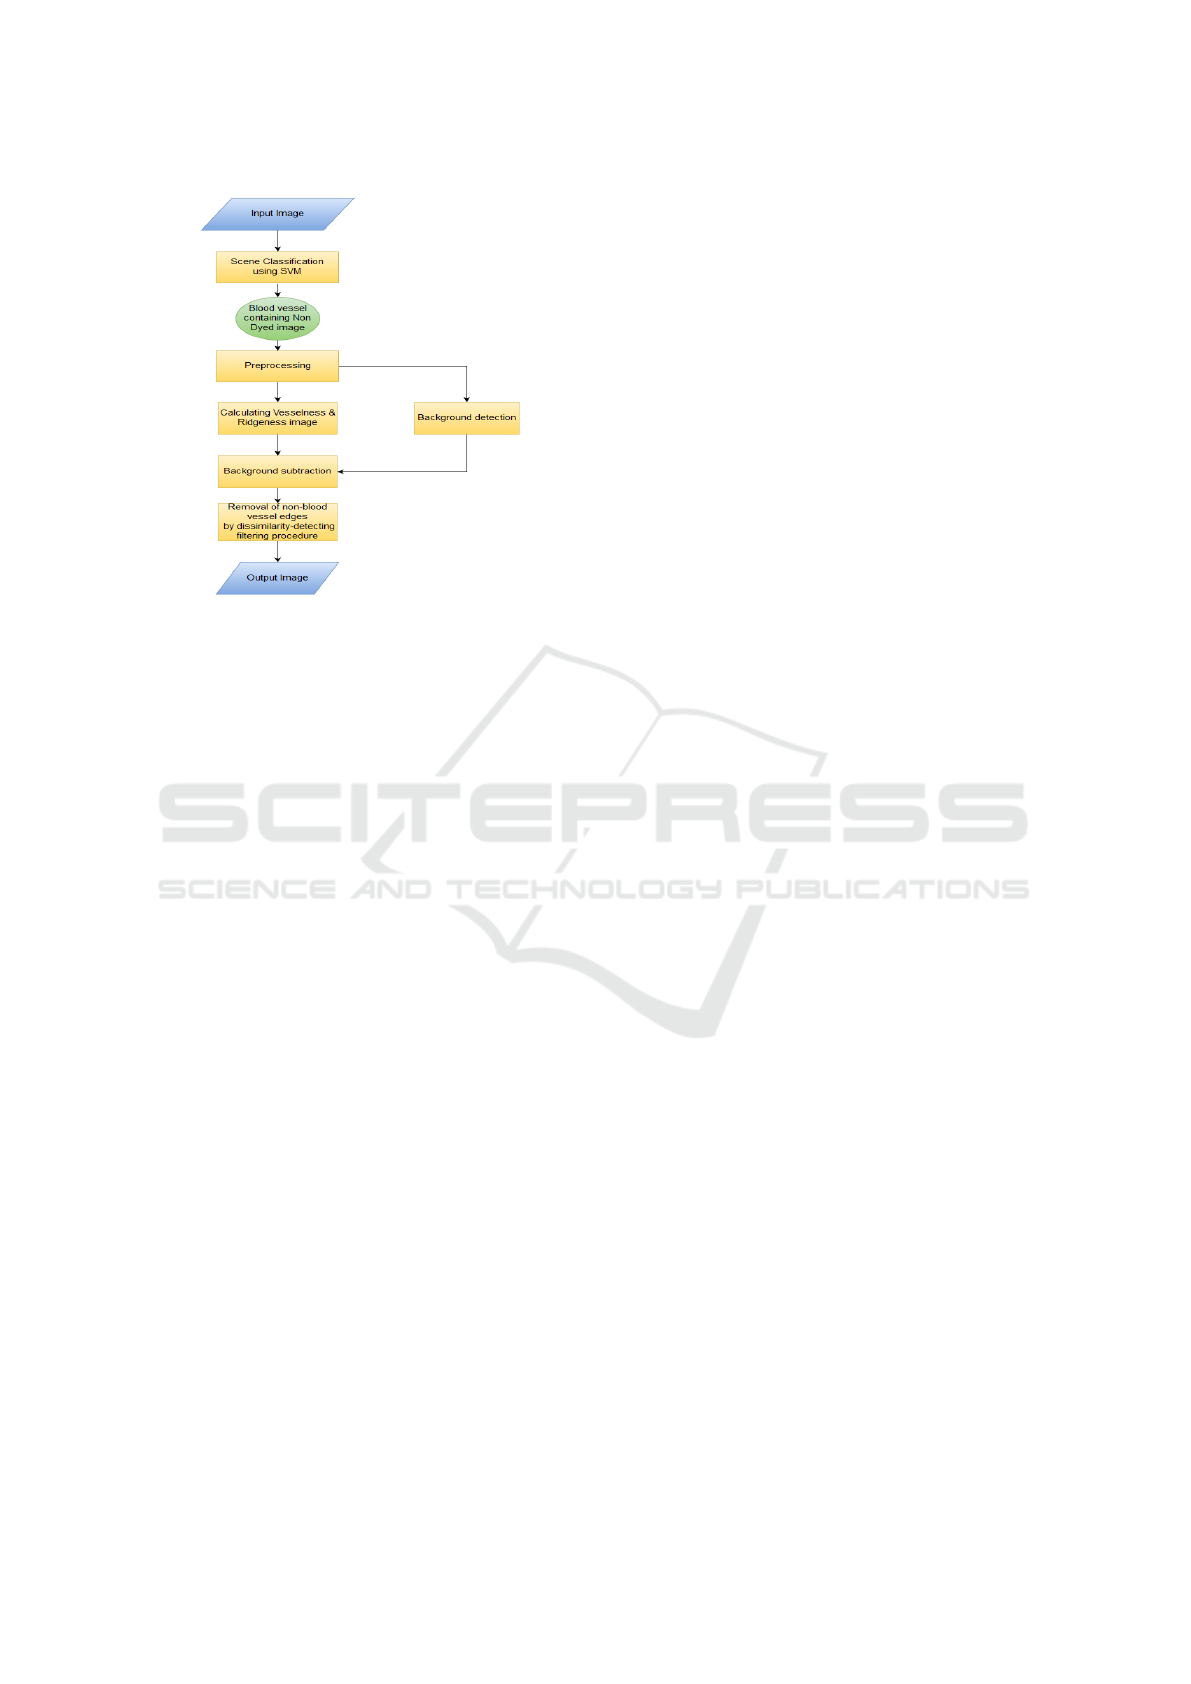
Figure 1: Overview of proposed blood vessel extraction al-
gorithm.
like folds of colon wall, polyp etc. which results in
many inaccurate feature points. Thus this paper over-
comes these inaccuracies by proposing a collection of
techniques to remove the edges obtained from non-
blood vessel structures, like dark background subtrac-
tion and dissimilarity detecting filtering procedure.
The classification and filtering procedure proposed
are invariant to orientation, scaling and illumination.
Details about these are given in Section 2.3 and 2.4.
2 PROPOSED METHOD
An over view of the approach is shown in the Fig.
1. Initially, scene based classification is done to de-
termine whether the image contains blood vessel in-
formation or not. Then, the selected input image is
pre-processed to remove specular components. After
this step, the blood vessel extraction process begins.
The Frangi vesselness and ridgeness image are then
calculated. Further, background subtraction is done.
In the final step, non-blood vessel edges are identified
using dissimilarity-detecting filtering procedure and
then removed from Vesselness image to give the final
output image. These steps are expounded in following
sections.
2.1 Scene-based Classification
2.1.1 Motivation
It is observed that an endoscopic video sequence
has an assortment of scenes like frames in which
blood vessels are present, frames in which colon is
marked with ink with presence or absence of blood
vessels, frames with presence or absence of polyps,
frames in which the process of tattooing(dyeing) is
progress, frames where polyp is been surgically re-
moved, frames where the colon is been washed with
medicinal liquid, camera transition from one region
of colon to another, scenes containing no clinical in-
formation etc. Dyeing, the process of marking colon
with ink, is done in colonoscopy for the better visual-
isation of polyps and marking smaller polyps for fu-
ture diagnosis.
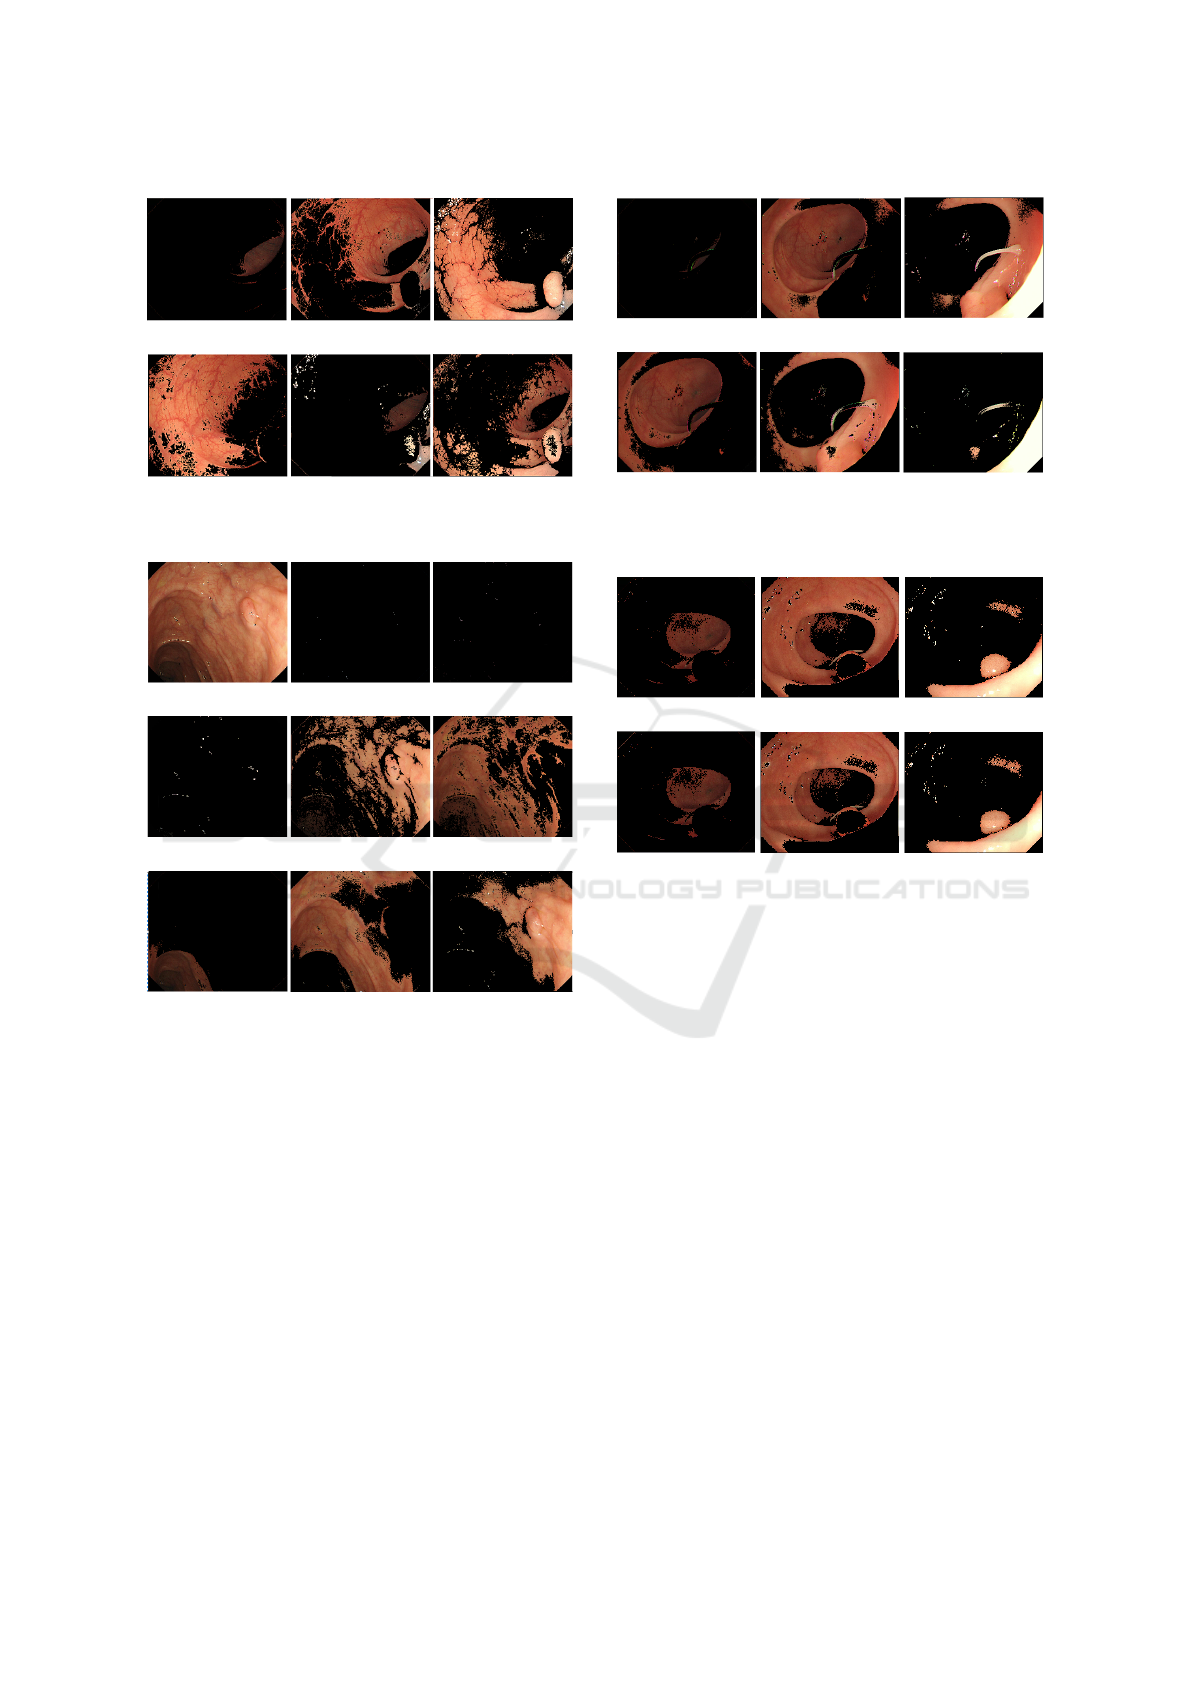
For the purpose of blood vessel extraction, this
multitude of scenes can be broadly divided into four
major categories which are as follows:
Class 1 : Blood vessel containing non-dyed images.
Class 2 : No blood vessel containing non-dyed im-
ages.
Class 3 : Blood vessel containing dyed images.
Class 4 : No blood vessel containing dyed images.
This classification is necessary as different classes
require different blood vessel delineation techniques.
This is due to many factors, e.g. in the dyed im-
age classes there is added specularity because of ink
liquid, ink pattern texturally similar to vessel pattern
leading to detection of false blood vessels etc. How-
ever, in this paper we will be focusing on the treat-
ment of non-dyed images containing blood vessels
only. Blood vessel extraction from ink images is a
topic of future work. Representative images for vari-
ous classes are shown in Fig 2.
2.1.2 Methodology
With an aim to make classification robust, but not
computationally intensive, Support Vector Machine
as classifier was used. As SVM is a binary classi-
fier and we have total four classes, One V/s One clas-
sification was used. As shown in Section 3.1, it was
found that the cubic kernel gave the best classification
result.
The major challenge was to define the feature vec-
tor which could help differentiate between images of
the specified classes. For feature selection, (Mohanty
et al., 2013) and (Zhang et al., 2000) were referred.
The feature vector was defined on the basis of the fol-
lowing three criteria:
1. Colour-based Features. These features are used
to differentiate between the non-ink images(more
red component) and ink images (more blue com-
ponent). For every color, the 10 - bin first order
histogram values, the mean, variance, skew, en-
ergy and entropy are used as features. Thus, the
A Robust Method for Blood Vessel Extraction in Endoscopic Images with SVM-based Scene Classification
149

(a) Blood vessel containing
non-dyed image - Class 1
(b) No blood vessel contain-
ing non-dyed image - Class 2
(c) Blood vessel containing
dyed image - Class 3
(d) No blood vessel contain-
ing dyed image- Class 4
Figure 2: Representative images of Classes 1 to 4.
total number of colour-based features used were
45.
2. Edge-based Features. The Canny edge opera-
tor is used on every channel for getting the gra-
dient magnitude and direction. For every color,
10 - bin histogram values, the mean, variance,
skew, energy and entropy derived from gradi-
ent magnitude are used as features. A his-
togram of directional angles with central bin
values {−90
◦
,−45
◦
,0
◦
,45
◦
,90
◦
} is constructed.
The histogram bin counts, the mean, variance,
skew, energy and entropy obtained from direc-
tional angle values are also used as features. The
total number of edge-based features used were 75.
3. Texture-based Features. To differentiate be-
tween the blood vessel and non-blood vessel con-
taining classes, the following features are pro-
posed. Image is first converted to grayscale and
then :
(a) The Fast Fourier Transform (FFT) transform of
the image is calculated. The mean, variance,
skew, energy, entropy of the FFT and grayscale
images are used as features. Also the range of
each column of grayscale image is used as fea-
ture.
(b) A gabor filter bank is created, with fil-
ters having different wavelengths and orienta-
tions. The orientations of gabor filter used are
{0
◦
,45
◦
,90
◦
,135
◦
} and wavelengths increas-
ing exponential, in range [2
√
2, Hypotenuse of
image]. For each filtered image, the 10 - bin
histogram values, the mean, variance, skew, en-
ergy and entropy are used as features. The total
number of texture-based features were 210.
2.2 Blood Vessel Extraction
One of the major challenges while working with en-
doscopic images is the abundant specular reflection.
For removing specular reflection the method proposed
by (Ikeda et al., 2016) was used. It is to be noted
that the regions identified as specular reflections were
treated as no information regions. The proposed
method is based on approach described in the pa-
per (Lin et al., 2015). The Frangi vesselness image,
which identifies the vessel edges, is obtained using
the algorithm suggested in (Frangi et al., 1998). The
ridgeness image is a form of skeletonised version of
the vesselness image, whose approach is described in
(Lin et al., 2015). In the results of these approaches,
many non-blood vessel edges were inaccurately iden-
tified as blood vessels. For the completeness of paper,
their approach is briefly summarized as follows:
1. Pre-Processing
(a) Extract only green channel of image as it gives
best contrast between vessels and background.
(b) Convert to scale space model.
(c) Calculate Hessian matrix for each point.
(d) Calculate the eigenvalue and eigenvector for
each point from Hessian matrix. The eigenval-
ues obtained are say λ
1
and λ
2
. The points hav-
ing λ
1
- Medium value and λ
2
- High value are
considered as a candidates of blood vessels.
2. Blood vessel enhancement
(a) Parameter ridgeness is defined as
Ridgeness(x,y,σ)
= Vesselness(x, y, σ).abs{
sign(∇I(x + εu
2
,y + εv
2
,σ))
−sign(∇I(x − εu
2
,y − εv
2
,σ))}/2,
(1)
Vesselness(σ) =
exp(
λ
2
1
/λ
2
2
2β
2
)(1
− exp(
−(λ
2
1
+ λ
2
2
)
2c
2
))
(2)
where in the ridgeness formula u
2
and v
2
are the
x and y components of the eigenvector pointing
ICPRAM 2017 - 6th International Conference on Pattern Recognition Applications and Methods
150
in the direction perpendicular to that of blood
vessel. In the vesselness formula, β and c are
soft thresholds. Ridgeness for all the candidate
points are calculated. Thereafter, the pixels
which have local maximum are only retained.
(b) The result of this step is that we obtain sin-
gle pixels width ridges (representative of blood
vessel skeleton). Background noise is also re-
moved.
The further approach, which is the novelty of the
paper, aims at removing these non-blood vessel edges
from the extracted results image.
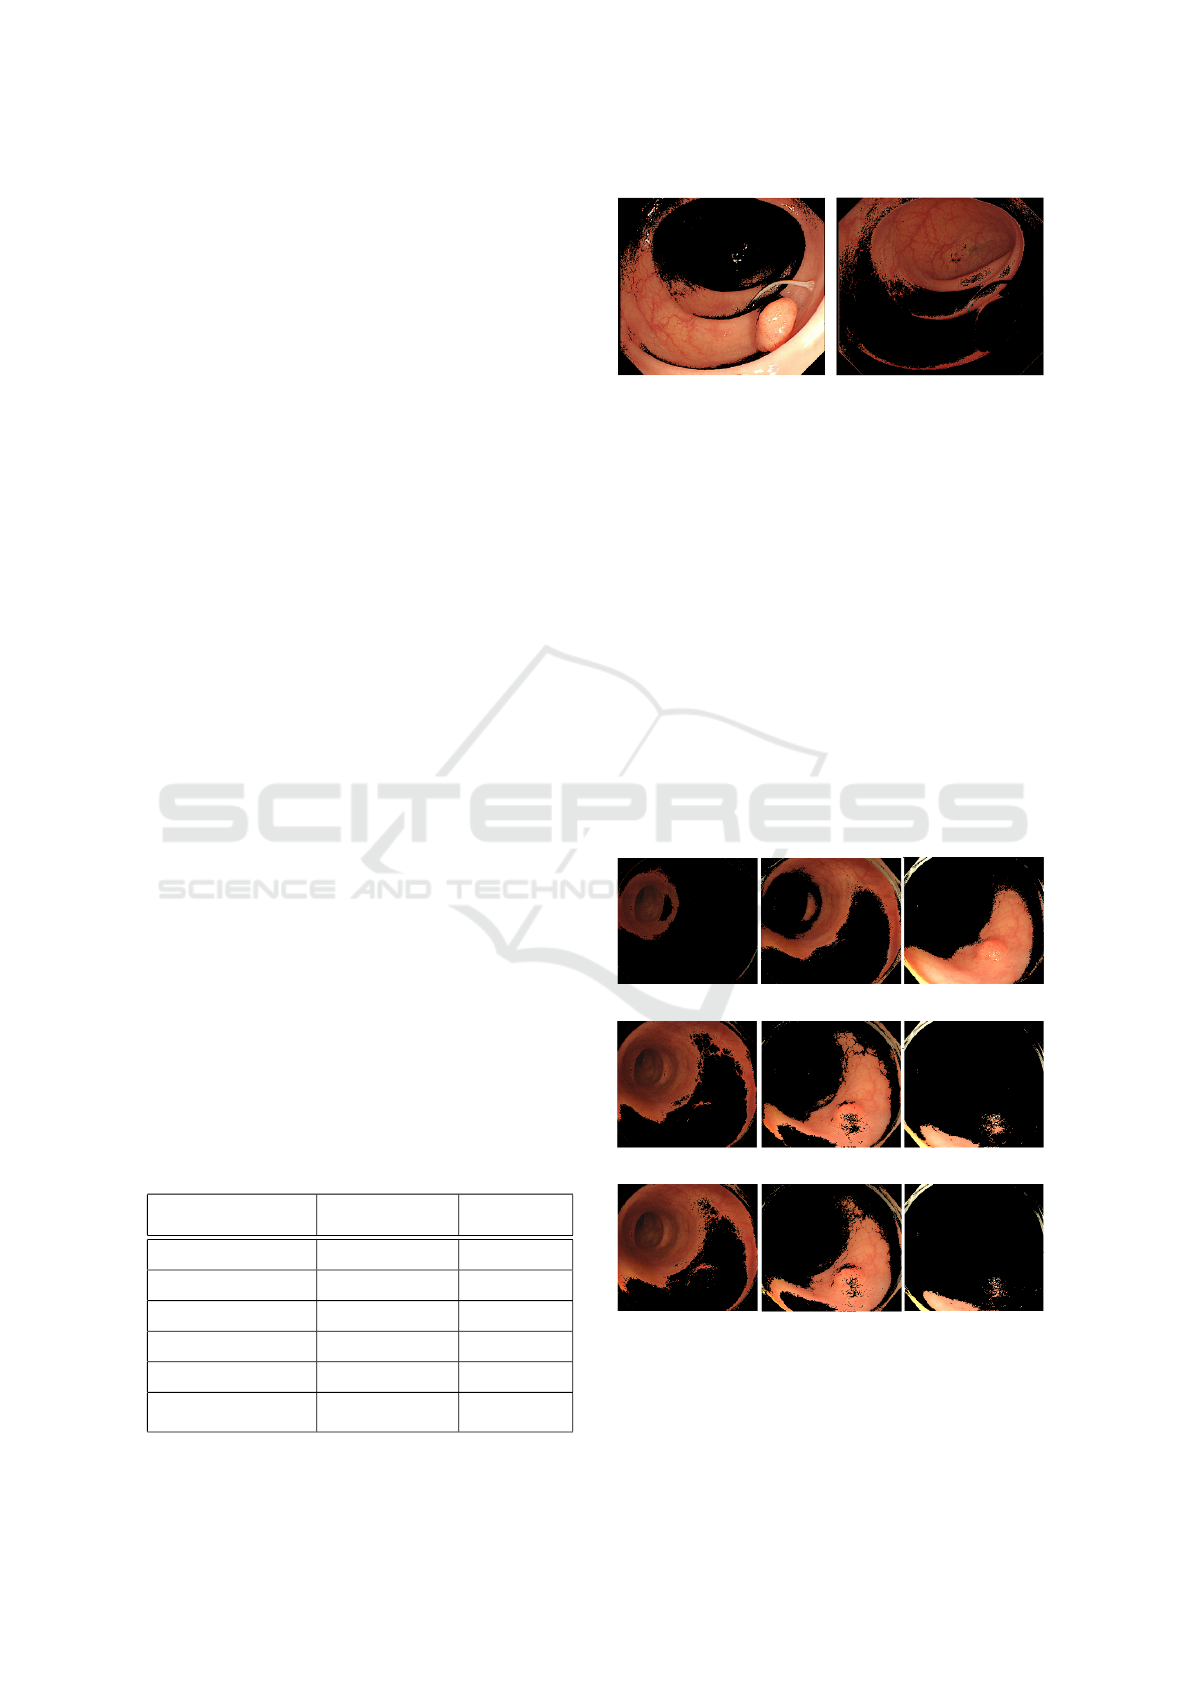
2.3 Background removal
2.3.1 Source of Error
In images where the endoscope camera is perpendic-
ular to the walls of colon, the result of blood vessel
extraction is acceptable. But, when the image is cap-
tured where the endoscope camera is parallel to the
colon wall, there is dark background in the image,
where false noisy edges are detected as blood vessels,
as shown in Fig. 3. To remove this error, an attempt
is made to segment dark background region from the
foreground.
2.3.2 Methodology
Several approaches were tried to segment the back-
ground from foreground namely, Otsu’s single level
thresholding, k-means clustering and Otsu’s multi
level thresholding, each of which were tested on the
three colour channels. As the results show, the Otsu’s
multi-level thresholding using two thresholds using
Red channel is the best, among all investigated meth-
ods, for dark background segmentation in endoscopic
images. As we are thresholding using two thresholds,
we get three clusters among which, the region with
the lowest intensity is considered as the dark back-
ground region whereas the other two are considered
as foreground.
In images captured by camera with orientation
parallel to the wall of colon, it was observed that
the image can be divided into three different regions
based on illumination. The region close to the camera
was brightly illuminated, moderate illumination was
found in the mid range region and far away region was
poorly illuminated. Hence, the results were found to
be better when partitioning was done into three clus-
ters. The close by and mid range regions were found
to contain useful clinical information and were hence
retained, whereas the faraway region, due to lack of il-
lumination did not contain much useful interpretable
information and hence was discarded.
(a) Original image (b) Vessel image
Figure 3: Noisy edges in dark background region identified
as blood vessels.
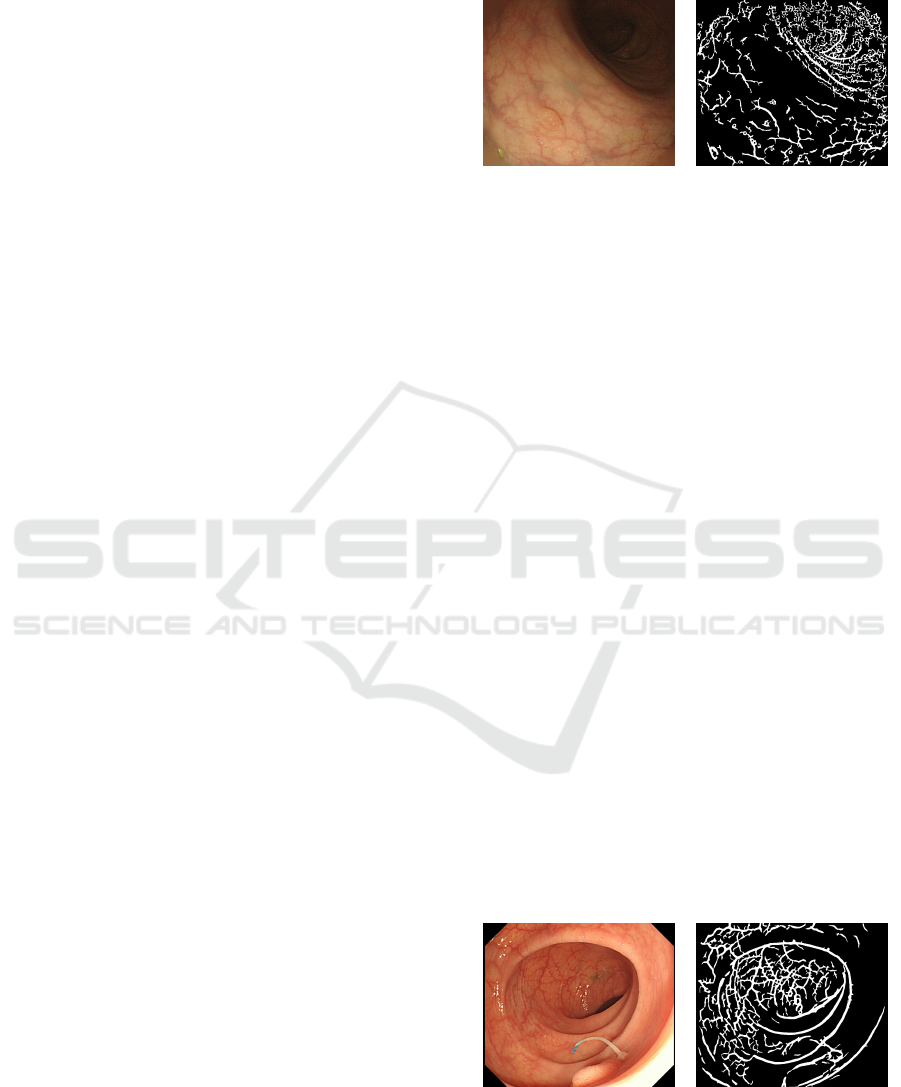
2.4 Removing Non-blood Vessel Edges
2.4.1 Source of Error
In the vesselness image, it is found that along with
blood vessels, many ridges or folds of colon walls,
polyp edges and specular reflections are also erro-
neously identified as blood vessel. This section dis-
cusses a method to identify and remove ridges, folds
of walls and specular components from the result
of extracted edges. Vesselness image which con-
tains ridges, polyp edges and specular components is
shown in Fig. 4.
2.4.2 Motivation
In endoscopic image, the edges obtained from blood
vessel and those from other components like ridges,
specular components and polyp edges are fundamen-
tally different, if the intensities of the neighborhood
regions of these edges are considered. The differences
are as follows:
• Blood Vessel. If a window is drawn around the
blood vessel with center line of blood vessel di-
viding the window into two halves as shown in
Fig. 5a, it is generally observed that the intensi-
ties of both halves of window are similar.
(a) Original image (b) Extracted edges
Figure 4: The ridges of inner walls, polyp and medical su-
ture have been erroneously extracted as blood vessels in
vesselness image.
A Robust Method for Blood Vessel Extraction in Endoscopic Images with SVM-based Scene Classification
151
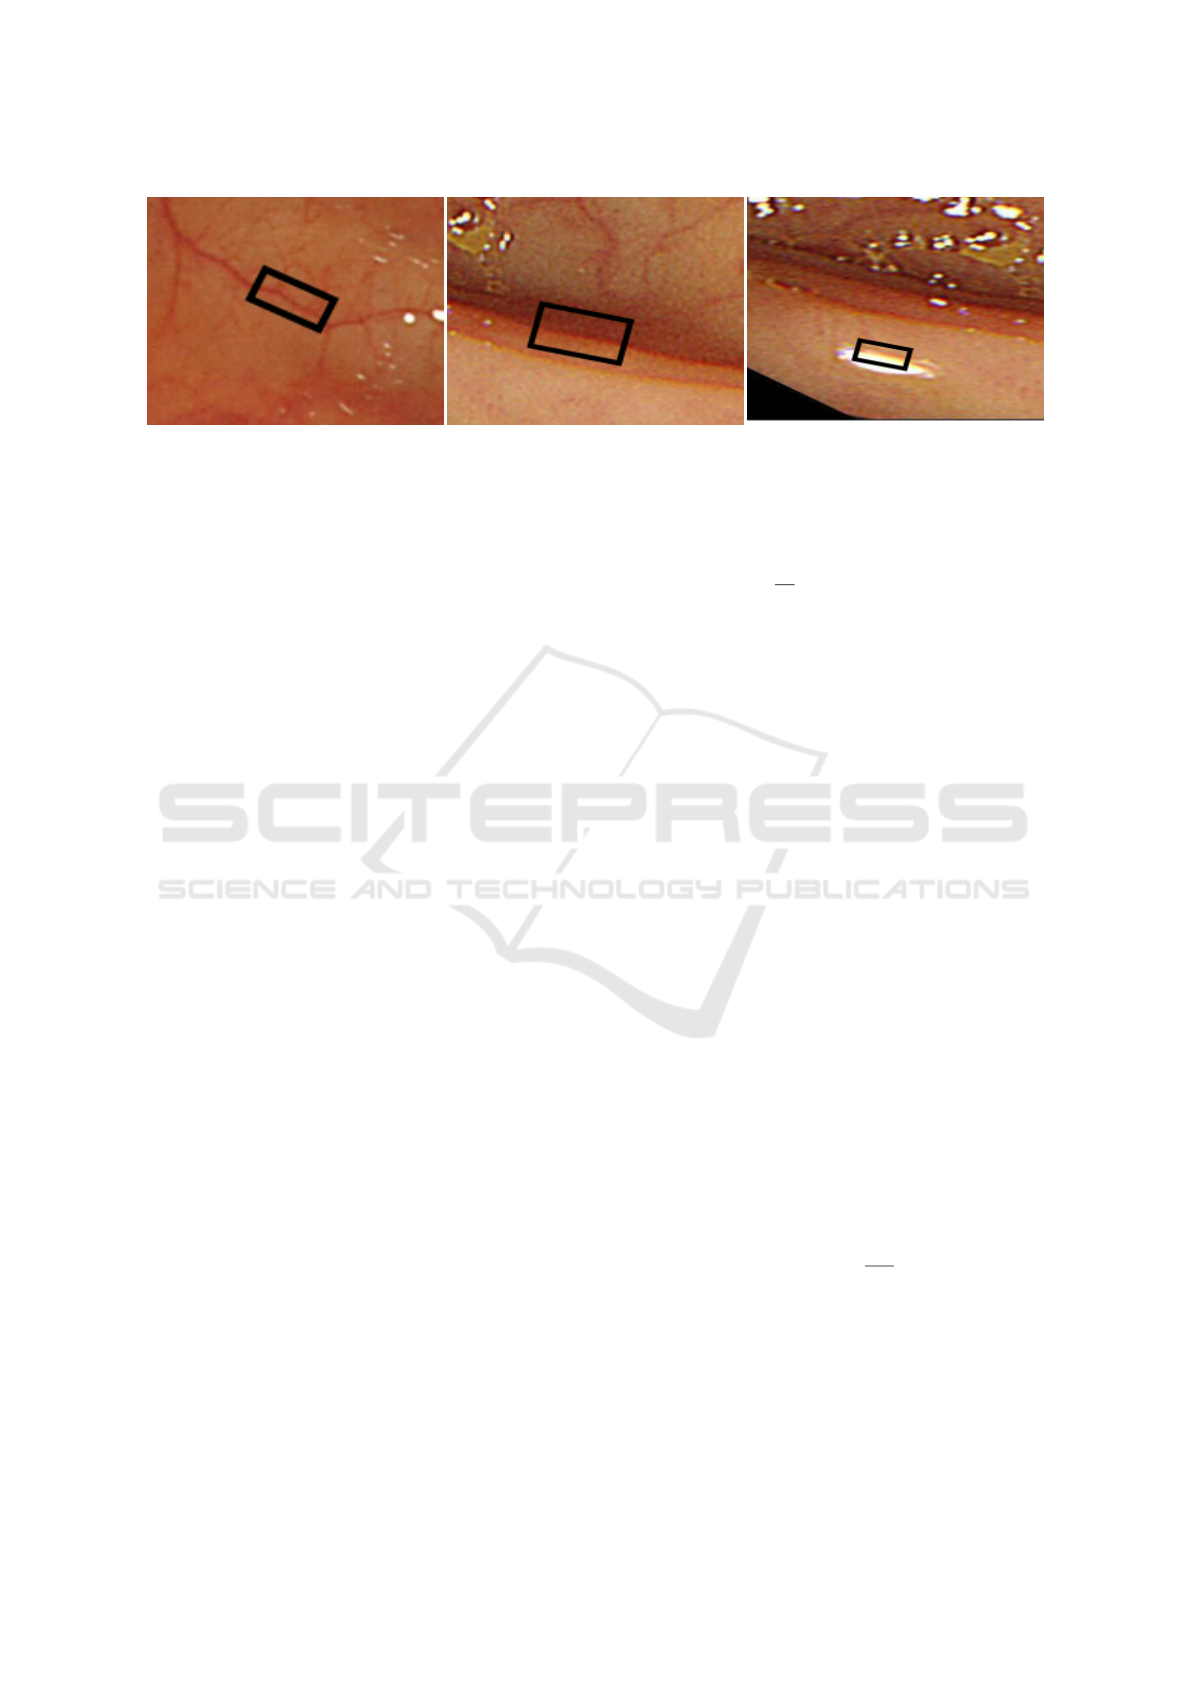
(a) Window around blood vessel (b) Window around ridge (c) Window around specular component
Figure 5: Windows around various structures, showing the differences in intensity in the two halves of window.
• Ridges, Polyp Edges and Specular Compo-
nents. If a similar window is drawn is around the
edge of a ridge or polyp or specular component
i.e. a window placed such that the center line of
the window is on the edge of the ridge, thereby di-
viding the window into two halves, it is generally
observed that intensity-wise these two halves are
very dissimilar. Generally, one half is darker and
other half is brighter as shown in Fig. 5b and 5c.
Also, it is observed that the vesselness value of
ridges and specular reflection is higher than that
of most of the blood vessels.
2.4.3 Overview of the Approach
Based on the above motivation, the intensity differ-
ence of the two halves of the window is exploited to
identify whether the extracted edge is a blood vessel
or not. So, a custom intensity-based dissymmetry de-
tecting filter is proposed. The proposed approach is
as follows:
1. An initial thresholding on the basis of vesselness
value is done to identify the strong non-blood ves-
sel edges. This generally discards most of the
blood vessels, but not all. After thresholding,
the edges which remain are generally from ridges,
specular components, polyps and some blood ves-
sels.
2. The edges obtained above are then processed to
find their center lines. The center lines of the
edges can be obtained by ridgeness values.
3. After obtaining the center lines of the edges, the
custom intensity-based dissymmetry detection fil-
tering is done. The custom filter is a rotating fil-
ter, oriented in the direction of blood vessel. The
direction of blood vessel is given by the minor
eigenvector of the Hessian matrix at the point of
filtering. In other words, the rotating filter is ori-
ented such that the center line of the filter coin-
cides with the center line of the edge.
f (i, j) = rotate
θ
1
25
−1 −1 −1 −1 −1
−1 −1 −1 −1 −1
0 0 0 0 0
1 1 1 1 1
1 1 1 1 1
(3)
where θ is the direction of the minor eigenvec-
tor, which is along the direction of edge. Another
point to be noted is that, due to lack of space the
filter size shown is 5 ×5 pixels but in actual im-
plementation window size of 20 ×20 pixels was
used.
4. The filter is placed along the the center line of the
edge. The image used for filtering is the Gaus-
sian smoothened red channel of the original im-
age. The filter effectively finds the sum of inten-
sities values of all pixels lying in each half of the
filter, and returns the absolute difference of these
two halves sum-of-intensities.
g(i, j) =
n
abs|f (i, j) ∗x(i, j)| if x(i, j) ∈Centerline
0 otherwise.
(4)
where f (i, j) is the custom filter, x(i, j) is the
gaussian filtered original image’s red channel and
g(i, j) is the filtered image.
5. The average of all the filtered values of the center
line pixels lying inside an edge, is calculated. This
average value, termed as Dissymmetry Index, is
then assigned to the respective edge. Mathemati-
cally, Dissymmetry index of the k
th
edge is given
by
Dissymmetry index(k) =
1
|S
k
|
∑
g(i, j)∈S
k
g(i, j) (5)
where S
k
is the set of all pixels of filtered image
belonging to the k
th
edge. |S
k
| is the total number
of pixels belonging to the k
th
edge.
6. The edges which have Dissymmetry index above
certain threshold, indicating they have contrasting
halves, are labeled non-blood vessel edges.
ICPRAM 2017 - 6th International Conference on Pattern Recognition Applications and Methods
152
7. The steps 4 to 7 are repeated but, this time the
green channel of the original image is used for fil-
tering. This is done, as it is found that some non-
blood vessel edges are better detected by the red
channel and some by green channel.
8. The results obtained from the red and green chan-
nel are then OR’ed and the resulting image gen-
erally consists of mostly ridges and specular com-
ponents and other non-blood vessel edges.
9. The OR’ed image is then subtracted from the ex-
tracted edges and thus final result is obtained,
which consists mostly of blood vessels.
3 EXPERIMENTS AND RESULTS
3.1 Scene Classification
For the purpose of scene classification, Support vec-
tor machine (SVM) model was used. Classification of
image into the aforementioned four classes was done.
The data set comprised of a total of 513 images with
71, 141, 111 and 190 in Classes 1, 2, 3 and 4 respec-
tively. For ground truth, data set images were manu-
ally classified by visual inspection into the classes.
Different kernels were experimented with, to find
out which gave the best results. Linear, quadratic,
cubic, fine Gaussian, medium Gaussian and coarse
Gaussian kernels were used. The results obtained for
the kernels are shown in Table 1. The One versus
One classification was used as it gave comparatively
better results than One versus All classification. For
measuring the predictive performance of the statisti-
cal model, 10 - fold cross validation was done.
The One Vs One SVM with cubic kernel gave
the best result. Instead of cubic kernel, quadratic ker-
nel can also be used as the accuracy of the learning al-
gorithm was found to be similar and it takes less com-
putation time. It was observed that if dimensionality
Table 1: Accuracy using different kernels.
Kernel
Accuracy
(without PCA)
Accuracy
(post PCA)
Linear 81.1% 77 %
Quadratic 84.8 % 78.4%
Cubic 85.4 % 78.4%
Fine Gaussian 39.4 % 38.4%
Medium Gaussian 82.5 % 71.3%
Coarse Gaussian 57.7 % 37%
Figure 6: Adaptive single threshold based clustering did not
give acceptable result.
reduction is done using Principal component analysis
(PCA), the accuracy fell by 5-7% even if the variance
retained is 99%. The post PCA results are shown in
the Table 1.
3.2 Background Removal
To achieve the goal of background removal, various
approaches were tried. A discussion on the method-
ologies used is given below:
1. Adaptive Thresholding using Otsu’s method :
Single threshold : First a single global thresh-
old is found using Otsu’s method, which tires to
minimize the intra-class variance. The results of
segmentation using a single threshold were not ac-
curate in many images. An example image where
it failed is shown in Fig. 6
(a) Result of clustering using Red channel values
(b) Result of clustering using Green channel values
(c) Result of clustering using Blue channel values
Figure 7: Results of K-means clustering using RGB.
2. K-means Clustering. To segment the dark back-
ground from the foreground region, pixel classi-
A Robust Method for Blood Vessel Extraction in Endoscopic Images with SVM-based Scene Classification
153
(a) Result of clustering using L* component
(b) Result of clustering using a*b component
Figure 8: Results of K-means clustering using Lab.
(a) Result of clustering using Hue component
(b) Result of clustering using Saturation component
(c) Result of clustering using Value component
Figure 9: Results of K-means clustering using HSV.
fication using k-means clustering was done. K-
means clustering was tried using various color
space like RGB, CIE-Lab color space and the var-
ious channels in these color spaces. Comparison
is done to find out which channel of which color
space gives the best performance of segmentation.
K-means clustering was done into three clusters
using initial seeds as 0.1, 0.5 and 0.75.
(a) Comparison between R, G and B color chan-
nels : The following segmentation was ob-
served, when for clustering the Red, Green or
Blue channel were used separately. Compari-
son is shown in Fig 7. It was found that Red
color channel gave the best results for segmen-
tation in most cases.
(b) Comparison between L* and a*b* color chan-
(a) Result of clustering using Red component
(b) Result of clustering using L* component
Figure 10: K-means clustering result comparison of Red
and L* components.
(a) Result of K-means clustering
(b) Result of Adaptive thresholding using Otsu’s method
with 2 thresholds
Figure 11: K-means clustering and Adaptive thresholding
using Otsu’s method with 2 thresholds gave similar results.
nels : The L*a*b* color space is derived from
the CIE XYZ tristimulus values. The L*a*b*
space consists of a luminosity ’L*’ or bright-
ness layer, chromaticity layer ’a*’ indicating
where color falls along the red-green axis, and
chromaticity layer ’b*’ indicating where the
color falls along the blue-yellow axis. Com-
parison between L* and a*b* space is shown
in Fig. 8. The best segmentation was done by
using L* channel.
(c) Comparison between H, S and V channels : A
comparison of k-means clustering is done be-
tween the H, S and V channels, as shown in
Fig.9. It was observed that V channel of the
image gave the best results. It’s clustering re-
sult was similar to the R channel.
(d) Comparison between R and L* color channels
: Among the RGB and CIE Lab color space the
best result was observed using the ‘R’ and ‘L*’
channels. So, a comparison is further made be-
ICPRAM 2017 - 6th International Conference on Pattern Recognition Applications and Methods
154
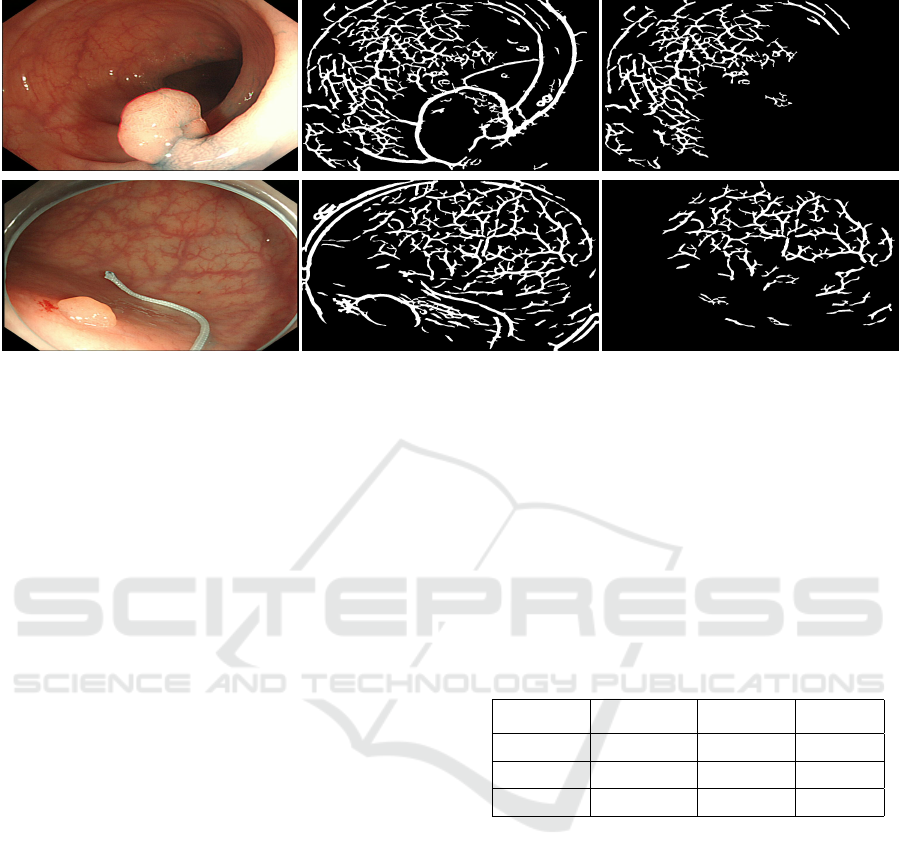
(a) Original Image (b) Vesselness image (c) Final Result
Figure 12: Comparison of input, vesselness and final result.
tween them, as shown in Fig. 10. It was found
that using the R channel gave best results.
(e) Adaptive Thresholding using Otsu’s Method us-
ing 2 Thresholds : Multilevel thresholding us-
ing the Otsu’s method was done using R chan-
nel and 3 clusters were obtained . The results
obtained by Otsu’s multi-level thresholding and
k-means clustering were found to be almost the
same, as shown in Fig. 11.
As the results of k-means clustering and Otsu’s 2
level adaptive thresholding were almost the same, and
Otsu’s thresholding is faster, it can be concluded that
Otsu’s multi-level thresholding using two thresholds
on R channel is the best, among all investigated meth-
ods, for dark background segmentation in endoscopic
images. Also, it was observed that in images where
there are no dark regions the clustering was done au-
tomatically into two clusters.
3.3 Removal of Non-blood Vessel Edges
The proposed method removes the non-blood vessel
edges by using two approaches. It removes the back-
ground region, thereby eliminating the false edges
which occur due to image noise. Second, an Dissim-
ilarity Index is used to categorise whether the given
edge came from a blood vessel or not.
A dataset of 61 images was used for evaluation.
For ground truth, the blood vessel were manually
marked in all the images. The values of various
thresholds used in evaluation are : Strong edge vessel-
ness threshold = 0.9, Red Channel-Dissimilarity In-
dex threshold = 3 and Green Channel-Dissimilarity
Index threshold = 3. These values were found to give
the best result empirically. The comparison of various
algorithms’ results is shown in Table 2.
It is observed that the proposed method gave much
better result than BCOSFIRE filter (Azzopardi et al.,
2015), a popular technique in vessel delineation, by
around 50% in terms of sensitivity. The overall accu-
racy of the proposed method is around 5% better than
the BCOSFIRE result.
Table 2: Comparison of results of various vessel delineation
methods.
BCOSFIRE
Frangi’s
Vesselness
Proposed
Method
Sensitivity 20.22% 75.24% 71.77 %
Specificity 93.65 % 86.16% 94.57 %
Accuracy 88.68% 85.42% 93.03%
The results were also compared with Frangi’s ves-
selness method on which the proposed method is
based. The overall accuracy and specificity of the pro-
posed method was found to be better by 8%. This is
the result of the proposed method’s focus on remov-
ing falsely identified edges as blood vessel edges. The
sensitivity of Frangi’s method was better by around
3.5%. This is because the proposed method while re-
moving false edges sometimes also removed a few
true edges. This is acceptable as our final aim is to
obtain accurate blood vessel information. So, our ef-
fort is oriented towards minimizing information from
false blood vessel edges, and in this process it is tol-
erable to lose some true blood vessels as this blood
vessel information can also be obtained from other
identified blood vessels. Illustrative images with re-
sults improved by the proposed method are shown in
Fig. 12.
A Robust Method for Blood Vessel Extraction in Endoscopic Images with SVM-based Scene Classification
155

4 CONCLUSION AND FUTURE
WORK
The paper proposed a novel method for scene classi-
fication for endoscopic images into classes, based on
ink and blood vessel content using SVM with Cubic
kernel. The features were based on colour, edges in-
formation and texture. The blood vessel containing
non-dyed images were used for blood vessel extrac-
tion. The blood vessel extraction process is based on
the Frangi vesselness filter. The originality added by
the proposed method lies in its ability to differentiate
the edges extracted by Frangi filter into blood vessel
and non-blood vessel edges. The proposed algorithm
achieves this aim by doing background subtraction
and filtering using a custom intensity-based dissym-
metry detection filter. Blood vessel delineation for
dyed images is a topic of future work. Another work
is to apply this research to 3D recovery of polyp with
absolute size and shape for supporting medical image
diagnosis.
ACKNOWLEDGEMENT
This research was done while Mayank Golhar visited
Iwahori Lab. of Chubu University for his research
internship. Iwahori’s research is supported by JSPS
Grant-in-Aid for Scientific Research (C) (#26330210)
and (B) (#15H02768), and Chubu University Grant.
REFERENCES
Azzopardi, G., Strisciuglio, N., Vento, M., and Petkov, N.
(2015). Trainable cosfire filters for vessel delineation
with application to retinal images. Medical image
analysis, 19(1):46–57.
Frangi, A. F., Niessen, W. J., Vincken, K. L., and Viergever,
M. A. (1998). Multiscale vessel enhancement fil-
tering. In International Conference on Medical Im-
age Computing and Computer-Assisted Intervention,
pages 130–137. Springer.
Fraz, M. M., Remagnino, P., Hoppe, A., Uyyanonvara, B.,
Rudnicka, A. R., Owen, C. G., and Barman, S. A.
(2012). Blood vessel segmentation methodologies in
retinal images–a survey. In Computer methods and
programs in biomedicine, Vol. 108(1), pp. 407-433.
Elsevier.
Hafner, M., Gangl, A., Wrba, F., Thonhauser, K., Schmidt,
H.-P., Kastinger, C., Uhl, A., and Vecsei, A. (2007).
Comparison of k-nn, svm, and nn in pit pattern clas-
sification of zoom-endoscopic colon images using co-
occurrence histograms. In Image and Signal Process-
ing and Analysis, 2007. ISPA 2007. 5th International
Symposium on, pp. 516-521. IEEE.
Ikeda, N., Usami, H., Iwahori, Y., Bhuyan, M., and Ka-
sugai, K. (2016). Generating lambertian image by re-
moving specular reflection component and difference
of reflectance factor using hsv. In Proc. of ITC-CSCC
2016, T2-5, Computer Vision (2), pp.547-550.
Kumar, V., Abbas, A. K., Fausto, N., and Aster, J. C. (2014).
Robbins and Cotran pathologic basis of disease. El-
sevier Health Sciences, 9th edition.
Lin, B., Sun, Y., Sanchez, J. E., and Qian, X. (2015). Ef-
ficient vessel feature detection for endoscopic image
analysis. IEEE Transactions on Biomedical Engineer-
ing, 62(4):1141–1150.
Mohanty, A. A., Vaibhav, B., and Sethi, A. (2013). A frame-
based decision pooling method for video classifica-
tion. In 2013 Annual IEEE India Conference (INDI-
CON), pages 1–5. IEEE.
Zhang, D., Wong, A., Indrawan, M., and Lu, G. (2000).
Content-based image retrieval using gabor texture fea-
tures. In IEEE Pacific-Rim Conference on Multimedia,
University of Sydney, Australia, pages 392–395.
ICPRAM 2017 - 6th International Conference on Pattern Recognition Applications and Methods
156
