
Applying Mathematical Programming to Planning Bin Location
in Apple Orchards
Marcela C. González-Araya
1
, Carolina A. Urzúa-Bobadilla
2
and Luis G. Acosta Espejo
3
1
Department of Industrial Engineering, Faculty of Engineering, Universidad de Talca,
Camino a Los Niches km 1, Curicó, Chile
2
Faculty of Engineering, Universidad de Talca, Camino a Los Niches km 1, Curicó, Chile
3
Departamento de Ingeniería Comercial, Universidad Técnica Federico Santa María,
Avenida Santa María 6400, Vitacura, Santiago, Chile
Keywords: Pome Fruit Harvest, Bin Location, Optimization Models, Mathematical Programming.
Abstract: In Chile, it has been observed that there is downtime during the apple harvest season. This is largely due to
the long distances that the workers must cover and the lack of bins in the orchards. Currently, the
administrators do not use methods that enable them to estimate the number of bins required or where they
should be located. Taking these observations into consideration, this research paper proposes a plan for bin
placement in apple orchards by applying a location model with the objective of diminishing distances covered
by the harvest personnel. With data from an orchard in the Maule Region of Chile, the number of bins to be
used is calculated taking into consideration the particular surface characteristics of the plantation and the apple
variety maturity indicators. For the spatial distribution of the bins, the capacitated p-median was used, because
better results were obtained with it in terms of reducing travel distance during the harvest and the ease of
implementing the solutions.
1 INTRODUCTION
The Chilean apple industry has had a dynamic
development which has placed Chile among the five
main apple exporters worldwide with 10% of the
market participation, equivalent to approximately
760,000 tons exported (Bravo, 2013). Currently, one
of the major challenges facing this industry is to
increase its leadership which requires better planning
and coordination in all stages of the supply chain.
However, in the Chilean fruit industry the supply
chain activities are mainly based on the experience of
its participants.
In the literature, the first authors to use
mathematical programming models to support apple
orchard management decisions were Willis and
Halon (1976). Their research developed a dynamic
programming model to determine the optimum mix
of apple varieties to be planted over the long term and
applied it to an apple orchard in Massachusetts, USA.
Other models developed for planning the fruit
industry supply chain were presented by Ortmann et
al. (2006), Masini et al. (2007), Masini et al. (2008),
Catalá et al. (2013) and Munhoz and Morabito
(2014).
In a related line of research, Ahumada and
Villalobos (2009) carried out a literature review
focused on models based on agricultural harvests for
planning supply chain production and distribution of
agro foods. Other literature reviews on mathematical
programming models to support agricultural supply
chain decisions can be found in Weintraub and
Romero (2006) and Bjorndal et al. (2012), who
dedicated a portion of their research to models in the
agricultural area; Higgins, et al. (2010), who
discussed the challenges of adopting operations
research models in the agricultural value chain; and
Shukla and Jharkharia (2013), who classified the
models used in the fresh produce supply chain in
various ways (country, year, problem context,
technique used, among others).
Several mathematical programming models
developed in Chile to support harvesting stage
decisions have been applied mainly to the forestry
industry (Palma and Troncoso, 2001, Troncoso et al.,
2002)
C. Gonzà ˛alez-Araya M., A. UrzÞa-Bobadilla C. and G. Acosta Espejo L.
Applying Mathematical Programming to Planning Bin Location in Apple Orchards.
DOI: 10.5220/0006192203450352
In Proceedings of the 6th International Conference on Operations Research and Enterprise Systems (ICORES 2017), pages 345-352
ISBN: 978-989-758-218-9
Copyright
c
2017 by SCITEPRESS – Science and Technology Publications, Lda. All rights reserved
345

Among the fruit harvest planning in Chile, the
well-known research by Ferrer et al. (2008) proposed
a mixed integer linear programming model to
determine the plan for grape harvesting which would
minimize operating costs and maximize grape
quality. In later research done by Bohle et al. (2010)
they incorporated data uncertainty into the model
presented by Ferrer et al.(2008)which was dealt with
by robust optimization.
Regarding location model application to
agriculture, Lucas and Chhajed (2004) carried out a
review of location models based on territorial balance
theory and optimal location applied to improving the
agricultural supply chain. Found among the research
done after that of Lucas and Chhahed (2004), is the
work by Rantala (2004) who developed a mixed
integer programming model in order to design a
production-distribution system in the seed and
seedling supply chain for the purpose of evaluating
the expansion or closure of facilities (greenhouses
and cold storage).In another study, Higgins and
Laredo (2006) used two location models to improve
the sugar value chain. One of these models is a p-
median problem (Hakimi, 1964) which has an
additional restriction that limits the largest average
distance from the fields to the loading points. The
other model is similar to the capacitated clustering
problem (Osman and Christofides, 1994) which
divides the producing farms into groups and seeks to
minimize the sum of the distances from each farm to
the center of the group. These models were applied to
a sugar producing region in Australia. In a recent
study, Srinivasan and Malliga (2013) applied a p-
median model to locate collection centers for Jatropha
seeds to be used to produce oil for biofuel. The
purpose of the model was to minimize distances from
the collection centers to the demand points, thus
facilitating logistics for the growers.
In a previous study on bin location in apple
orchards, González-Araya et al. (2009) proposed
improving their distribution by using the capacitated
p-median model (Hakimi, 1964, Garey and Johnson,
1979). This study extends the research by González-
Araya et al. (2009) by taking into consideration the
fruit maturity indicators according to variety, and also
including information about the pollinating varieties.
These new data permit better adapting to the orchard
characteristics, thus obtaining a different bin
distribution plan for each variety. In this manner, this
research proposes to improve the bin distribution in
apple orchards by applying a location model in order
to reduce distances covered by the seasonal workers
during fruit harvest. The model used is the
capacitated p-median (Hakimi 1964).
Next, the problem of bin distribution in apple
orchards is described. In Section 3 the mathematical
formulation of the model and the parameters used are
presented. In Section 4 a case study is described for
an orchard located in Chile and in Section 5 the main
results and discussion thereof are shown. Finally in
Section 6 the conclusions and future research are
presented.
2 DESCRIPTION OF THE
PROBLEM
The pome fruit harvest involves extensive surface
areas, and for this reason the orchards are divided into
sections. In this manner, each section may have its
own particular characteristics, these being: Fruit
variety; plantation density (distance between trees in
the same row and distance between rows); density
(low, medium, high), that refers to the number of trees
per hectare; year of plantation; area (hectares per
section); type of irrigation; pollinating trees; among
others. All these characteristics make it so that each
section can be worked in an independent manner
(Catalá et al., 2013). Moreover, pome fruit harvest is
characteristically seasonal; with the season beginning
once the ranges of maturity for each variety have been
reached. In Chile, the harvest generally begins in mid-
February and ends around mid-April; however, this
can vary according to the climatic conditions each
year.
The surface area planted with apples in Chile is
about 37,297 hectares where the main producing
regions are the Maule Region with 22,488 hectares
and the O’Higgins Region with 10,011 hectares,
uniting 87% of the national apple plantation surface
area (Bravo, 2013).The Maule Region is the main
apple producer in Chile with 60.3% of the planted
surface area nationally, where 18,863 hectares
correspond to red apples and 3,625 hectares to green
apples (Bravo, 2013).Orchards in this region present
an average density of 1,100 trees per hectare for red
apples and 933 trees per hectare for green apples, and
an average yield of 48.8 and 50.5 tons per hectare,
respectively (CIREN and ODEPA, 2013).
The harvest requires seasonal workers, bins in
which to put the fruit, harvest equipment (ladders,
baskets, among others) and tractors to transport the
bins. Coordinating resources during the harvest is a
complex process, where the lack of any one of them
can slow it down and affect the quality of the fruit.
The apple harvest in Chile is carried out manually
to avoid any mechanical damage, given that the
ICORES 2017 - 6th International Conference on Operations Research and Enterprise Systems
346

destination markets are very far away (Asia, the
United States, Europe and the Middle East). Bins with
a capacity of approximately 350 kilograms placed
between the rows of trees are used to collect the
apples in the orchard. The placement of the bins is
done according to the preferences of the tractor driver
with little coordination with those responsible for the
orchard sectors. On one hand, the drivers know the
number of bins that should be distributed in a given
section and the harvesters know which rows of apples
they should harvest. However, the way in which the
bins are distributed results in either a scarcity or an
excess of them among the rows. As well, the seasonal
workers must frequently relocate the bins as they
advance through the harvest sector. This generates
down time and a number of extra hours for the tractor
driver to collect the bins from the orchard.
3 MATHEMATICAL
FORMULATION AND
PARAMETER ESTIMATION
In this study the solutions from the capacitated p-
median model (Hakimi, 1964, Garey and Johnson,
1979) are analyzed, for the purpose of establishing a
bin location plan that would reduce travel distance for
harvest crews and that the plan would be easy to
implement.
3.1 Capacitated p-median Problem
In general terms, the problem consists of determining
where to locate the bins and assign apples to each bin,
minimizing the distance covered by the workers
during the harvest. This case can be modeled as a
capacitated p-median problem (Hakimi, 1964, Garey
and Johnson, 1979). Thus, the installations or
medians correspond to the bins and the demand areas
correspond to the apples to be harvested.
In formulating the capacitated p-median model
the following nomenclature is considered:
},...,1{ nN
the set of possible bin locations
within the sector
},...,1{ mM
the set of apple trees in the sector
d
ij
the linear distance between the apple tree i,
iM, and the possible location of the bin j, jN.
p the number of bins needed in the sector
k the maximum number of apple trees that can be
assigned to a bin,
The decision variables of the model are defined in
the following manner:
y
j
{0,1}, where y
j
= 1 if a bin is located in
position j, y
j
= 0; if not, jN.
x
ij
{0,1}, where x
ij
= 1 if apple tree i is assigned
to the bin located in j, x
ij
= 0; if not, iM, jN.
Thus, the formulation of the capacitated p-median
model is as follows:
Minimize
m
i
n
j
ijij
xd
11
(1)
s.t.
, ,1
1
n
j
ij
Mix
(2)
, ,
1
Njkyx
m
i
jij
(3)
,
1
py
n
j
j
(4)
y
j
0,1, jN, (5)
x
ij
0,1, iM, jN. (6)
The objective function (1) seeks to minimize the
sum of the distances covered by the harvesters from
each apple tree to each assigned bin. The set of
restrictions (2) guarantees that each apple tree be
assigned to a single bin, while the set of restrictions
(3) assures that a bin located in j can be assigned, at
the most, to k apple trees. The restriction (4)
establishes that p bins must be located. Finally,
restrictions (5) and (6) define the variables that must
be binary.
3.2 Estimation of Parameters Used in
the Model
The model parameters are calculated in agreement
with the description of the problem given in Section
2; those being: distance between an apple tree and the
possible bin location points; number of bins to be
located in each sector; capacity of each bin (measured
in trees), which differs according to apple variety; and
plantation characteristics by sector, that is, the
number of trees planted and fruit count before
harvest.
The potential bin locations are represented as
discrete points established midway between apple
tree rows and equidistant among the trees. The
quantity of potential locations will depend on the
Applying Mathematical Programming to Planning Bin Location in Apple Orchards
347

plantation density, the distribution of pollinating trees
and quantity of trees per row of surface area.
The distance d
ij
(in meters) between apple tree i
and the potential bin location j is obtained by
calculating the Euclidian distance, given that it is a
good approximation of the real distance covered by
the harvest workers, since, generally there are no
obstacles to covering the distance by walking in a
straight line.
The parameter p indicates the number of bins to
be located in a surface area to receive the gathered
apples. Its value is determined with the following
formula:
afbSS
FPCmTAPNp
(7)
Where:
PN
S
: kg estimated net production for a sector.
TA
S
: total trees of the variety to be harvested
planted in a sector.
P
f
: percentage of fruit on the tree with sufficient
maturity for collecting.
C
b
: Capacity of the bin selected for the harvest,
measured in kg.
m: number of apple trees in the sector.
F
a
: adjustment factor.
The adjustment factor permits defining a margin
of security in order to avoid running out of bins
during the harvest. In this case 1.1 was considered for
the F
a
. This value was obtained from the average of
the variation coefficients in the production of the
apple trees, which was 10%.
Once the p parameter has been obtained, the k
parameter is calculated. It represents the quantity of
trees it is feasible to assign to a bin when harvesting
a particular variety so the unit of measurement is
trees/bin. The formula is calculated as follows:
p
m
k
(8)
Formula (8) establishes that if the result is a
decimal, it is rounded up to the next integer, given that
k must be a whole number.
4 CASE STUDY
Data was taken from an orchard in the Maule Region,
Chile that has an apple tree plantation of more than
66 hectares. The varieties of trees occupying the most
surface area of the orchard were included, these being
Royal Gala, Early Red One and Granny Smith. Each
section of the orchard corresponds to the area where
a specific variety is planted of which the number of
hectares may vary. These sections present different
types of harvesting; the Royal Gala is harvested by
selective picking and the Early Red One and Granny
Smith are harvested by strip picking. As is described
by Gil (2004), in selective pickings, the sector must
be covered at least three times during the season since
the fruit does not mature homogeneously. In strip
picking, the sectors are covered only once, harvesting
all the fruit from the trees.
The instances of the location models were solved
using the optimization software, CPLEX 12.0,
academic version, for integer linear programming
problems.
To generate the parameters of the capacitated p-
median model it is necessary to obtain information
about the characteristics and production of the
sectors, which has to be periodically revised, and also
data about the previous and current season. The
required information for each sector is as follows:
trees planted, surface area (in hectares), location of
the pollinating trees, number of pollinating trees per
sector and per row, plantation density, year of
plantation, number of trees per row and per sector.
The required data from the previous season include
the kilograms of apples sent to a packing plant,
kilograms of apples that did not meet the required
quality parameters (discard), and the percentage of
apples to be harvested. The necessary data from the
current season are the tree load, the weight of the fruit
in kilograms, the bin capacity in kilograms, an
estimated percentage of apples that will not meet the
required quality parameters (discard), and finally, the
percentage of apples to be harvested.
In regard to the data from the previous season or
that of the current season it is important to mention
that both types of data are not used at the same time.
One must select which of these information sources
to use as input for generating parameters, taking into
consideration the rigorousness of data collection in
each of the seasons and the seasonal variability of the
factors that affect the harvest (climatic conditions,
fertilizer application, fruit thinning, fruit count, tree
replacement, among others).
Applying the equations described in Section 3.1,
the ranges and input parameters of the model for a
sector are calculated with the obtained information.
The capacity parameters and number of bins used in
the model for each variety of apples is shown in Table
1, in which different harvesting methods are
observed, and hence, different input parameters.
ICORES 2017 - 6th International Conference on Operations Research and Enterprise Systems
348
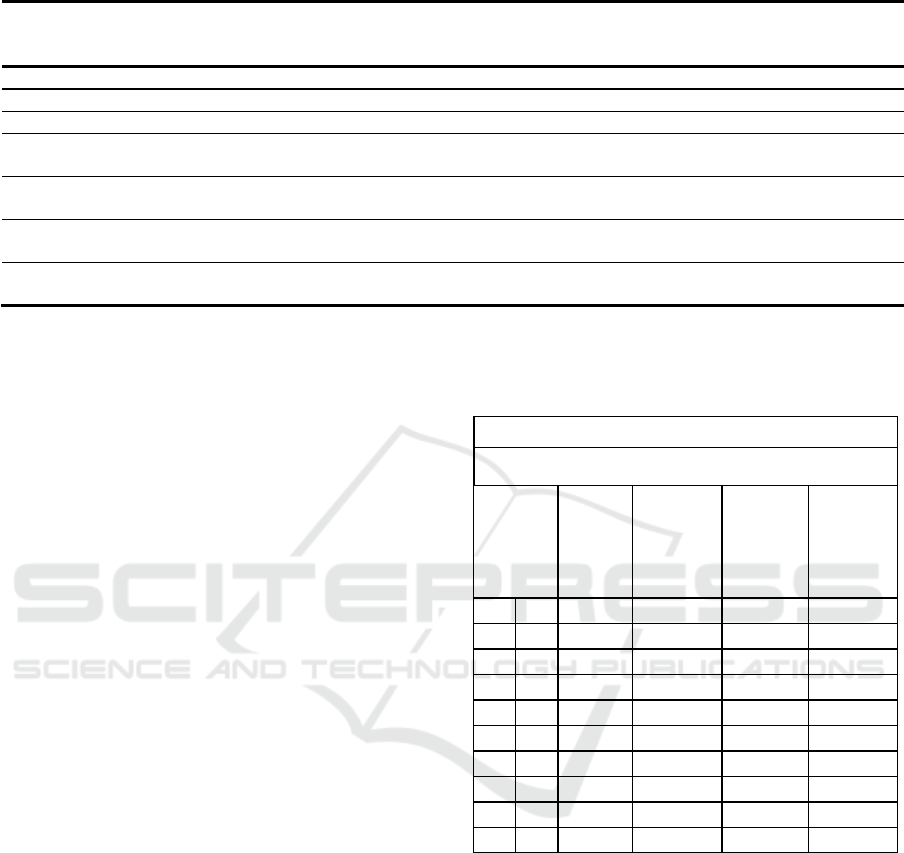
Table 1: Parameters used in the capacitated p-median location model according to apple variety by sector.
Variety Harvest Method
Percentage of
Harvest (%)
Bin Capacity
(trees/bin) (k)
Sector Surface
Area (ha.)
N° of bins to be
located per
sector (p)
Early Red One Strip picking 100 9 4.5 685
Granny Smith Strip picking 100 8 4.6 696
Royal Gala Strip picking 100 7 6.4 848
Royal Gala Selective
pickings
80 8 6.4 680
Royal Gala Selective
pickings
60 10 6.4 508
Royal Gala Selective
pickings
40 14 6.4 336
Royal Gala Selective
pickings
20 28 6.4 181
5 RESULTS AND DISCUSSION
In this section the main bin distribution proposals
obtained when applying the capacitated p-median
model are presented. The results for the Early Red
One and Royal Gala varieties that have the strip
picking and selective picking methods, respectively,
are described in greater detail.
With the information from the previous harvest
season (2010) a plan for collecting according to sector
was obtained, indicating the spatial distribution of the
bins, and the distance between the bins (metric and
practical).The practical distance is understood as the
number of trees there should be between individual
bins. It turns out that this distance is easier to explain
to the tractor drivers who distribute the bins since it is
only necessary to indicate the space (number of trees)
that should be left between containers.
To estimate the harvest plan and the average
distance covered by the seasonal workers in Sector
M13 that has the Early Red One variety, the following
information is used: 259,321 kg net weight harvested
in the 2010 season, 379 kg average bin capacity and
the strip picking harvesting method.
After applying the model, it was found that the
average distance from the trees to their assigned bin
covered by the harvest workers is 2.94 m,
approximately. Considering the 119 rows in this
sector, 685 bins should be located there in order to
collect all of the apples.
Table 2: Bin location plan in the sector with Early Red One
at 100% harvest.
Bin Location Plan
Sector: Early Red
One
Harvest method: Strip picking
Between
Rows
Number
of bins
Number
of
apple
trees
Metric
distance
Practical
distance
1 2 11 99 7.9 4
3 4 12 101 7.4 4
5 6 11 99 7.9 4
7 8 12 101 7.4 4
9 10 11 99 7.9 4
11 12 12 101 7.4 4
13 14 11 99 7.9 4
15 16 12 101 7.4 4
17 18 11 99 7.9 4
19 20 12 101 7.4 4
Part of the location plan obtained for harvesting
the Early Red One variety which has a 4.5 ha surface
area is shown in Table 2. For example, it is indicated
on this table that 11 bins (second column) should be
located between Rows 1 and 2 at a distance of 7.9 m
(fourth column) or a practical distance of 4 trees (fifth
column).As a reference, indicated in the third column
is the total number of apple trees allotted to the 11
bins for Rows 1 and 2; that is to say, the 11 bins have
the capacity to hold the fruit collected from the 99
apple trees between these two rows.
The difference between the metric and practical
distance is about 6.2%, equivalent to 0.45m, so it is
hoped that the use of the practical distance achieves
an improvement similar to that of the metric distance.
Applying Mathematical Programming to Planning Bin Location in Apple Orchards
349
In order to propose the bin distribution plan for
Sector M4 which has the Royal Gala variety, the
following information is used: 320,766 kg net weight
harvested in the 2010 season, 386 kg average bin
weight and 40% of the orchard production (a 40%
selective picking).In this application of the
capacitated p-median model the proposal described is
for a 40% selective picking, which generally
corresponds to the initial selective picking of the
season. The total surface area of the plantation
considered in this case is 6.4 ha.
According to the model results the seasonal
workers must walk an average of 8.23 m from the
apple trees to their designated bins.
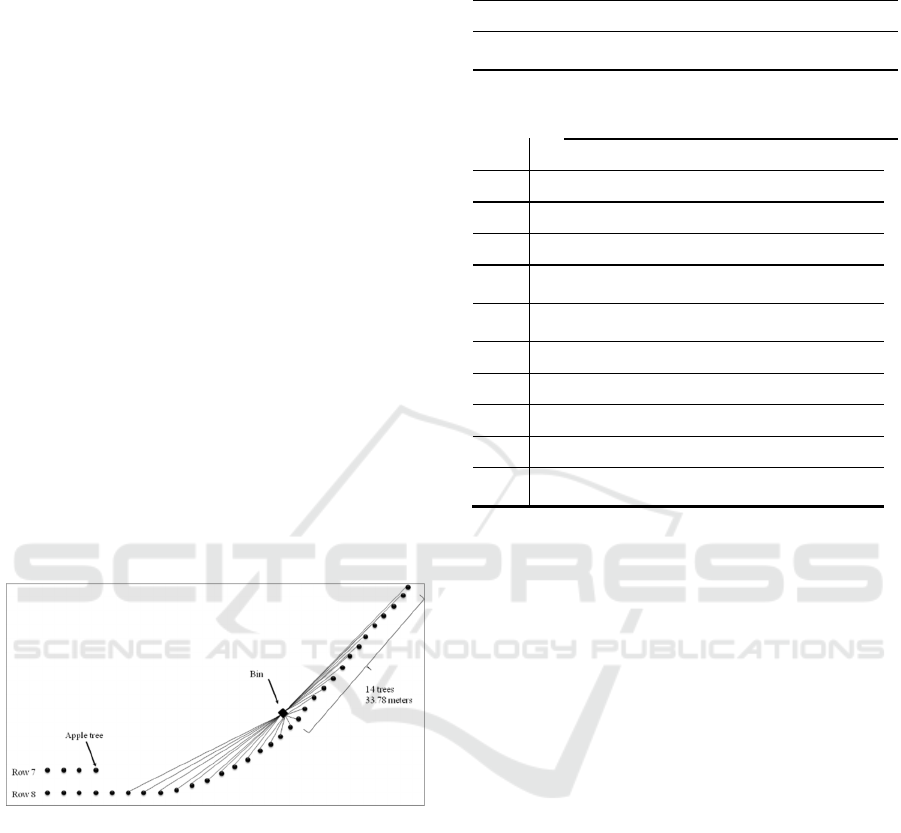
Because of the contour level irrigation system
used in the sector with this variety, it presents a
different number of trees per row. For this reason, on
occasion, locating only one bin between two rows
was proposed. This situation is shown in Figure 1,
where a bin is located between Rows 7 and 8, placing
it at the end of the longest row. In this way this bin
embraces a total of 27 apple trees at a distance of
approximately 34 m or every 14 trees. Hence, to make
the bin location operative, in each row a bin will be
placed every 17 m or every 7 trees, which
corresponds to the average distance between bins for
a 40% selective picking (see Table 3).
Figure 1: Bin location between rows 7 and 8 in the sector
with the Royal Gala variety and the contour irrigation
system.
The difference between the estimated metric and
practical distances is 3.8%, equivalent to 0.65 m. As
with the Early Red One variety, guiding the bin
distribution using the practical distance is simpler for
the tractor drivers.
For the bin location plans with different
percentages of selective picking it was observed that
the greater the percentage of selective picking, the
lesser the average distance at which bins should be
located. Following, Table 4 shows the results for
apple varieties with a larger number of hectares
planted in the orchard.
Table 3: Bin location plan for the Royal Gala variety at a
40% selective picking harvest.
Bin Location Plan
Sector: Royal Gala
Harvesting method: 40% selective
picking
Between N° N° of Metric Practical
Rows
of
bins
Apple
trees
distance Distance
2 3 3 48 19.2 8
3 4 4 48 14.4 6
5 6 3 38 15.0 6
6 7 13 193 18.4 7
7 8 1 16 Locate at the end or
beginning of the row
11 9 139 19.0 8
11 12 4 52 15.6 6
14 15 13 195 18.6 7
17 18 2 27 15.6 6
18 19 14 214 18.9 8
19 20 1 16 Locate at the end or
beginning of the row
Table 4 indicates how many bins are needed for
the complete harvest in a determined sector according
to the percentage of mature fruit, the bin location
every certain number of rows and the distances
between them determined by the number of trees.
It is worth mentioning that according to Gil
(2004) it is recommended to do at least three selective
pickings during the harvest season for the Royal Gala
variety (sector M4), which implies covering the
surface area planted with this variety three times.
However, during the study season, only selective two
pickings were carried out in the orchard for this
variety; one 60% selective picking and the remaining
40% was harvested by strip picking. Thus, it is
estimated that the location plan proposed for the 60%
selective picking reduced the average distance
covered by 0.46 m, implying a 5.73% reduction in the
average distance covered. Similarly, for the 40%
selective picking the average distance covered was
reduced by 1.81 m, which means an 18.03% reduction
in the average distance covered.
So, when the capacitated p-median model is
applied, it is possible to reduce distances covered by
the harvest personnel, where the average reduction is
approximately 16%. This reduction in distances
covered would allow improving the apple harvest
productivity.
ICORES 2017 - 6th International Conference on Operations Research and Enterprise Systems
350

Table 4: Summary of the results for bin location according to apple variety by sector.
Variety Sector
Percentage
Harvested (%)
N° of bins to be
located per
Sector (p)
N° of rows
between which
bins are to be
located
Average
practical
distance for
locating a bin
(number of
trees)
Early Red One M13 100 685 2 4
Granny Smith M8 100 696 2 4
Royal Gala M4 100 848 2 3
Royal Gala M4 80 680 2 4
Royal Gala M4 60 508 2 5
Royal Gala M4 40 336 4 7
Royal Gala M4 20 181 4 14
6 CONCLUSIONS
The capacitated p-median model was applied to the
sectors of larger size in an orchard located in the
Maule Region, Chile, where parameters representing
the characteristics of each sector were used.
Therefore, the model is flexible in that it adapts to the
conditions in a specific surface area, taking into
account different input sources. Moreover, it permits
the use of various bin capacities, making it adaptable
to other types of pome fruit harvest.
In this study a bin location plan was proposed
for harvesting the Early Red One, Granny Smith and
Royal Gala varieties, which resulted in a reduction in
the average distance covered between the apple trees
and their specific container of 16.48%, 28.38% and
11.88%, respectively. This reduction in the distances
covered would permit an increase in worker
productivity and a reduction in harvest operational
costs. However, given that there was no study done
on harvest times and associated costs, it was not
possible to estimate these effects.
The suggested location model can be applied to
the harvest of pollinating trees as well, considering
these trees represent 11% of the plantation area.
The harvesting process reflects several
opportunities for research intended to improve its
operation. For example, the system used to determine
the fruit load is not based on any statistical procedure
to validate its reliability. Therefore, a study could be
done based on the particular characteristics of each
sector keeping in mind the respective maturity
indicators (such as fruit color), and the associated
agro climatic variables.
The plantation characteristics of each sector are
important parameters to consider for the harvest so
maintaining up-to-date information about these
parameters is necessary for making good decisions.
However, not all the orchards consistently carry out
this activity. In the case of the study orchard, the exact
distribution of the pollinating trees within a sector is
unknown to the administration; they have only an
estimated ratio of pollinating trees per sector, which
is approximately 11%. According to what was
observed for the analyzed varieties, the distribution of
the pollinating trees depends on the variety planted in
the sector. Also, it should be taken into account that
the harvest of these pollinating trees does not occur at
the same time as that of the main variety, which
involves planning a different harvest in the same
sector.
In future research it is recommended to study the
operations involved in harvesting the pollinating trees
with stationary bins and bin-carrying carts since it
could improve the assignment of machinery for the
harvest and reduce its cost. This is relevant since, as
previously mentioned, the pollinating trees represent
approximately 11% of the trees planted in a sector.
Thus, for the largest sector in the orchard (sector M4)
with 6.4 hectares planted with approximately 5,690
apple trees in all, the 11% pollinating trees
corresponds to 626 apple trees which must be
harvested. This illustrates the complexity of harvest
planning for this sector. Moreover, this difficulty
increases considering that during the season several
sectors are harvested at the same time.
Finally, other research opportunities arise from
the development of simulation models to plan the
machinery needed for the harvest and the application
of vehicle routing models for the purpose of
minimizing distances and fuel costs for the tractors
used for collecting and placing the bins in the orchard.
Applying Mathematical Programming to Planning Bin Location in Apple Orchards
351

REFERENCES
Ahumada, O., Villalobos., J.R., 2009. Application of
planning models in the agri-food supply chain: A
review. Eur. J. Oper. Res. 195, 1-20.
Bjorndal, T., Herrero, I., Newman, A., Romero, C.,
Weintraub, A., 2012. Operations research in the natural
resource industry. Int. Trans. Oper. Res. 19, 39–62.
Bohle, C., Maturana, S., Vera, J., 2010.A robust
optimization approach to wine grape harvesting
scheduling. Eur. J. Oper. Res. 200, 245–252.
Bravo M., J., 2013. Manzana: una temporada de alto valor
de exportaciones. Publicación de la oficina de estudios
y políticas agrarias – ODEPA. Ministerio de
Agricultura, Gobierno de Chile, Chile.
Catalá, L.P., Durand, G.A., Blanco, A.M., Bandoni, J.A.,
2013. Mathematical model for strategic planning
optimization in the pome fruit industry. Agr. Syst. 115,
63–71.
CIREN – Centro de Información de Recursos Naturales,
ODEPA – Oficina de Estudios y Políticas Agrarias,
2013. Catastro Frutícola, Principales Resultados,
Región del Maule, Junio 2013, Chile.
Ferrer, J.,MacCawley, A., Maturana, S., Toloza, S., Vera,
J., 2008. An optimization approach for scheduling wine
grape harvest operations. Int. J. Prod. Econ. 112, 985–
999.
Garey, M.R., Johnson, D. S. (Eds), 1979. Computers and
intractability: a guide to the theory of NP-
completeness. W.H. Freeman and Co. San Francisco,
USA.
Gil S., G. F. (Ed.), 2004. Fruticultura: Madurez de la fruta
y manejo poscosecha: frutas de climas templado y
subtropical y uva de vino, 2. Ediciones Universidad
Católica de Chile, Santiago de Chile, Chile.
González-Araya, M., Acosta-Espejo, L., Ferreira, M., 2009.
Una Propuesta de Optimización en el Proceso de
Cosecha de Manzanos. In Anales del XLI Simpósio
Brasileiro de Pesquisa Operacional. Porto Seguro,
Brasil.
Hakimi, S.L. 1964. Optimum location of switching centers
and the absolute centers and medians of a graph. Oper.
Res. 12:450–459.
Higgins, A.J., Laredo., L., 2006. Improving harvesting and
transport planning within a sugar value chain. J. Oper.
Res. Soc. 57, 367–376.
Higgins, A.J., Miller, C.J., Archer, A.A., Ton, Τ., Fletcher,
C.S., McAllister, R.R.J., 2010. Challenges of
operations research practice in agricultural value
chains. J. Oper. Res. Soc. 61, 964–973.
Lucas, M.T., Chhajed, D., 2004. Applications of location
analysis in agriculture: a survey. J. Oper. Res. Soc. 55,
561–578.
Masini, G.L., Blanco, A. M., Petracci, N.C., Bandoni, J.A.,
2007. Supply chain tactical optimization in the fruit
industry. In: Papageorgiou, L., Georgiadis, M. (Eds.),
Supply Chain Optimization, Volume 4, Part II. John
Wiley & Sons, New York, pp. 121– 172.
Masini, G.L., Blanco, A.M., Petracci, N.C., Bandoni, J.A.,
2008. Optimal Operational Planning in the Fruit
Industry Supply Chain. In: Ferruh E. (Ed.),
Optimization in Food Engineering. CRC Press, Taylor
and Francis Group, pp. 703–746.
Munhoz, J.R., Morabito, R., 2014. Optimization
approaches to support decision making in the
production planning of a citrus company: A Brazilian
case study. Comput. Electron. Agric. 107, 45-57.
Ortmann, F.G., Vuuren, J.H., van Dyk, F.E., 2006.
Modeling the South African fruit export infrastructure:
a case study. ORiON. 22 (1), 35–57.
Osman, I.H., Christofides. N., 1994.Capacitated clustering
problems by hybrid simulated annealing and tabu
search. Int. Trans. Oper. Res. 1, 317–336.
Palma, C., Troncoso, J., 2001. Asignación óptima de
equipos en faenas de cosecha forestal. Revista El
Bosque. 22, 65-73.
Rantala, J., 2004. Optimizing the supply chain strategy of a
multi-unit Finnish nursery company. SilvaFenn. 38 (2),
203–215.
Shukla, M., Jharkharia, S., 2013.Agri-fresh produce supply
chain management: a state-of-the-art literature review.
Int. J. Oper. Prod. Man. 33 (2), 114–158.
Srinivasan, S.P., Malliga, P., 2013. An Optimal Jatropha
Seed Warehouse Location Decision Using Myopic and
Exchange Heuristics of P Median. In: Dou R. (Ed.),
Proceedings of 2012 3rd International Asia Conference
on Industrial Engineering and Management Innovation
(IEMI 2012). Springer-Verlag, Berlin Heidelberg.
Troncoso, J., Garrido, R., Ibacache, X., 2002. Modelos de
localización de instalaciones: Una aplicación para la
producción y logística forestal. Revista El Bosque. 23,
57–67.
Weintraub, A., Romero, C., 2006. Operations Research
Models and the Management of Agricultural and
Forestry Resources: A Review and Comparison.
Interfaces. 36 (5), 446–457.
Willis, C., Hanlon, W., 1976. Temporal model for long-run
orchard decisions. Can. J. Agr. Econ. 24 (3), 17–28.
ICORES 2017 - 6th International Conference on Operations Research and Enterprise Systems
352
