
A Multi-agent Approach to Model and Analyze the Behavior of Vessels in
the Maritime Domain
Mathias Anneken
1
, Yvonne Fischer
2
and J
¨
urgen Beyerer
1,2
1
Vision and Fusion Laboratory, Karlsruhe Institute of Technology (KIT), Karlsruhe, Germany
2
Fraunhofer Institute of Optronics, System Technologies and Image Exploitation (Fraunhofer IOSB), Karlsruhe, Germany
Keywords:
Multi-agent System, Anomaly Detection, Nash Bargaining Solution, Maritime Domain.
Abstract:
The automatic detection of suspicious behavior is one important part in order to support operators in surveil-
lance tasks. Therefore, an approach to model the behavior of objects by using multi-agent systems is intro-
duced. As each object has its own objectives and desires to fulfill, these are modeled as utility functions. The
actions of the objects are estimated by using the Nash bargaining solution. Consequently, it is implied, that
the objects are cooperating in order to achieve an optimal result for themselves. First results for this algorithm
are shown by using examples from the maritime domain. On the one hand, the algorithm is used to calculate
an anomaly score. On the other hand, it is used to predict the movement of vessels.
1 INTRODUCTION
Surveillance tasks, like monitoring and controlling air
or sea traffic, have an increasing importance in times
of terrorist threats, refugee crises, and illegal immi-
gration. In order to prevent disasters, it is crucial to
identify anomalies and suspicious behavior of objects
and vessels in the monitored areas.
The increasing amount of data, captured by a mul-
titude of different sensors, permits the identification
of relevant situations. But at the same time, they can
overstrain the operators with too much information.
To counter this information overload, it is important
to support the operators by helping them to focus on
the crucial events. Therefore, an algorithm is intro-
duced to help operators in surveillance tasks to im-
prove their situation awareness, and to support them
during the decision making process.
There are two types of important situations for op-
erators. On the one hand, a specific situation with im-
portant characteristics can be recognized during the
surveillance tasks (e.g. a pirate attack). On the other
hand, the behavior of some objects deviates from the
expected behavior in the area. The operators have to
react upon both situations and assess their next steps.
The proposed algorithm will model the behavior
of objects by utilizing the Nash bargaining solution
in combination with an agent-based approach. Each
monitored object will be represented by an agent, with
its own utility function and objectives to achieve. As
normal behavior implies, that the agents will cooper-
ate with each other or at least will follow the rules and
laws, a cooperative game theoretic model seems to be
a valid approach to model the behavior.
First, related work with a focus on agent-based
models for surveillance and controlling tasks, and
anomaly detection in particular in the maritime do-
main is described. Then, the proposed algorithm with
the modeling of the bargaining game and the utility
function is introduced. Afterwards, the algorithm is
evaluated by using situations from real sea traffic. Fi-
nally, a conclusion and a forecast on future work are
given.
2 RELATED WORK
One of the first applications of multi-agent systems
for control and surveillance tasks is described by
Ljungberg and Lucas (1992) by introducing the Op-
timal Aircraft Sequencing using Intelligent Schedul-
ing (OASIS) system. OASIS is designed to optimize
air traffic and airport capacities by estimating appro-
priate instructions to achieve an efficient sequence of
arriving and departing aircraft. Hence, each aircraft is
modeled as an agent together with five global agents.
The agents are designed in a believe-desire-intention
architecture.
Yang et al. (2007) describe how agents in a bar-
gaining game can optimize the evasive maneuver of
200
Anneken M., Fischer Y. and Beyerer J.
A Multi-agent Approach to Model and Analyze the Behavior of Vessels in the Maritime Domain.
DOI: 10.5220/0006192002000207
In Proceedings of the 9th International Conference on Agents and Artificial Intelligence (ICAART 2017), pages 200-207
ISBN: 978-989-758-219-6
Copyright
c
2017 by SCITEPRESS – Science and Technology Publications, Lda. All rights reserved

ships. For the estimation of the optimal course to
avoid a collision, a negotiation system is used: Each
vessel in a possible collision is modeled as an agent.
Based on a monotonic concession protocol the agents
have to make concessions in order to achieve an
agreement. If they cannot agree on a strategy, a so-
lution based on another algorithm will be used.
A multi-agent system for the maritime surveil-
lance is presented by Mano et al. (2010). Each vessel
in an area is monitored by an individual agent. These
agents estimate the criticality value for the assigned
vessel as a combination of different rules with respect
to the vessel’s state and the area around the vessel. As
the conditions in the monitored area will evolve, it is
designed as an adaptive system.
Agogino and Tumer (2012) introduce a multi-
agent system for managing air traffic flow. Reinforce-
ment learning methods are used in order to reduce
congestion. Each agent is responsible for a specific
area. For each plane passing the area, the responsi-
ble agent has to chose its action: to change the dis-
tance between airplanes, to order delays, or to reroute
an aircraft. The system is evaluated by using simula-
tions.
Dynamic Bayesian networks are used by Fischer
et al. (2014) in order to model situations of interest,
e.g. smuggling of goods. As a dynamic Bayesian net-
work has several parameters, which domain experts
might not be able to intuitively choose, Fischer et al.
developed an approach to estimate these parameters
by giving only a few more intuitive parameters as in-
put. For the evaluation, a specific situation is modeled
and results for different sets of parameters are given.
Two different kinds of similarity measures are
analysed by de Vries and van Someren (2014). On
the one hand, alignment measures such as dynamic
time warping, and, on the other hand, measures based
on the integral between two trajectories are used.
Both types of measures are utilized in kernel meth-
ods for clustering and classification tasks as well as
for anomaly detection. For the evaluation, a dataset
from the maritime domain is used.
Soleimani et al. (2015) assume, that vessels in the
maritime domain take the shortest possible route be-
tween the start harbor and the destination. Therefore,
they use the A* algorithm to generate a reference tra-
jectory, which is compared to the real path of a vessel.
If the deviation is large, the vessel’s behavior is con-
sidered an anomaly.
As the amount of data processed in surveillance
tasks can be huge, Cazzanti et al. (2015) show how
big data technologies can help to face the arising chal-
lenges. They use these methods to handle incoming
data efficiently and to do geospatial analyses on the
stored data.
An algorithm for the identification of anomalies in
spatio-temporal data based on b-spline interpolation
is introduced by Anneken et al. (2016). They use the
control points of the b-spline representation of a tra-
jectory as a feature vector for different machine learn-
ing methods. As the training data is annotated, the
machine learning algorithm will be trained to identify
two classes, the normal and abnormal. The whole al-
gorithm is evaluated on a dataset from the maritime
domain.
Millefiori et al. (2016) developed a method to pre-
dict the state of vessels under way in open sea. They
use an Ornstein-Uhlenbeck process in order to esti-
mate the long-term state. During their evaluation,
they compare the Ornstein-Uhlenbeck based method,
with a classic approach based on a white noise ran-
dom process on the velocity.
3 ALGORITHM
A bargaining game
B = (N, P, c) (1)
is defined by the set of players N = {1, . . . , n}, the
payoff space P ⊂ R
n
and the conflict or disagreement
point c ∈ P. The conflict point represents the payoff c
i
which will be obtained by the player i, if no agreement
is reached.
Each player i ∈ N has its own strategy space S
i
. A
strategy for i is denoted by s
i
∈ S
i
. The set of possible
strategy combinations is then given by S = S
1
× ··· ×
S
n
. The payoff for a player i ∈ N is given by the utility
function u
i
: S → R. The whole payoff vector for a
strategy combination s ∈ S is given by u : S → R
n
.
3.1 Nash Bargaining Solution
The Nash bargaining solution as introduced by Nash
(1950) satisfies the following axioms: pareto optimal-
ity, independece of irrelevant alternatives, symmetry,
and invariance to affine transformations. These ax-
ioms are said to characterize a fair solution of a bar-
gaining game. It can be shown, that for a bargaining
game as given in equation (1) the solution to the opti-
mization problem
max
u
n
∏
i=1
(u
i
− c
i
) (2)
s.t.: u ∈ P
u
i
≥ c
i
∀i ∈ N
satisfies these axioms. The objective function in equa-
tion (2) is called Nash product. Unlike for example
A Multi-agent Approach to Model and Analyze the Behavior of Vessels in the Maritime Domain
201
the Kalai-Smorodinsky bargaining solution, this con-
cept can deal directly with n > 2 players.
Here, the optimization problem is solved by us-
ing the differential evolution algorithm introduced by
Storn and Price (1997). This method does not guar-
antee an optimal solution, but compared to other al-
gorithms, the gradient of the problem is not used for
the optimization process.
3.2 Game Theoretic Model of Sea
Traffic Behavior
The behavior of the players in a game theoretic model
depends mainly on the chosen utility function u and
the solution concept. Here, the Nash bargaining so-
lution is used to identify the optimal strategy for the
players.
The state of a player i ∈ N at the time t is given by
its position p
t,i
= (p
t,i,lon
, p
t,i,lat
), speed v
t,i
and head-
ing φ
t,i
. Here, the heading is counted anti-clockwise.
The speed is limited to v
i,max
.
Furthermore, each player follows a route consist-
ing of multiple waypoints, and each player wants to
reach a destination p
i,d
. No player desires a collision,
and each player wants to follow its route and reach its
destination as fast as possible.
The position of each player is georeferenced.
Thus, if it is not denoted otherwise, the great-circle
distance will be used for the distance calculations.
The distance between the points a and b is indicated
by d
gcd
(a, b).
3.2.1 Strategies
Each vessel can change its speed and heading during
each timestep. Therefore, a simple motion model is
used, which consists of the change in velocity d
v,i
∈
[−1, 1] and the change of the heading d
φ,i
∈ [−
π
2
,
π
2
].
For the next timestep t + 1 the speed and heading will
be set accordingly to
v
t+1,i
= d
v,i
· v
i,max
φ
t+1,i
= φ
t,i
+ d
φ,i
.
The position is estimated by using the great circle
through p
t,i
with φ
t+1,i
and the distance covered by
v
t+1,i
. Thus, each player i follows a strategy
s
i
= (d
φ,i
, d
v,i
).
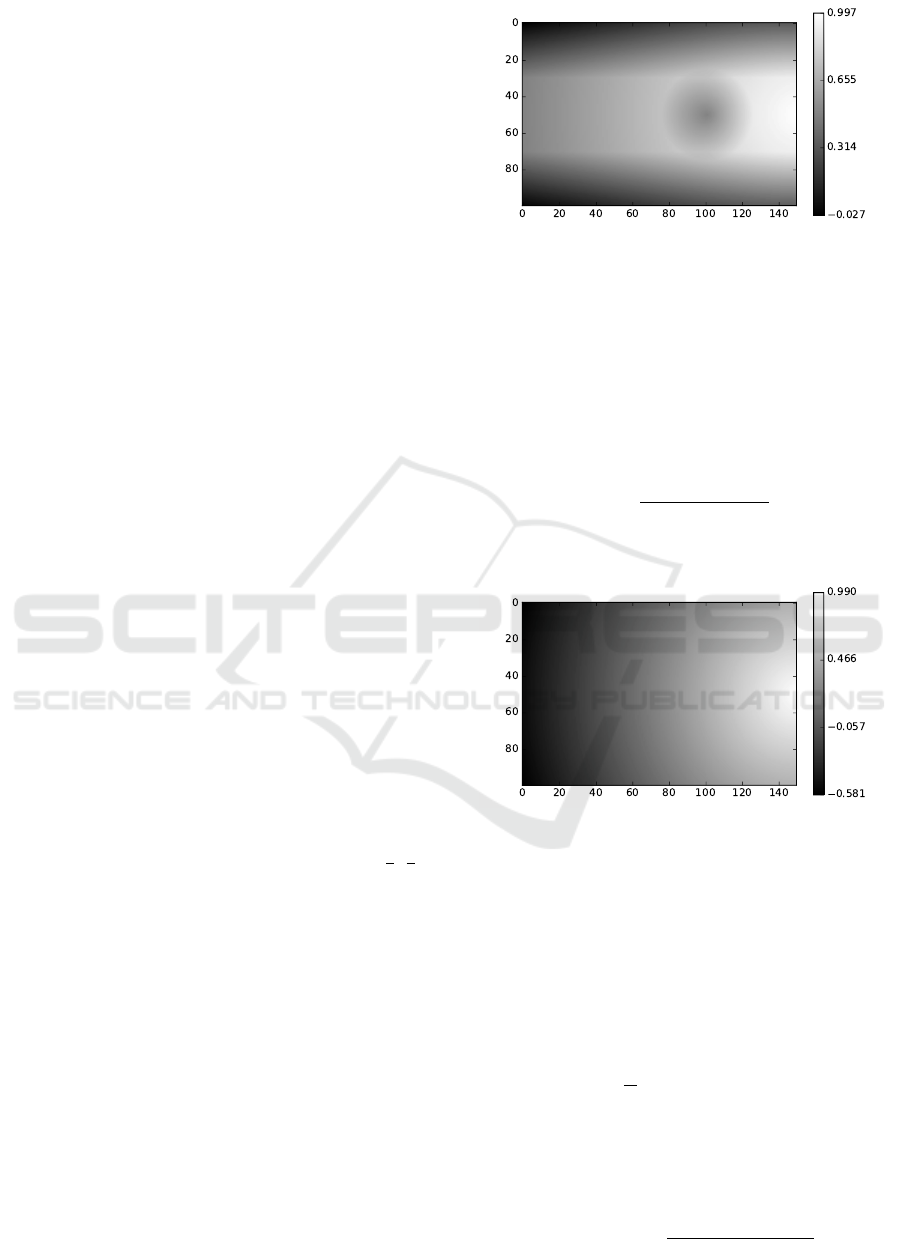
3.2.2 Utility Function
The utility function is given by four components,
which define a desirable behavior of a player. The
total utility is then given by the mean value of the
applicable components, and is shown for an example
constellation in Fig. 1.
Figure 1: The mean of u
d
, u
r
, and u
p
for a player at (50, 50)
on the route (0, 50) → (150, 50) and a stationary player at
(100, 50) with the parameter set to δ
r
= 20 and δ
p
= 25.
The gradient from black to white represent the utility of the
player. The euclidean norm is used for the distance calcula-
tions.
Distance to Destination. The utility for reaching
the destination is given by the ratio between the dis-
tance to the destination at the timestep t + 1 and the
distance to the destination at the timestep t
u
d
=
d
gcd
(p
t+1,i
, p
i,d
)
d
gcd
(p
t,i
, p
i,d
)
.
A visual representation of the utility function is shown
in Fig. 2.
Figure 2: u
d
for a player at (50, 50) on the route (0, 50) →
(150, 50). The gradient from black to white represent the
utility of the player. The euclidean norm is used for the
distance calculations.
Distance to Route. For this utility function, the dis-
tance d
r,i
between the route and p
t+1,i
has to be calcu-
lated. The desire of each player to stay in the proxim-
ity of its route can be configured by the parameter δ
r
.
This results in the following utility function
u
r
=
(
1, if d
r,i
≤ δ
r
−
1
δ
r
· d
r,i
+ 2, otherwise
,
which is shown in Fig. 3.
Distance to other Players. The utility for a player
i for keeping distance to other players is given by
u
p
= min
j∈N, j6=i
min
d
gcd
(p
t+1,i
, p
t+1, j
)
δ
p
, 1
.
ICAART 2017 - 9th International Conference on Agents and Artificial Intelligence
202

Figure 3: u
r
for a player at (50, 50) going on the route
(0, 50) → (150, 50) and δ
r
= 20. The gradient from black
to white represent the utility of the player. The euclidean
norm is used for the distance calculations.
The parameter δ
p
is used to adjust the distance, a
player likes to keep to the other players. The utility
function is depicted in Fig. 4.
Figure 4: u
p
for a player at (50, 50) and a stationary player
at (100, 50) and δ
p
= 25. The gradient from black to white
represent the utility of the player. The euclidean norm is
used for the distance calculations.
Collision Avoidance. As no player with normal be-
havior desires a collision with another player, a mech-
anism has to be implemented to cover this problem by
providing a utility function enforcing the avoidance
of collisions. As the behavior of motorized vessels
is analyzed, the vessels have to avoid a collision by
turning to starboard (right hand side). Therefore, the
utility function u
c
given in Fig. 5 is used. It will be
applied, if an immediate collision is detected.
Figure 5: u
c
as a function of d
φ
.
Figure 6: Sea traffic between Lolland (Denmark) in the
north and Fehmarn (Germany) in the south in a time pe-
riod of one week. The blue lines represent trajectories of
vessels. The grey polygons are landmasses.
4 EVALUATION
For the evaluation, a dataset from the maritime do-
main is used as shown in Fig. 6. The ship traffic
was recorded in a period of 7 days starting from 16th
May 2011 using the Automatic Identification System
(AIS). In order to analyze the performance to mimic
the behavior of the vessels, some situations with inter-
esting behavior are selected. In particular, it is the in-
teraction of cargo and tanker vessels with ferries and
passenger ships. Ferries and passenger ships sail, e.g.,
between the islands Lolland (Denmark) and Fehmarn
(Germany). The route of cargo and tanker vessels in-
tersects with the ferry route. Therefore, the vessels
have to avoid collisions with each other.
In the following, some situations are picked from
the dataset for evaluating the prediction capabilities
as well as the suitability as an anomaly detection al-
gorithm.
4.1 Prediction
For the first situation same route, two vessels are sail-
ing into the same direction on the same route, but with
different speed. Thus, one vessel overtakes the other.
The simulation results are shown in Fig. 7, Fig. 8, and
Fig. 9. In the first two figures, the results with varying
values for δ
p
are shown. A low value for δ
p
means,
that the vessels drive in closer proximity to each other.
In Fig. 9, the utility function for one player is shown.
The blue circle in this figure is the current position of
the blue vessel, while the green circle represents the
next position of the green vessel.
The influence of u
r
and u
d
can be clearly seen in
Fig. 9, as the route is light grey in the bottom right
corner of the figure with a gradient to white in the
top left corner. Around the next position of the green
A Multi-agent Approach to Model and Analyze the Behavior of Vessels in the Maritime Domain
203

Figure 7: Situation same route. δ
p
= 1.5. Stroked lines with
squares show the recorded behavior, while dashed lines with
circles show the simulation results.
Figure 8: Situation same route. δ
p
= 2.5. Stroked lines with
squares show the recorded behavior, while dashed lines with
circles show the simulation results.
Figure 9: Situation same route. δ
p
= 1.5. Stroked lines
show the recorded behavior. The blue circle represents the
current position of the blue vessel, while the green one rep-
resents the next estimated position of the green vessel. The
backgroundcolor indicates the utility for the blue vessel.
The higher the utility, the brighter the color.
vessel, the influence of u
p
can be identified as a circle
around the green vessel. All in all, the behavior in this
simple situation can be reproduced by the proposed
approach.
For the situation same route, the two vessels do
not need to avoid a direct collision, as both vessels
can sail with enough distance to each other. Thus, for
the next situation, the vessels need to take action in
order to avoid a collision. The situation crossing as
well as the simulation results can be seen in Fig. 10,
Figure 10: Situation crossing, for δ
p
= 2. Stroked lines with
squares show the recorded behavior, while dashed lines with
circles show the simulation results.
Fig. 11, and Fig. 12. The blue vessel in this situation
sails from right to left, while the green vessels starts
at the top going to the bottom of the figure and the red
one vice versa.
As different values for δ
p
are chosen for the simu-
lation, the impact of this parameter is easily visible.
For δ
p
= 2.5, the simulation closely resembles the
real path of the objects as depicted in Fig. 11, the
other simulations show a different behavior. In Fig.
10, no possible collision is detected. Therefore, the
vessels drive on a straight line without evasive ma-
neuvers. In Fig. 12, the vessels also detect no possible
collision, but the distance each vessel likes to keep be-
tween each other is quite large. Thus, the vessels take
maneuvers in order to maintain their distance. This
results in the red vessel passing the green on the op-
posing side compared to the recorded data.
4.2 Anomaly Detection
Only the situation crossing is used for the anomaly
detection. In order to estimate an anomaly score for
the behavior of the vessels, a new game is started for
each timestep. To give a better insight into the de-
cision process, the utility functions for the different
players at one timestep are depicted in Fig. 13, Fig.
14 and Fig. 15. As the green and blue vessel detect a
possible collision, the starboard of their utility func-
tion yields a greater payoff. In all cases, the utility
gained through keeping on the route is clearly visible.
Further, the higher payoff for decreasing the distance
to the destination as well as the lower payoff in the
proximity of other players is evident.
ICAART 2017 - 9th International Conference on Agents and Artificial Intelligence
204
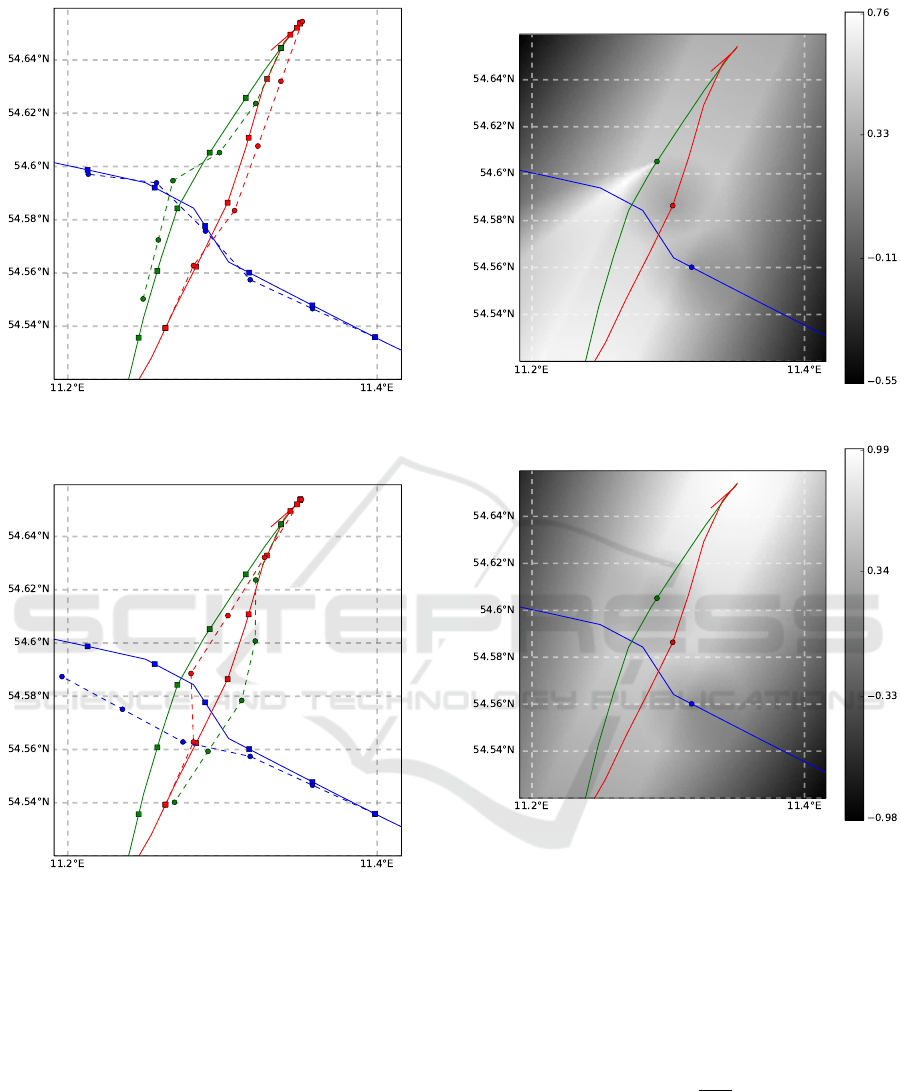
Figure 11: Situation crossing, for δ
p
= 2.5. Stroked lines
with squares show the recorded behavior, while dashed lines
with circles show the simulation results.
Figure 12: Situation crossing, for δ
p
= 3. Stroked lines with
squares show the recorded behavior, while dashed lines with
circles show the simulation results.
The simulation results for each timestep are shown
in Fig. 16. In addition, the possible next steps for the
blue player at one timestep are depicted by showing
the utility. For its calculations, the other vessels are
supposed to behave like the Nash bargaining solution
would suggest. Because of an imminent collision in
case of just going straight, the starboard side of the
vessel yields higher payoffs in this timestep.
An anomaly score estimates whether the real be-
havior of the vessels is similar to the simulation.
There are several ways to incorporate different scores
and distance measures into an anomaly score. One is
using the distance between the real position and the
Figure 13: Situation crossing. Utility for the green vessel.
Figure 14: Situation crossing. Utility for the red vessel.
simulated, another is using the payoffs for each indi-
vidual vessel of the real behavior (u
real
) and the simu-
lated one (u
sim
).
In Fig. 17, the distance between the predicted
position and the real position for each timestep in
the situation crossing is shown, while in Fig. 18,
an anomaly score is given for each vessel at each
timestep by calculating
a = 1 −
u
real
u
sim
.
As seen in Fig. 17, the distance between the simu-
lated and real behavior is always quite large. Compar-
ing the two figures, it is evident, that the deviation in
the position does not imply, that the simulation or the
real data are actually a better solution for an individ-
ual player: Except for the second timestep, the utility
A Multi-agent Approach to Model and Analyze the Behavior of Vessels in the Maritime Domain
205
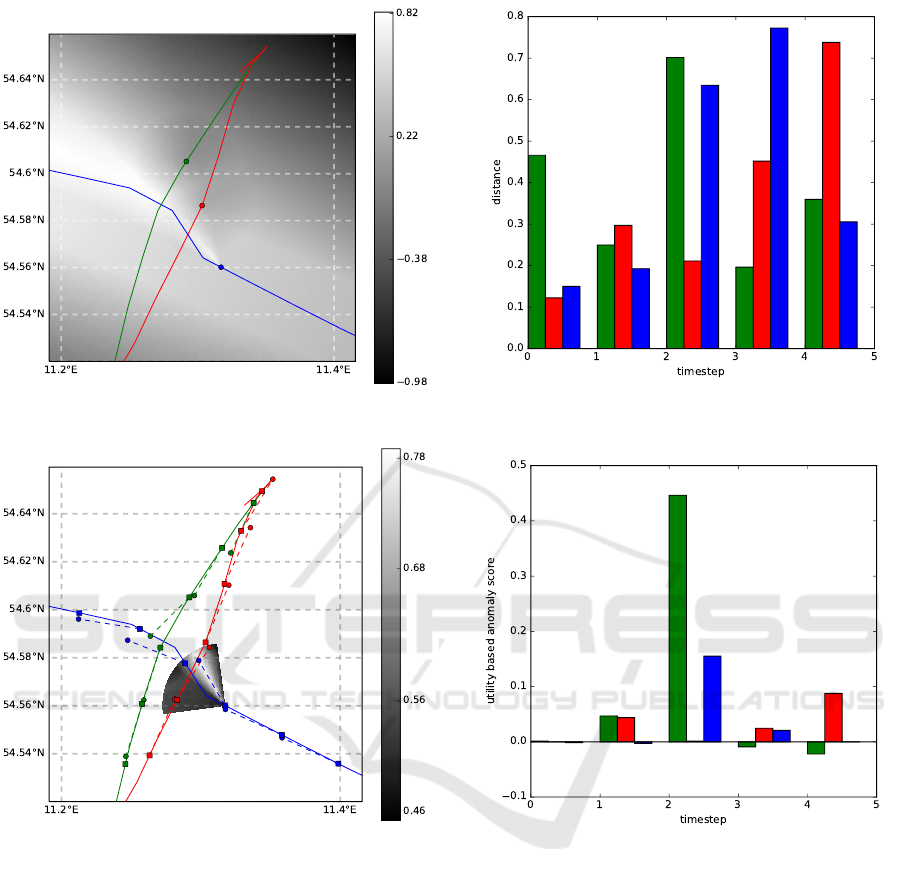
Figure 15: Situation crossing. Utility for the blue vessel.
Figure 16: Situation crossing, δ
p
= 2.5. Stroked lines with
squares show the recorded behavior, while dashed lines with
circles show the simulation results. The area with the gradi-
ent represents the possible utility for the blue vessel at one
timestep.
ratio is always smaller than 0.1.
Furthermore, the utility gained for the real action
is sometimes greater than the simulated one, because
of the estimated maximal speed. As the Nash bargain-
ing solution estimates a fair payoff distribution for all
players, there might be a strategy for a single player
yielding a greater payoff for this player.
All in all, the utility ratio seems to be a valid
anomaly score. E.g., a high anomaly score for the
green and blue vessel are estimated in the second
timestep in Fig. 18. In Fig. 16, the green and blue
vessel do not keep as much distance in the second
timestep, as they do in the other ones. Therefore, this
Figure 17: Situation crossing. Distance in km between the
simulated and the recorded position for each timestep.
Figure 18: Situation crossing. Utility ratio for each
timestep.
behavior can actually be seen as an anomaly. In the
third timestep the blue vessel also deviates from the
simulation, but the utility deviates only slightly.
5 CONCLUSIONS
It is shown, that the introduced approach can be used
to simulate the behavior of vessels in the maritime do-
main. This is achieved by comparing the simulation
results with the recorded trajectories of up to three
different vessels interacting with each other.
Furthermore, a method to use the simulation for
anomaly detection is given. The ratio between the
gained utility in the simulation and in the recorded
ICAART 2017 - 9th International Conference on Agents and Artificial Intelligence
206

data seems to be a good measure for the anomaly
score.
6 FUTURE WORK
So far, the algorithm was evaluated by using simula-
tions as well as real data. But only situations with up
to three different vessels are analyzed. As the inter-
action of more vessels can be of interest in areas with
dense traffic, this should be evaluated.
The parameters for the utility function and the
possible strategies are chosen by hand. Therefore,
a system for choosing the parameters automatically
based on recorded data should be developed. Addi-
tionally, a more realistic motion model might increase
the accuracy of the algorithm.
As the algorithm itself does not consider the ap-
plication domain, it should be possible to develop the
utility functions for other domains. Further, the al-
gorithm could be used to model suspicious behavior.
Therefore, another interesting topic is the develop-
ment and evaluation of an utility function describing
a specific situation of interest.
ACKNOWLEDGEMENTS
The underlying projects to this article are funded by
the WTD 81 of the German Federal Ministry of De-
fense. The authors are responsible for the content of
this article.
REFERENCES
Agogino, A. K. and Tumer, K. (2012). A multiagent ap-
proach to managing air traffic flow. Autonomous
Agents and Multi-Agent Systems, 24(1):1–25.
Anneken, M., Fischer, Y., and Beyerer, J. (2016). Anomaly
detection using b-spline control points as feature
space in annotated trajectory data from the maritime
domain. In Proceedings of the 8th International
Conference on Agents and Artificial Intelligence, vol-
ume 2, pages 250–257.
Cazzanti, L., Millefiori, L. M., and Arcieri, G. (2015). A
document-based data model for large scale computa-
tional maritime situational awareness. In Big Data
(Big Data), 2015 IEEE International Conference on,
pages 1350–1356.
de Vries, G. K. D. and van Someren, M. (2014). An analysis
of alignment and integral based kernels for machine
learning from vessel trajectories. Expert Systems with
Applications, 41(16):7596 – 7607.
Fischer, Y., Reiswich, A., and Beyerer, J. (2014). Model-
ing and recognizing situations of interest in surveil-
lance applications. In Cognitive Methods in Situation
Awareness and Decision Support (CogSIMA), 2014
IEEE International Inter-Disciplinary Conference on,
pages 209–215.
Ljungberg, M. and Lucas, A. (1992). The oasis air traffic
management system. In Proceedings of the Second
Pacific Rim International Conference on Artificial In-
telligence, PRICAI 92, Seoul, Korea.
Mano, J.-P., Georg
´
e, J.-P., and Gleizes, M.-P. (2010). Adap-
tive Multi-agent System for Multi-sensor Maritime
Surveillance, pages 285–290. Springer Berlin Heidel-
berg, Berlin, Heidelberg.
Millefiori, L. M., Braca, P., Bryan, K., and Willett, P.
(2016). Long-term vessel kinematics prediction ex-
ploiting mean-reverting processes. In 2016 19th In-
ternational Conference on Information Fusion (FU-
SION), pages 232–239.
Nash, J. F. (1950). The bargaining problem. Econometrica,
18(2):155–162.
Soleimani, B. H., Souza, E. N. D., Hilliard, C., and Matwin,
S. (2015). Anomaly detection in maritime data based
on geometrical analysis of trajectories. In Information
Fusion (Fusion), 2015 18th International Conference
on, pages 1100–1105.
Storn, R. and Price, K. (1997). Differential evolution – a
simple and efficient heuristic for global optimization
over continuous spaces. Journal of Global Optimiza-
tion, 11(4):341–359.
Yang, C., Hu, Q., and Shi, C. (2007). Automated colli-
sion resolution for vessel traffic management by us-
ing cooperative multi-agent negotiation. In 2007 7th
International Conference on ITS Telecommunications,
pages 1–6.
A Multi-agent Approach to Model and Analyze the Behavior of Vessels in the Maritime Domain
207
