
Automatic Polyp Detection from Endoscope Image using Likelihood Map
based on Edge Information
Yuji Iwahori
1
, Hiroaki Hagi
1
, Hiroyasu Usami
1
, Robert J. Woodham
2
, Aili Wang
3
, M. K. Bhuyan
4
and Kunio Kasugai
5
1
Department of Computer Science, Chubu University, Kasugai, 487-8501, Japan
2
Department of Computer Science, University of British Columbia, Vancouver, B.C., V6T 1Z4, Canada
3
Higher Education Key Lab for Measuring & Control, Harbin University of Science and Technology, Harbin, China
4
Department of Electronics and Electrical Engineering, Indian Institute of Technology Guwahati, Guwahati, 781039, India
5
Department of Gastroenterology, Aichi Medical University, Nagakute, 480-1195, Japan
iwahori@cs.chubu.ac.jp, {hagi
g, usami}@cvl.cs.chubu.ac.jp, woodham@cs.ubc.ca, aili925@hrbust.edu.cn,
mkb@iitg.ernet.in, kuku3487@aichi-med-u.ac.jp
Keywords:
Polyp Detection, Endoscope Image, Likelihood, HOG, Random Forests.
Abstract:
An endoscope is a medical instrument that acquires images inside the human body. This paper proposes a
new approach for the automatic detection of polyp regions in an endoscope image by generating a likelihood
map with both of edge and color information to obtain high accuracy so that probability becomes high at
around polyp candidate region. Next, Histograms of Oriented Gradients (HOG) features are extracted from
the detected region and random forests are applied for the classification to judge whether the detected region
is polyp region or not. It is shown that the proposed approach has high accuracy for the polyp detection and
the usefulness is confirmed through the computer experiments with endoscope images.
1 INTRODUCTION
Medicine is an important area as the application of
computer vision. Endoscopy allows medical practi-
tioners to observe the interior of hollow organs and
other body cavities in a minimally invasive way. Di-
agnosis involves both shape detection and the assess-
ment of tissue state. Here, we consider a general pur-
pose endoscope, of the sort still most widely used in
medical practice. There are many different kinds of
polyp shape and size in endoscope images. Polyps
are usually found via endoscopy but polyps can be
missed. The main factor to find polyp depends on the
empirical skill of medical doctors. Automatic detec-
tion of polyps, with high accuracy, is an important
aid to medical practice. Diagnosis typically requires
polyp removal and biopsy.
Some previous approaches (Ameling et al., 2009)
(Karkanis et al., 2003) (Iakovidis et al., 2005)
are patch-based approaches which introduce features
of Color Wavlet Covariance (CWC), Local Binary
Pattern (LBP), Gray-Level Co-Occurrence Matrix
(GLCM), which is used for the texture analysis, re-
spectively. Another approach (Alexandre et al., 2008)
learns color and xy position coordinates partitioned in
the local window, then classifies if a polyp is included
or not in the each region. These are patch-based ap-
proaches and extract features and perform classifica-
tion. Patch-based approach may include the problem
that detection ratio depends on patch size and position
of polyp.
Paper (Li and Meng, 2011) uses capsule endo-
scope images as input and extracts the Rotational In-
variant Uniform Local Binary Pattern (RIULBP), and
statistical value are obtained from intensity histogram
as texture features. Classifier is designed to learn
these features for the polyp detection. The approach
has some difficulty in detecting small polyp with non-
textures.
On the other hand, the geometric feature is used
in the approach (Hwang et al., 2007) so that polyp
appears with ellipse form in general. The approach
detects polyp with only the ellipse fitting without any
learning. Geometrical feature based approach is ro-
bust to the small polyp, but some segmentation is nec-
essary to detect polyps with edge information, that
is, the detection performance depends on the level of
edge extraction.
402
Iwahori, Y., Hagi, H., Usami, H., Woodham, R., Wang, A., Bhuyan, M. and Kasugai, K.
Automatic Polyp Detection from Endoscope Image using Likelihood Map based on Edge Information.
DOI: 10.5220/0006189704020409
In Proceedings of the 6th International Conference on Pattern Recognition Applications and Methods (ICPRAM 2017), pages 402-409
ISBN: 978-989-758-222-6
Copyright
c
2017 by SCITEPRESS – Science and Technology Publications, Lda. All r ights reserved
Another approach proposed in paper (Iwahori
et al., 2013) is Hessian Filter based approach, where
Hessian filter emphasizes the blob-like structure and
extracts some polyp candidates with segmentation.
Some texture-based features extracted from each
polyp candidate region are classified with SVM and
judged whether the candidate region is polyp region
or not. This approach is not patch-based but many re-
gions can be extracted as the polyp candidate region.
Each candidate region is classified using SVM as the
2nd step.
Paper (Bernal et al., 2015) extracts the edge with
the valley which has smaller value of image intensity
in comparison with the surrounding points. Polyp is
detected by generating the map which has the larger
value for the higher possibility of exist of the polyp
based on the edge. This approach is reasonable, but
the blood vessel is also extracted as edge. When the
blood vessel has the similar shape as the edge or the
image has many blood vessels, the approach has the
problem.
This paper further improves the polyp detection
problem to have the higher accuracy based on both
edge-based features and shape-based features. The
approach constructs reliable likelihood map on the
polyp candidates and proposes an automatic detection
of polyp with higher accuracy in classification.
2 AUTOMATIC POLYP
DETECTION
Proposed approach generates the likelihood map us-
ing the edge information using the gradient which is
obtained by multi-scale. The polyp candidate region
is extracted using the likelihood map and classifier is
applied to detect the polyp using SVM. Proposed ap-
proach is explained here.
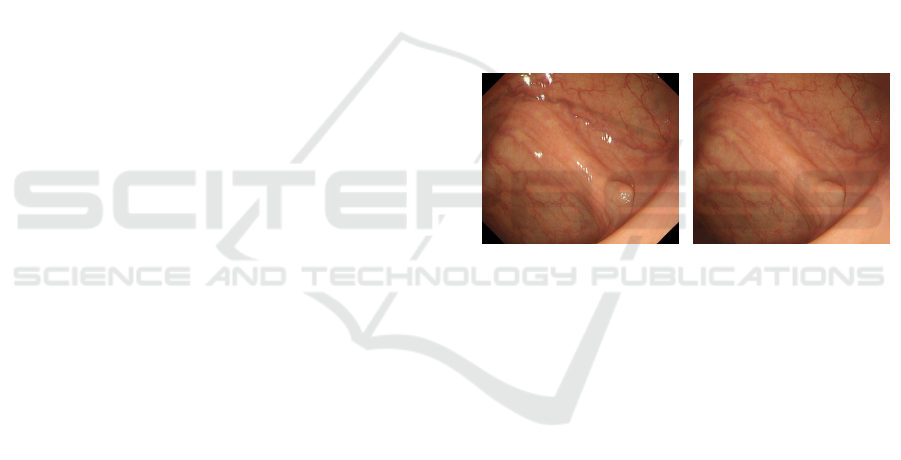
2.1 Removal of Specular Reflectance
Component
Many specular reflectance components are observed
in endoscope image and this specular reflectance
component should be removed to detect the exact
polyp. Proposed approach extracts the specular re-
flectance components (Shen and Cai, 2009) and inter-
polation is applied to the extracted region. The pro-
cess is shown below.
First, the minimum value of RGB for each pixel is
obtained using Eq.(1).
V
min
(x,y) = min
i
{V
i
(x,y)} (1)
where V represents the image, i represents the RGB
channel, x and y represent image coordinates. Next,
mean µ
v
and standard deviation σ
v
of V
min
are ob-
tained and threshold value T
v
is determined using
Eq.(2).
T
v
= µ
v
+ 0.5σ
v
(2)
Offset τ(x, y) is obtained using T
v
by Eq.(3).
τ(x,y) =
T
v
if V
min
(x,y) > T
v
V
min
(x,y) otherwise
(3)
Next, specular reflectance component β is obtained
using V
min
and offset τ.
β(x,y) = V
min
(x,y) − τ(x,y) (4)
The region which has the larger value of obtained β is
interpolated by the inpainting. Result in which the
specular reflectance component was removed from
the original endoscope image is shown in Fig.1.
(a) Original Image (b) Removal Image
Figure 1: Removal of Specular Reflectance Component.
2.2 Edge Detection
Proposed approach uses gradient of image intensity
for edge detection. However, blurring sometimes oc-
curs in endoscope video or noise and textures may
affect edge detection. Firstly gaussian filter is applied
to detect correct edge by reducing these effects.
Simple apply of edge detection for the endoscope
image generates edges including polyp and other
blood vessels. When edge detection is applied to
polyp detection using edge shape, the operation some-
times becomes useless since blood vessel is detected
as polyp candidate based on the shape information.
Proposed approach detects edge by varying the
scale σ of Gaussian function for the convolution to
reduce the detection of blood vessel. When the value
of the scale σ is small, detailed edge including blood
vessel is also detected except the polyp and inner lin-
ing, while when the value of the scale σ is large, rough
edge is detected with the bold edge, instead blood ves-
sel is not detected. The approach varies the scale σ,
Automatic Polyp Detection from Endoscope Image using Likelihood Map based on Edge Information
403
reduces the detection of blood vessel as edge
and prevents to become bold edge in the result image.
In addition, edge intensity E is obtained by mul-
tiplying these detected edge by edge which is ob-
tained using morphology gradient processing which
subtracts the image generated by the contraction pro-
cess of morphology operation from the image gener-
ated by the expansion process of the morphology op-
eration.
The procedures are shown as follows.
Step1. Gaussian function G(x,y) is generated and
its first directional derivatives G
x
(x,y) and
G
y
(x,y) are obtained. Further, its second
derivatives G
xx
(x,y) and G
yy
(x,y) are also ob-
tained.
Step2. Image L(x,y) and G
xx
(x,y), G
yy
(x,y) are con-
volved and derivatives L
xx
(x,y) and L
xx
(x,y)
are obtained.
Step3. L
max
is obtained from L
xx
and L
yy
.
L
max
(x,y) = max(L
xx
(x,y),L
yy
(x.y)) (5)
Step4. Repeat Step2 to Step4 by varying the scale σ
of Gaussian function.
Step5. Sum of L
max
obtained for each scale σ is ob-
tained. Here n
s
represents a number of differ-
ent scale σ.
L
sum
(x,y) =
n
s
∑
i
L
max,i
(x,y) (6)
Step6. Morphology gradient processing is applied to
the input image L and edge intensity E is ob-
tained by multiplying L
sum
.
2.3 Generation of Likelihood Map
Paper (Bernal et al., 2015) generates likelihood map
based on edge shape and its intensity from the view-
point of the condition that polyp edge is part of circu-
lar shape. Proposed approach tries to obtain the map
which takes lower value for except polyp by adding
the weight using the bright/dark color in the likeli-
hood map generated by (Bernal et al., 2015). Proce-
dure to generate likelihood map is shown as follows.
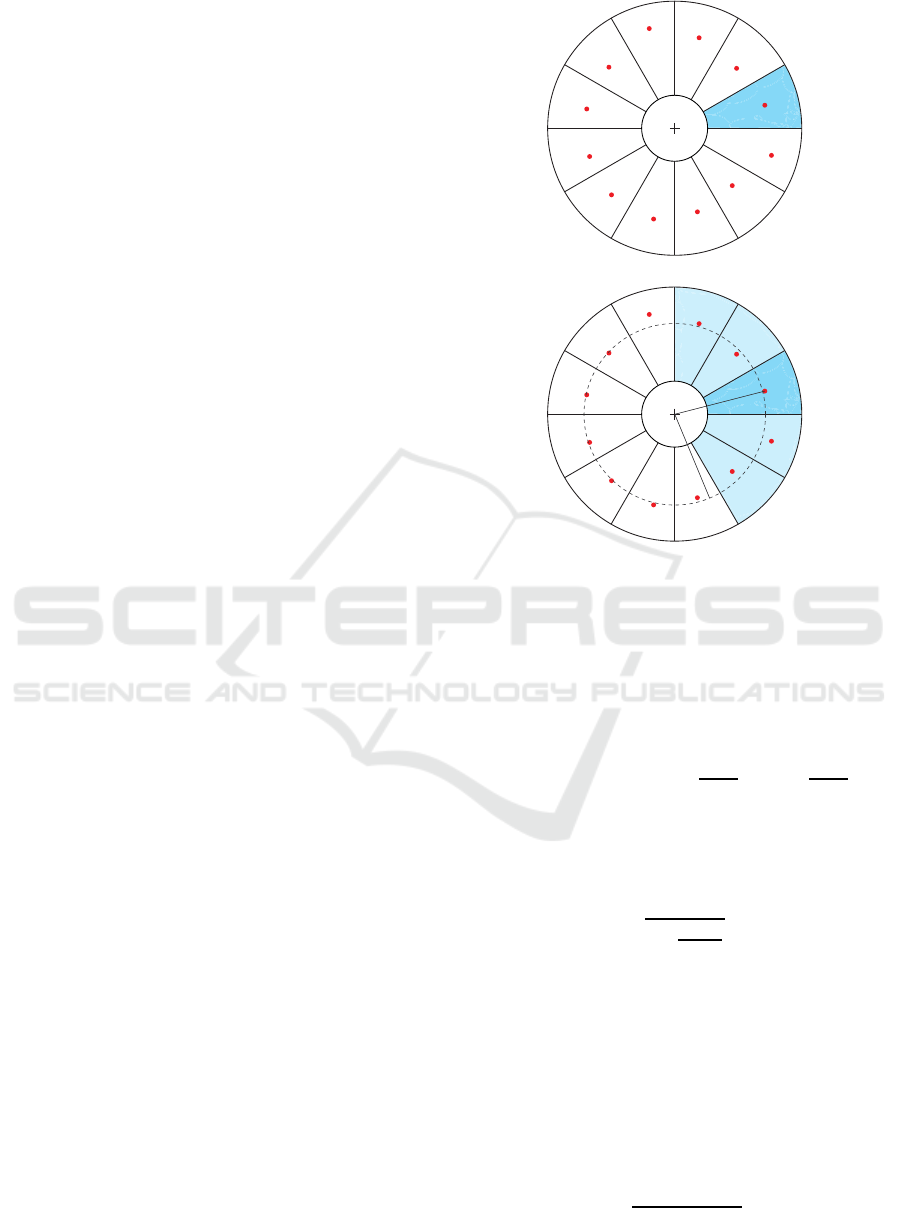
Outline to generate likelihood map by the proposed
approach is shown in Fig.2.
A circle with anysize is generated, whose center is
located at the interesting pixel p. Circle is divided into
multiple regions with any value of degree. Maximum
value S
max
i
of edge intensity E is obtained for each
divided region S
i
. This operation is shown in Fig.2(a).
S
max
i
= max
S
i
(E) (7)
p
max
i
S
i
S
(a) Maximum Value S
max
i
p
max
i
S
d
i
d
i
~
i
S
max
i+1
S
max
i+2
S
max
i-1
S
max
i-2
S
(b) Distance d
i
Figure 2: Outline to Generate Likelihood Map.
Next, position of obtained S
max
i
is obtained as p
max
S
i
.
Euclid distance d
i
is calculated between p and p
max
S
i
as shown in Fig.2(b).
Median of the distance d is obtained in the region
S
i
with its front and rear regions.
˜
d
i
= median(d
j
) j ∈
i−
l − 1
2
,··· ,i+
l − 1
2
(8)
where l is the number of regions when median is cal-
culated. Weight γ
i
is calculated from Eq.(9) using dis-
tances d
i
and
˜
d
i
.
γ
i
=
1
1+
|d
i
−
˜
d
i
|
˜
d
i
(9)
where γ
i
becomes larger when the distance d between
interesting pixel p and the maximum value S
max
i
be-
comes similar for the sequential regions since the
maximum value S
max
i
is judged as part of edge of a
circle.
Next, α
i
is obtained from Eq.(10) using mean of
(R
d
i
>d
i
) and value of R component (R
p
) of interesting
pixel whose distance has larger than the distance d
i
.
α
i
=
R
p
mean(R
d
i
>d
i
)
(10)
ICPRAM 2017 - 6th International Conference on Pattern Recognition Applications and Methods
404
Weight α
′
i
is obtained by applying sigmoid func-
tion to the obtained α
i
. α
′
i
becomes larger when in-
tensity of interesting pixel is larger than mean value
of surrounding pixels, while smaller for the inverse
case. Inside of polyp becomes brighter and outside
becomes darker in endoscope image. Edge may be
part of polyp if weight α
′
i
takes larger value, while it
may be part of inner lining if α
′
i
takes smaller value.
Next,
ˆ
S
max
i
is obtained by multiplying the maxi-
mum value S
max
i
, weight of distance γ
i
and weight of
color α
′
i
.
ˆ
S
max
i
= α
′
i
γ
i
S
max
i
(11)
Finally, the median MS
p
of
ˆ
S
max
i
obtained for each
region is obtained.
MS
p
= median
i
(
ˆ
S
max
i
) i ∈ [1, · · · , n] (12)
where n is the divided number of a circle. Obtained
MS
p
is used as value of likelihood map correspond-
ing to the interesting pixel. Candidate region is ex-
tracted from the region which has more than 80 per-
centages of the maximum value of generated likeli-
hood map. This threshold is obtained from the expe-
rience of many trials. Size of candidate region is de-
termined by the distance d
max
between the interesting
pixel and maximum edge intensity inside a judgement
circle. Rectangle with a side 2d
max
whose center is lo-
cated at an interesting pixel is extracted as a candidate
region.
2.4 Classification by Random Forests
Paper (Iwahori et al., 2013) uses SVM with fea-
ture selection and boosting is applied to construct a
strong classifier. As boosting tends to be sensitive
to noise data, the proposed approach uses random
forests (Breiman, 2001) which is more robust to the
noise data. Random Forests is introduced to construct
classifier with high accuracy by combining low cor-
related weak classifiers. Random forests use decision
trees as weak classifiers.
The whole learning data is
~
S is learned with learn-
ing data
~
S
0
∈
~
S which is randomly selected for each
decision tree. Node of the learning data
~
S
0
allows the
overlapping of data. Split function at node j of learn-
ing data
~
S
0
is given by Eq.(13).
h(~v,θ
j
) ∈ {0,1} (13)
~v represents data which reached node j, and θ repre-
sents the parameter to decide the split function, where
θ=(φ,ψ,τ). φ means the filter which extracts several
features from d-dimensional data~v, ψ means the split-
ting criteria and τ means the threshold for the split.
Decision tree is constructed until data splitting cannot
be done anymore.
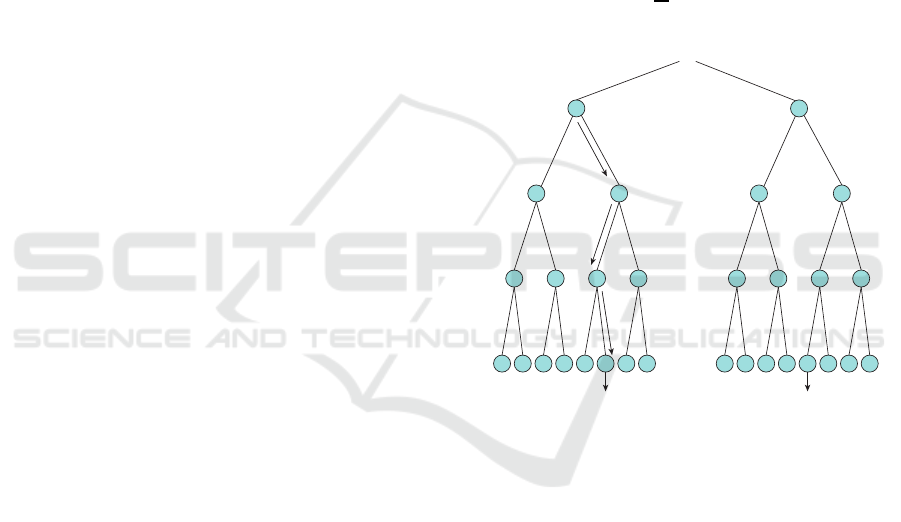
The input data v is input to all decision trees in
classification by Random forests as shown in Fig.3.
In each decision tree, it is decided which to proceed
to either the left or right child node according to the
split function h assigned to the node, and eventually
reaches the leaf node Classification is done by a ma-
jority vote of the result obtained by each decision tree.
The result is obtained by converging posterior proba-
bility derived each decision tree with the following
Eq.(14), where p
t
(c|v) is the predicted value of the
a posteriori probability obtained by the t-th decision
tree.
p(c|v) =
1
T
T
∑
t=1
p
t
(c|v) (14)
v
h(v,θ)
P₁(c|v) PT (c|v)
Figure 3: Random Forests.
2.5 Integration of Detected Results
When the approach is applied for the detection of
polyp in endoscope image, multiple rectangles for
polyp candidate are detected. Here k-means++
(Arthur and Vassilvitskii, 2007) is used to integrate
the detection results for improving accuracy.
k-means++ is an algorithm to find the cluster cen-
ter. Cluster center corresponds to the point which
minimizes the variance inside classes, in other words,
the point which minimizes the squared sum of dis-
tance between the point and each data point inside
a class. k-means++ is an improvement of k-means.
Point is randomly selected and cluster center is deter-
mined. After that, data which have not been selected
to cluster center become cluster center with the prob-
ability which is proportional to the distance between
its nearest neighbor cluster center and all data.
Automatic Polyp Detection from Endoscope Image using Likelihood Map based on Edge Information
405
Algorithm of integrating detected results is shown
as follows.
Step1. Data are randomly selected and initial point is
determined at the center of clusters
~
C
1
Step2. Distance D(x
i
) between data and center of
clusters
~
C
j
to which the data belong is calcu-
lated.
Step3. Let
D(x
i
)
2
∑
N
i
D(~x
i
)
2
be the weight, and the data which
are more than random threshold at first is se-
lected and assigned as the center of cluster.
Step4. Class
~
L which belongs to all data is calculated
again.
Step5. Repeat Step2 to Step4 until number of clus-
ters becomes k.
Step6. k-means is applied to the center of clusters
~
C
obtained by Step5 as an initial point.
Step7. If the distance between resulting clusters of k-
means is less than the threshold, let k = k − 1
and start from Step1.
Center of clusters for detected result is calculated
by k-means++ and each cluster is represented as a
rectangle. Size of rectangle is taken as the median
of sizes of candidate regions judged as the same clus-
ter. Detected rectangles are integrated by k-means++
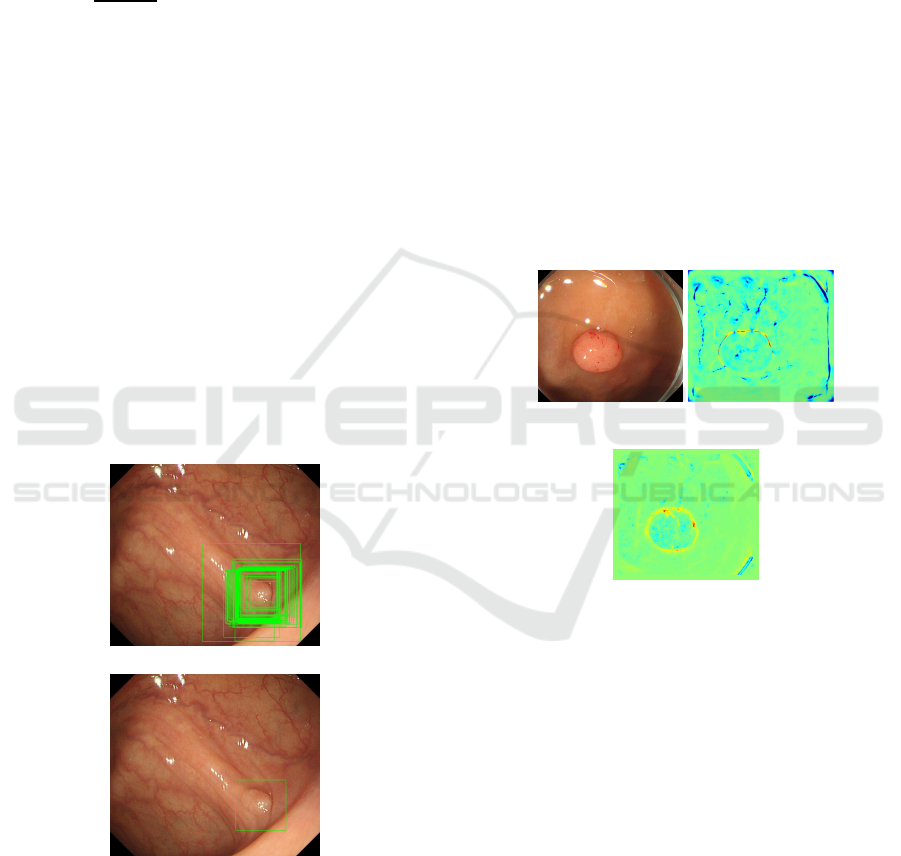
and integrated result is shown in Fig.4.
(a) Before Integration
(b) After Integration
Figure 4: Integrated Result.
3 EXPERIMENTS
Experiment is demonstrated to confirm the usefulness
of the proposed approach in comparison with the pa-
per (Iwahori et al., 2013) and paper (Bernal et al.,
2015). Edge detection to extract candidate region and
obtained likelihood map using the edge are compared
with that of paper (Bernal et al., 2015). Next, accu-
racy with classifier applied for the candidate region is
evaluated with paper (Iwahori et al., 2013).
3.1 Edge Detection
Fig.5 and Fig.6 shows the original image, edge image
obtained by paper (Bernal et al., 2015) and proposed
approach respectively. Here, color close to red rep-
resents the strong edge intensity, while color close to
blue represents the weak edge intensity. Fig.5 shows
the image without blood vessel, while Fig.6 shows the
image with blood vessel.
(a) Original Image (b) Paper(Bernal
et al., 2015)
(c) Proposed Ap-
proach
Figure 5: Edge Detection 1.
It is shown that edge of polyp is detected by both
of paper (Bernal et al., 2015) and proposed approach
from Fig.5. While paper (Bernal et al., 2015) de-
tects edge of blood vessel from Fig.6 and proposed
approach reduces edge of blood vessel. It is shown
that edge detection by proposed approach reduces the
detection of blood vessel and this is clear advantage
of the proposed approach.
3.2 Likelihood Map
Fig.7 and Fig.8 show the likelihood map obtained by
paper (Bernal et al., 2015) and that by the proposed
approach for the comparison.
Likelihood map represents that color close to red
has the high possibility of polyp, while color close
ICPRAM 2017 - 6th International Conference on Pattern Recognition Applications and Methods
406
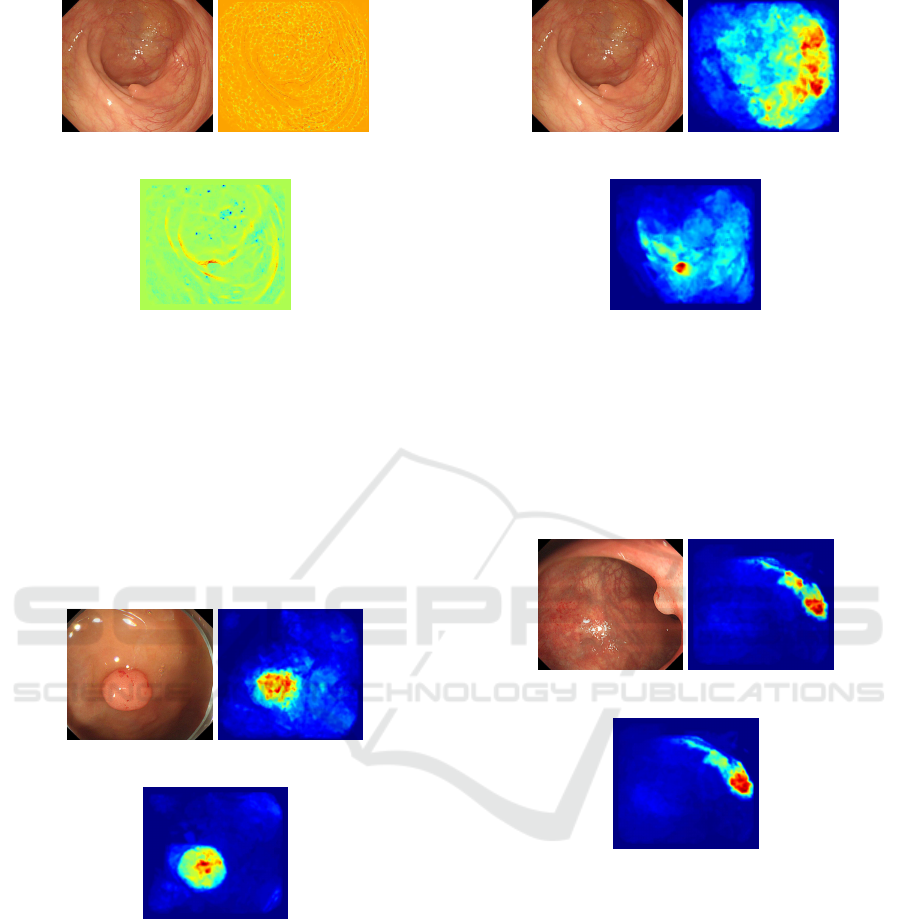
(a) Original Image (b) Paper (Bernal
et al., 2015)
(c) Proposed Ap-
proach
Figure 6: Edge Detection 2.
to blue has the low possibility of polyp, respectively.
Here the radius of judgement circle was 150 pixels,
divided angle of judgement circle was 30 degrees and
l to obtain the distance
˜
d
i
was 5. Pixels within the ra-
dius 10 pixels around interesting pixel was for out of
calculation. This is done to reduce the incorrect de-
tection for interesting pixel which has high likelihood
on the strong edge or around the edge.
(a) Original Image (b) Paper (Bernal
et al., 2015)
(c) Proposed Ap-
proach
Figure 7: Likelihood Map 1.
Fig.7 shows that large values are obtained on
polyp when there is no blood vessel in an image,
while paper (Bernal et al., 2015) gives large value
around blood vessel in Fig.8 when blood vessel exists
in an image. While the proposed approach gives large
value on polyp in both cases and stable results are ob-
tained. This is because paper (Bernal et al., 2015)
assumes that region surrounded by the edge is polyp
and when there are many blood vessels, likelihood be-
comes high value. While the proposed approach tends
(a) Original Image (b) Paper (Bernal
et al., 2015)
(c) Proposed Ap-
proach
Figure 8: Likelihood Map 2.
not to detect blood vessel as edge, and the proposed
approach has advantage for detection of candidate re-
gion of polyp. Next, weight of color was confirmed
for the usefulness. Fig.9 shows likelihood map with
weight of color and that without weight of color.
(a) Original Image (b) Map without
Weight of Color
(c) Map with Weight
of Color
Figure 9: Weight of Color.
Fig.9 shows that weight of color is also useful
since inner edge has small value and polyp has large
value. When weight of color is not used, it is shown
that inner edge has large value of map.
3.3 Evaluation of Accuracy
Learning data set used in the experiment is around
2400 pixel for small image data to around 240000
pixels for large image data. Resolution and number
of polyp images are around 1100 × 1000 pixels and
154 images. Test data set used is a total of 440 im-
ages with 1000 × 869 pixels from three endoscope
Automatic Polyp Detection from Endoscope Image using Likelihood Map based on Edge Information
407
videos. Mask image of polyp is prepared by manual
operations and used to judge whether detected region
is polyp or not. As an approach of paper (Iwahori
et al., 2013), strong classifier is constructed by Ad-
aboost using each SVM after applying feature selec-
tion as a weak classifier. Parameters of SVM were
determined by the grid search. Number of trees of
random forests was set to be 500 in the proposed ap-
proach.
Sensitivity, Specificity and Accuracy were calcu-
lated using the following equations as the evaluation
of classification, where sensitivity represents the cor-
rect ratio of polyp region, specificity represents the
correct ratio of non-polyp region, and accuracy repre-
sents the correct ratio for whole test samples.
Sensitivity =
Number of Correct Positive Predictions
Number of Positives
(15)
Specificity =
Number of Correct Negative Predictions
Number of Negatives
(16)
Accuracy =
Number of Correct Predictions
Number o f Positives+ Number of Negatives
(17)
Evaluation was done using endoscope movie
taken in 3 different scenes. The result is shown in
Table 1. Here, proposed approach is run for five
times and its mean was used for the evaluation re-
sult considering randomness of the approach. Upper
line of each criteria shows evaluation by Paper (Iwa-
hori et al., 2013) and lower line of each criteria shows
evaluation by proposed approach.
Table 1: Evaluation of Accuracy [%].
Scene 1 Scene 2 Scene 3 Total
Sensitivity 59.83 92.86 19.89 38.00
77.58 94.61 96.67 81.68
Specificity 78.65 81.32 77.38 77.70
55.71 66.02 81.57 78.22
Accuracy 77.83 81.44 76.89 77.22
76.31 78.32 83.08 79.84
Table 1 suggests that proposed approach gives
higher sensitivity but lower specificity than paper
(Iwahori et al., 2013). Important goal is not to fail
in detection of polyp and approach with higher sensi-
tivity has usefulness in polyp detection.
Each result of five trials of proposed approach is
shown in Table 2.
Proposed approach has randomness but it is con-
firmed that five times trials gives polyp detection with
almost the same level of accuracy.
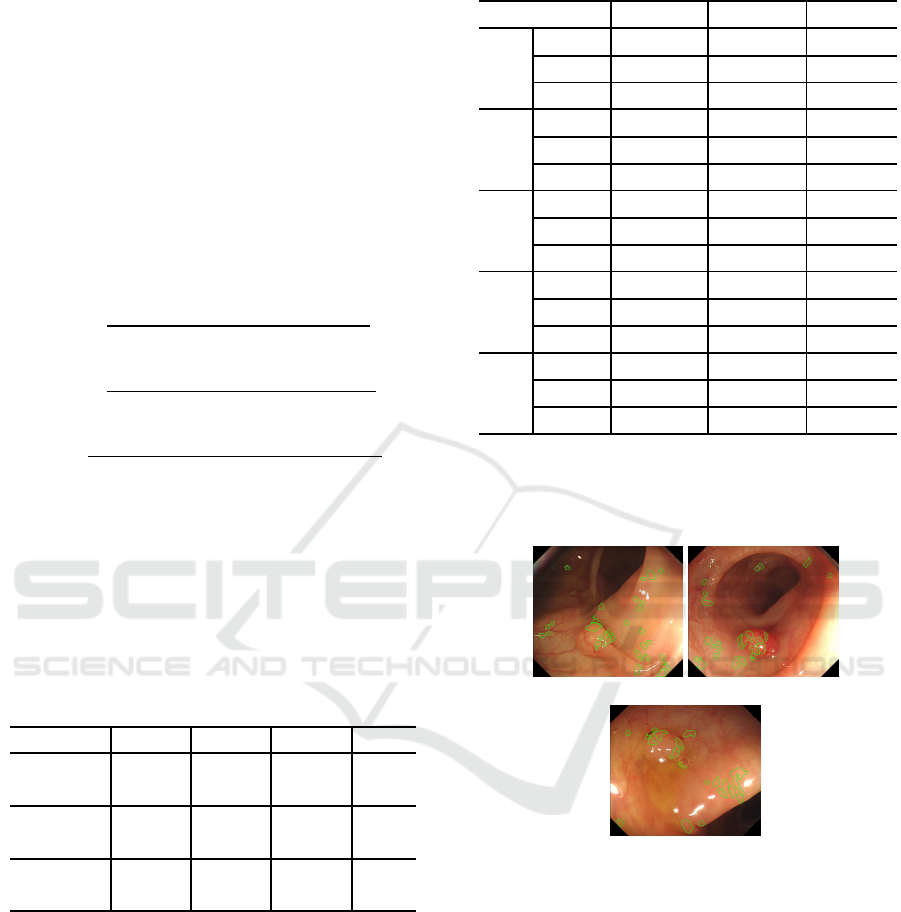
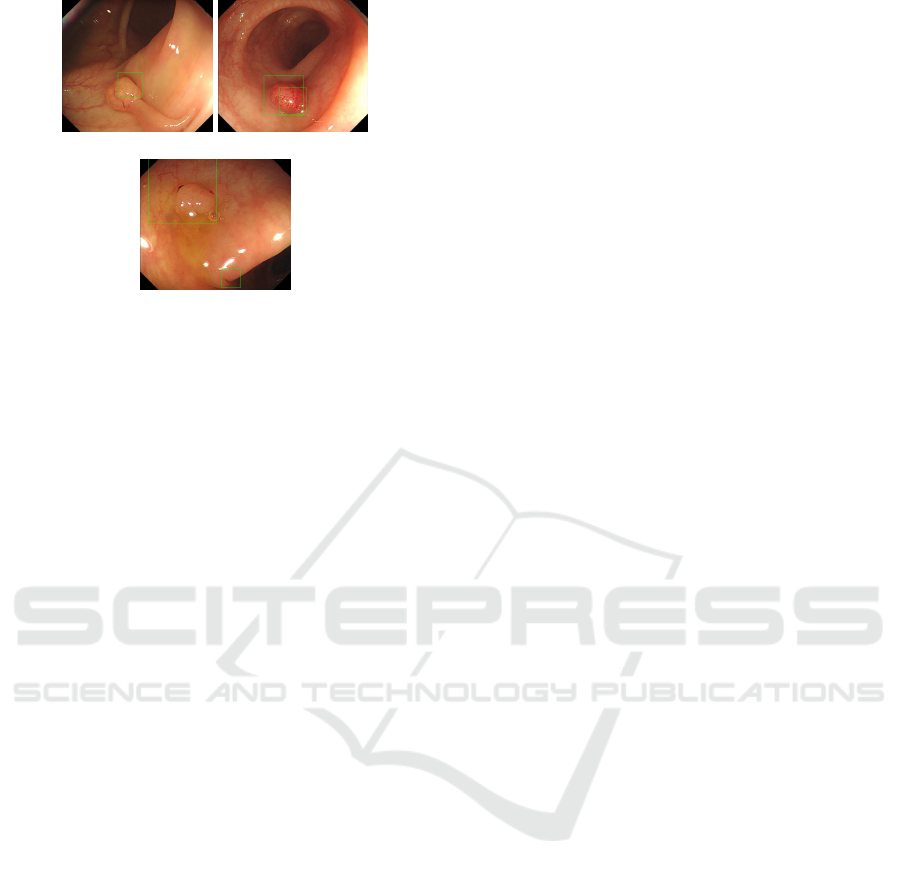
Detected result by paper (Iwahori et al., 2013) is
shown in Fig.10 and that by proposed approach is
shown in Fig.11. Here, the region with green color
Table 2: Evaluation of Accuracy in Each Trial [%].
Sensitivity Specificity Accuracy
1st
Scene 1 77.24 56.41 76.04
Scene 2 95.31 65.82 78.51
Scene 3 97.20 80.18 81.89
2nd
Scene 1 78.48 53.53 77.04
Scene 2 94.22 68.64 79.65
Scene 3 97.20 81.94 83.47
3rd
Scene 1 81.41 49.36 79.56
Scene 2 96.15 62.45 76.95
Scene 3 96.47 80.92 82.48
4th
Scene 1 75.46 57.69 74.43
Scene 2 95.19 63.27 77.01
Scene 3 96.17 80.74 82.29
5th
Scene 1 75.30 61.54 74.51
Scene 2 92.18 69.91 79.49
Scene 3 96.32 84.07 85.30
is the resulting region recognized as polyp. Proposed
approach represents an integrated result with detected
rectangles.
(a) Scene1 (b) Scene2
(c) Scene3
Figure 10: Detected Result of Paper (Iwahori et al., 2013).
Fig.10 and Fig.11 show that approach of paper
(Iwahori et al., 2013) detects part of polyp but pro-
posed approach detects most part of polyp with better
detection. This is because the proposed approach uses
the distance to the edge to recognize a size of polyp
candidate region.
4 CONCLUSION
This paper proposed a novel approach to detect polyp
region automatically. The approach first detects the
polyp candidate region based on the likelihood map
ICPRAM 2017 - 6th International Conference on Pattern Recognition Applications and Methods
408
(a) Scene1 (b) Scene2
(c) Scene3
Figure 11: Detected Result of Proposed Approach.
using both of edge information and color information
of endoscope image. After detecting the candidate
region, random forests were applied to judge polyp
region automatically.
It is shown that the proposed approach gives
higher performance through the experimental evalu-
ations. Further subjects include further improvement
of accuracy by adding different combination of fea-
tures and improvement of processing speed.
ACKNOWLEDGEMENT
Iwahori’s research is supported by Japan Society for
the Promotion of Science (JSPS) Grant-in-Aid for
Scientific Research (C) (26330210) and by a Chubu
University Grant. The authors also thank lab. mem-
ber for their useful discussions.
REFERENCES
Alexandre, L., Nobre, N., and Casteleiro, J. (2008).
Color and position versus texture features for endo-
scopic polyp detection. In International Conference
on BioMedical Engineering and Informatics (BMEI
2008), Vol.2, pp.38-42.
Ameling, S., Wirth, S., Paulus, D., Lacey, G., and Vi-
larino, F. (2009). Texture-based Polyp Detecion in
Colonoscopy. In Springer Berlin Heidelberg New
York, pp.346-350. Springer.
Arthur, D. and Vassilvitskii, S. (2007). k-means++: The
Advantages of Careful Seeding. In Proceedings of the
18th annual ACM-SIAM symposium on Discrete algo-
rithms, Society for Industrial and Applied Mathemat-
ics, pp.1027-1035.
Bernal, J., Sanchez, F., G.F-Esparrach, Gil, D., Rodriguez,
C., and Vilarino, F. (2015). WM-DOVA maps for
accurate polyp highlighting in colonoscopy: Valida-
tion vs. saliency maps from physicians. In Computer-
ized Medical Imaging and Graphics, Elsevier, Vol.43,
pp.99-111.
Breiman, L. (2001). Random forests. In Machine Learning,
Vol.45, No.1, pp.5-32.
Hwang, S., Oh, J., Tavanapong, W., Wong, J., and deGroen,
P. (2007). Polyp detection in colonoscopy video using
elliptical shape feature. In International Conference
on Image Processing, Vol.2, pp.465-468. IEEE.
Iakovidis, D., Maroulis, D., Karkanis, S., and Brokos, A.
(2005). A comparative study of texture features for
the discrimination of gastric polyps in endoscopic
video. In Proceedings of 18th IEEE Symposium on
Computer-Based Medical Systems, pp.575-580.
Iwahori, Y., Shinohara, T., Hattori, A., Woodham, R.,
Fukui, S., Bhuyan, M., and Kasugai, K. (2013). Au-
tomatic Polyp Detection in Endoscope Images Using
a Hessian Filter. In Proceedings of MVA 2013, pp.
21-24. IAPR.
Karkanis, S., Iakovidis, D., Maroulis, D., Karras, D., and
Tzivras, M. (2003). Computer-aided tumor detec-
tion in endoscopic video using color wavelet features.
In IEEE Transactions on Information Technology in
Biomedicine, Vol.7, No.3, pp.141-152. IEEE.
Li, B. and Meng, M. (2011). Comparison of Several Texture
Features for Tumor Detection in CE Images. In Jour-
nal of Medical Systems, Vol.36, No.4, pp.2463-2469.
Shen, H. and Cai, Q. (2009). Simple and efficient method
for specularity removal in an image. In Applied
Optics, Optical Society of America, Vol.48, No.14,
pp.2711-2719.
Automatic Polyp Detection from Endoscope Image using Likelihood Map based on Edge Information
409
