
Using Time-Use Surveys in Multi Agent based Simulations of Human
Activity
Quentin Reynaud
1
, Yvon Haradji
2
, François Sempé
3
and Nicolas Sabouret
1
1
LIMSI, CNRS, Univ. Paris-Sud, Université Paris-Saclay, Bât 508, Campus Universitaire, 91405 Orsay, France
2
EDF RandD, EDF Lab Paris-Saclay, 7 Boulevard Gaspard Monge, 91120 Palaiseau, France
3
François Sempé AE, Paris, France
Keywords: Multi Agent based Simulation, Human Behavior Simulation, Time Use Survey.
Abstract: Human behavior simulations in multi agent systems often lack data to calibrate and qualify the
representativeness of the simulated behaviors. In this paper, we will show that massive investigations such as
time-use surveys allow us to obtain this type of data. At the present time, time-use surveys are mostly used to
validate the realism of human activity at a macroscopic level (population scale). In this paper, we present a
new method of human behavior generation that combines the use of time-use surveys to calibrate human
activities, with a multi agent system enabling simulated behaviors to gain reactivity, autonomy, coordination
and realism at a microscopic level (individual scale).
1 INTRODUCTION
During the last decades, computer simulations have
become indispensable tools in many research areas
such as energy, meteorology, geography, etc. (Law et
al., 1991). Yet, how one can calibrate models and
validate the realism of the produced activities remains
an open question (Rakha et al., 1996; Caillou and Gil-
Quijano 2012; Lacroix et al., 2013).
This is particularly true within the context of
human activities simulation, where one can find an
abundance of simulators focusing on different
aspects, such as facial expression realism (Pelachaud,
2009), crowd movement (Thalmann et al., 2007) or
the decisional process (Laird, 2012). Each of these
domains needs the development of adapted validation
methods.
Our research framework is human activity
simulation in order to study residential electricity
consumption (Amouroux et al., 2013). Many studies
deal with this type of human activity simulation in the
world of multi agent systems (MAS). Depending on
the simulation’s needs, the simulated human activities
can either be highly scripted (Ulicny and Thalmann,
2001; Sharma and Otunba, 2012) or result from the
behavior of more autonomous agents (Rao and
Georgeff, 1991; Traum et al., 2003; Shendarkar et al.,
2008). Other approaches try to combine the
advantages of both previous methods (Grosz and
Kraus, 1996; Tambe, 1997; Hubner and Sichman,
2007; Lanquepin et al., 2013).
In all these approaches, the issue arises: how to
validate the realism of the produced activities? As
many authors have shown, for example in (Gratch et
al., 2009; Darty et al., 2014), the notion of "realism"
can be viewed from several angles, depending on the
type of simulation: likelihood or frequency of
individual behavior consistent with each other over
time allowing to reproduce high-level indicators,
loyalty to the psychological level of decision making,
etc.
One way of measuring the realism of a human
behavior simulation, is to confront individuals with
their own activity simulation, following a
participatory simulation approach (Drogoul et al.,
2003; Haradji et al., 2012). However, this method
drastically lacks scalability. The amount of time
needed for the interviews and the case by case basis
of activity modelling make it impossible to simulate
a large number of individuals and measure the realism
of the simulation.
Is it possible to automate this process? In order to
do so, one needs data about the activities of a large
number of individuals, formatted in a model allowing
to objectively compare them. Yet, this data exists in
the time-use surveys (TUS)(Stinson, 1999). TUS are
daily surveys in which respondents must transcribe
Reynaud Q., Haradji Y., SempÃl’ F. and Sabouret N.
Using Time Use Surveys in Multi Agent based Simulations of Human Activity.
DOI: 10.5220/0006189100670077
In Proceedings of the 9th International Conference on Agents and Artificial Intelligence (ICAART 2017), pages 67-77
ISBN: 978-989-758-219-6
Copyright
c
2017 by SCITEPRESS – Science and Technology Publications, Lda. All rights reserved
67

their day as a series of episodes. These surveys exist
in many countries and are well standardized.
Statistical methods in the field of energy simulation
use these TUS in order to simulate human activity and
calibrate their models at a macroscopic level. The
realism of the activity produced is then measured in
terms of statistical proximity with the actual observed
behavior. In this article, we propose to use TUS to
produce realistic behavior following this statistical
definition.
We will first present some methods of human
behavior simulation in the field of multi agent
systems, as well as statistical methods using TUS in
the world of energy simulation. We will show how
ensuring the realism of behavior at a macroscopic
level is not enough to ensure the validity of individual
behavior. Moreover, we will argue that combining the
use of TUS with agent-based modelling improves the
realism of the simulated individual behaviors. We
will continue by giving more details about our
method of human behavior generation, combining a
MAS model and a TUS-based model.
2 STATE OF THE ART: HUMAN
BEHAVIOR SIMULATION
2.1 In Multi Agent Systems
In the field of human behavior simulation, the multi
agent approach offers several modelling methods.
The choice between these methods depends on the
goals of the simulation.
Scripted behaviors planned in advance by the
modeller can be used, for example, when the expected
behaviors are well known and sufficiently well
formatted. Those are typically used in training
simulations where the purpose is to expose a learner
to a specific scenario (Sharma and Otunba, 2012), or
in the case of urban emergency situations (Ulicny and
Thalmann, 2001).
In such approaches, one tends to limit the
behavior autonomy in order to ensure that the
simulations will be conducted as desired. Conversely,
it may be useful to model much more autonomous
behaviors, for example within the context of
negotiation and team work (Traum et al., 2003). One
way to do so is the BDI model (Belief-Desire-
Intention) (Rao and Georgeff, 1991), widely used in
multi agent based simulations (MABS). In this model,
the agent’s goals and belief are modelled. Thus, its
behavior is a means used in order to achieve its goals.
These models are also particularly interesting in
large-scale simulations (Shendarkar et al., 2008),
since scripts are difficult to implement in highly
unpredictable and unstable environments.
On a wider angle, when one tries to model
collective behavior, it becomes necessary to use
prescribed coordination models (Lanquepin et al.,
2013), and to combine them with reasoning
mechanisms. Several ways to achieve that
combination exist. For example, (Hubner and
Sichman, 2007) proposes to build a system of
organizational constraints that each agent must
respect. Rather than constrain the behavior of
autonomous agents, one may seek to equip agents
with teamwork models to enable them to coordinate
themselves in an adaptive and flexible way (Tambe,
1997), or allow them to collectively plan their actions
(Grosz and Kraus, 1996).
Our work follows a combined approach with both
prescribed activity at a global scale and autonomous
decision making for action selection at a fine-grain
level.
2.2 Statistical Methods using Time-Use
Surveys
TUS are daily surveys in which respondents must
transcribe their day as a series of episodes. For
example in the French TUS used in our research
(INSEE 2010), respondents had to indicate which
activity they were currently doing, every 10 minutes
for the whole day.
The use of TUS in simulations is restricted to a
few applications only, including the simulation of
household energy consumption. These are not as
widely used as they could be, certainly due to the lack
of visibility of these studies outside the world of
statistics. Moreover, if TUS are so attractive in the
world of energy, it is because it has been shown that
modelling residential energy consumption cannot be
realistic without any consideration about human
activity (Hitchcock, 1993). To improve the realism of
simulated consumption load curves, it is necessary to
integrate statistically realistic human behavior
models.
It is possible to distinguish two main trends in the
use of TUS to simulate human activity: "top-down"
approaches and "bottom-up" ones.
2.2.1 “Top-down” Approaches
The TUS data can be used to compute a matrix which
determines, at every time of the day, the probability
for an individual to switch from an activity to another.
(Richardson et al., 2010; Widén et al., 2012) use
ICAART 2017 - 9th International Conference on Agents and Artificial Intelligence
68

Markov chains to model these probabilities for a
change in activity (a simple presence / absence in the
housing in the first case, and ten classical activities in
the second). Similarly, (Chiou, 2009) uses a bootstrap
method (DeGroot, 1986) to extract the structure of the
daily behavior in US households.
These approaches are traditionally limited by
three factors (Yamaguchi and Shimoda, 2015). First,
they need to have the raw data of the TUS, but this
data isn’t always freely available, depending on the
laws of the country. Second, they lack accuracy about
the duration of the different activities. Because these
approaches focus on transitions between activities,
the length of each one may be less strictly simulated.
Finally, the coordination between members of the
same household is difficult to consider. Indeed, the
matrix of activity switches is not intended to be
dependent on the environment (or other agents).
2.2.2 “Bottom-up” Approaches
The TUS data can also be used to determine the mean
duration and distribution of activities during the day.
With this information, the "bottom-up" approaches
are able to build schedules iteratively, selecting
activities one after the other, according to a
probabilistic distribution. When the new activity is
selected, the duration is also calculated with the same
method. Thus, with each new selection of behavior, it
is possible to take the current situation into account.
(Tanimoto et al., 2008) show that this approach
does not require us to have access to the raw data of
the surveys. The only information needed is:
• the mean duration (and the associated standard
deviations) of each activity
• the percentage of individuals who adopt a
specific activity at a given time (this percentage
is called PB)
The timetables are built iteratively from an initial
activity by randomly choosing the next activity from
PB, when the previous activity ends.
(Wilke et al., 2013) improve the method by
initially taking into account the periods of presence /
absence of individuals in their housing. From the
perspective of the simulation of energy consumption,
the presence or absence of any individual in the
habitat fundamentally alters the housing consumption
profile. Therefore, it seems appropriate to use it as a
"framework". When a person enters the house, the
model determines the first activity to be selected as
well as its duration, and so on until he leaves. Then
the model directly “jumps” to the next attendance
period.
Another method, developed by (Yamaguchi and
Shimoda, 2015) also uses a strict structure of
activities, but through behaviors called “routine”.
Thus, activities such as sleep, work and study, along
with those related to meals and hygiene are initially
placed in the timetable. Other behaviors are then
selected in order to fill gaps in the schedule. The
originality of the method is to give prior attention to
activities structuring the schedule. Through these
routine activities, it is possible to take into account an
early coordination between members of the same
household.
All these statistical methods (top-down and
bottom-up) aim to replicate realistic human activities
at a macroscopic level. The simulated activities are
intended to match with the observed ones only at a
macroscopic scale. However, this approach does not
focus on the simulation of realistic individual
behavior. There is indeed no need to simulate a
collection of individually realistic behaviors to
simulate a realistic aggregate behaviour (Thalmann et
al., 2007). In a way, the simulated individual
behaviors are not taken into account, but they are only
"emerging" from the targeted aggregated behaviors.
This is the reason why we are going to combine the
high-level TUS-based approach with the MABS.
2.3 The Interest of Coupling MAS and
Statistical Methods
One goal of simulation in energy consumption is to
provide predictions of the future evolution of load
curves as new practices appear in the household (e.g.
new electronic devices or low-consumption
appliances), or the projection in fictional situations
(e.g. to assess the impact on the load curve of a major
event such as a sport competition or weather change).
Understanding such evolutions requires to generate
individually realistic behavior over time, able to
respond and adapt to environmental changes.
However, statistical methods offer limited
information on this regard.
2.3.1 The Limits of Statistical Methods
Statistical methods are not trying to simulate
autonomous or even reactive individuals. Statistical
methods aim at reproducing observed behavior in a
reference situation (the situation corresponding to the
TUS). They cannot be applied to unknown situations,
in which there is no statistical data to match.
Statistical approaches also do not aim at generating
individually realistic behavior over time, able to
respond and adapt to environmental changes.
Using Time Use Surveys in Multi Agent based Simulations of Human Activity
69

Similarly, none of the above statistical methods
completely deal with the issue of agents’
coordination, since it is not essential to ensure the
realism of the activities at a macroscopic level. In the
best case, a limited coordination is restricted to a few
"routine" behaviors (eat, wash, etc.). However, many
other behaviors require coordination (from a family
walk to helping a child to get dressed, or even
choosing the set temperature for the housing). That is
why, in order to simulate energy consumption as well
as other applications, having a coordination model
between simulated individuals is a necessity.
2.3.2 The Benefits of the Agent Centred
Approach
Unlike statistical methods, the agent centred
approaches use models centred on the simulated
individuals. Therefore, they aim for a validity at the
individual level. In MABS, the “emerging behaviors”
are the collective ones, as they are not explicitly
described in the model, but arise from interactions
between individual agents (Drogoul and Ferber,
1992).
In our work, we are interested in realism at a
macroscopic level (population scale) and we need the
TUS data to calibrate the simulated activities.
However, we are also interested in validity at a
microscopic level (individual scale) for prediction
and simulation of fictional situations. We want to be
able to simulate reactive, autonomous and coopera-
tive behaviors over time. That is why we developed
another method that combines the advantages of both
statistical and agent-based approaches. Our method is
in this sense a “mixed” MAS method, using reactive
and autonomous agents, whose behavior is calibrated
from statistical models derived from TUS.
3 OUR PROPOSITION
3.1 General Principle
This section presents our model of human behavior
generation. It is based on the combination of a
bottom-up approach to TUS with an existing and
already validated agent model: SMACH. We will
first present our agent model, then the TUS we
applied to calibrate the model. Afterwards, we will
discuss two specific issues encountered. First, which
data to collect in the TUS in order to increase the
validity of the simulated activities at a microscopic
scale. Second, how to generate both routine activities
and activity variability over time. We will then give
more details about the activity generation algorithm,
and two possible methodologies in order to validate
the model.
3.2 Description of the SMACH Agent
Model
SMACH is a simulation platform of human activity
inside the housings. Its ability to simulate individual
behaviors similar to real ones has already been
validated (Amouroux et al., 2014). In this platform,
each individual is modelled as an agent with goals
(tasks to perform), knowledge (about the other
individuals and the environment) and preferences
(either in terms of comfort or behavior). The agents
are able to exchange information, coordinate with
each other to perform specific tasks, plan their days
(agents can have preferences about when to perform
a specific task) and their weeks (for example, agents
can have preferences about the number of times per
week they wish to use a washing machine).
All the information needed to launch a simulation
are called the “scenario”. It contains a description of
the housing (type, surface, insulation, etc.), weather
conditions, household type and individuals. In a
scenario, each individual has a set of tasks to perform.
These tasks have the following features:
• Duration. Each task has a minimum and a
maximum duration. When an agent performs a
task, its priority increases compared to the other
ones, in order to prevent constant activity
swapping. The priority of this task decreases
after reaching the minimum duration, and it is
reduced to its minimum value after reaching the
maximum duration.
• Rhythm. Each task can be assigned a number of
repetitions per day or per week. For example: the
task “sleep” takes place once a day, the task “use
the washing machine” takes place three times a
week.
• Preferential period (PP). Each task may be
associated with a PP indicating the periods
during the day (or the week) that are preferred for
carrying out the task. These periods may be more
or less strict, that is to say that agents may or may
not be allowed to achieve the task outside the PP.
The PP changes the priority of the task,
positively during the period, and negatively
outside.
• Community. This indicates whether this task is
rather accomplished alone or in groups.
Example: “having meals” is rather a collective
task while “brushing teeth” is rather an
individual one. The realization by an agent B of
ICAART 2017 - 9th International Conference on Agents and Artificial Intelligence
70

a collective task also achievable by an agent A,
gives a bonus to the task’s priority for the agent
A.
• Location. Each task is associated with a location,
inside or outside the housing.
These features illustrate an important advantage
of using an agent centred model. It becomes
unnecessary to generate a scripted schedule minute
per minute. Preferential periods are sufficient for
autonomous agents to determine themselves the
sequencing of their tasks from a list. In addition, the
agents themselves manage their coordination through
internal models (in this case, the community feature).
3.3 The TUS Used
Our proposal is to use TUS data to set the parameters
of the MAS simulation (task information for each
individuals of the household). While our method is
generic from the perspective of the TUS used (the
data of any TUS can be used because they all follow
a common methodology), in was applied to a specific
TUS: the French 2009-2010 “enquête emploi du
temps”.
3.3.1 Description
This TUS was conducted by the INSEE institute in
2009-2010 (INSEE 2010). It interrogated 12,000
households, in which one or two people per
household filled one or two timetables. A timetable
consists of 144 time slots of 10 minutes each, from
21:00 until 23:50 the day after. For each time slot, the
respondent must indicate what activity he is currently
performing. In this TUS, more than 18,500 people
filled around 27,000 timetables. There are 140
activities identified in the survey.
This subdivision is too precise for the goals of our
simulation. Indeed, dealing with very precise
activities have two negative consequences. First, it
unnecessarily increases the complexity of the model:
the activities "reading" and "reading a newspaper" of
the TUS can be simply modelled as a single activity
"reading" in the simulation. Second, the more
different activities are in the survey, the less
repetitions each of them receives. That leads to under-
represented activities in the survey, and therefore
insignificant ones (for example activities like "going
on strike" or "receive medical care from a
professional at home" are not observed enough in the
survey to be significant).
So, we operate a transformation to change the 140
activities in the TUS to only 30 activities in our model
(more consistent with our simulation’s goals), such
as: “to sleep”; “to work”; “hygiene”; “to watch TV”;
“to wash the laundry”; “to wash the dishes”; “to cook
lunch”, etc.
Please note that this transformation of activities
from the survey is optional, and depends on the
simulation’s goals. In this case, we are interested in
household electrical consumption, so the activities are
mainly inside the housing, and energy driven.
3.3.2 Individual Types
In a similar manner as the statistical methods
presented in the state of the art, we do not try to
characterize the behavior of individuals in general.
We define a typology of individuals, which allows us
to categorize the timetables based on the individual
characteristics of the person who completed them.
The more we have access to specific individual
characteristics, the more we are able to identify a
typology of specific individuals, and the more the
schedule will be representative of those types.
However, the fewer timetables associated with a type
of individual, the less representative the schedules
are. The goal is therefore to build the most
discriminating individual typology possible, while
avoiding under-represented types. We decided to
retain the following individual criteria:
• Sex
• Age
• Professional activity (student, working person,
unemployed, pensioner)
There are no timetables filled by children under
10 years. So we decided to build categories with 10
years age range, starting from 10 years old (up to 60),
and a last category for those over 60 years. Since all
combinations of these three criteria (sex, age,
activity) are not possible (no woman under 20 years
old is a pensioner, for example), we get 27 different
types. The smallest group has around 170 timetables,
while the biggest has over 4,000 ones.
Please note that the TUS data do not allow us to
model children under 10 years old.
3.3.3 Type of Day
Another consideration needs to be taken into account:
the type of day. Indeed, for the same individual, the
activities carried out on weekdays and on Sundays are
rarely similar. But the type of day is also dependent
on the individual’s type. The usual Monday activities
from a working person and from a pensioner could be
highly heterogeneous. We use the following
typology:
Using Time Use Surveys in Multi Agent based Simulations of Human Activity
71
• “working day” or “weekday” (“working day” for
active and students, and “weekday” for
unemployed and pensioners)
• rest day
Please note that, during the survey, timetables
filling days have been deliberately divided equally
between weekdays and weekend. So, we have an
almost equal distribution for each type of individual,
between rest days and working day (51.4% of
weekdays).
Please also note that this segmentation of
individuals and types of day depends on the
simulation’s goals.
3.4 Data Collected from TUS
3.4.1 Comparison between Statistical
Macroscopic Results and Individual
Schedules
By studying the TUS’s timetables individually, it
appears that the statistical results at a macroscopic
level do not give much information about behaviors
at an individual level. A simple example: the "sleep"
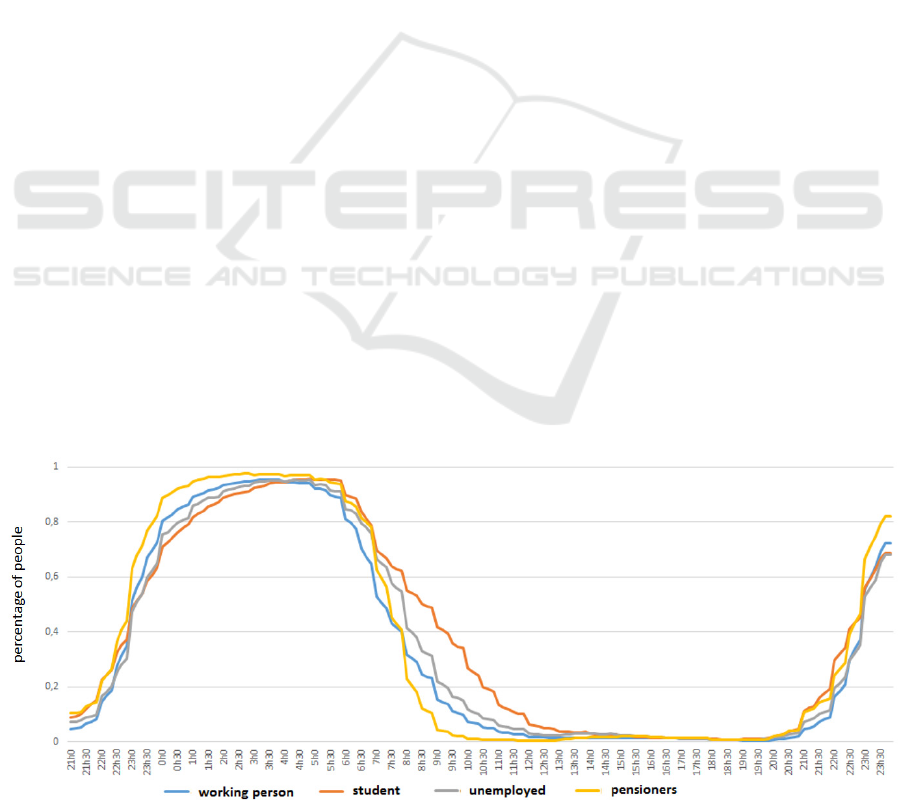
activity (see figure 1).
These curves show the percentage of individuals
of the four categories "working person", "student",
"unemployed" and "pensioners" performing the
"sleep" activity during each step of the day. From
these curves, one can easily draw firm statistical
conclusions such as "on average, students get up later
than pensioners, who are those who go to bed the
earliest”. These results are very interesting and fairly
simple to reproduce statistically.
However, these results conceal a substantial part
of the individual behavior variability. Even if an
average of 95% of the pensioners is sleeping between
2 AM and 4 AM, it is not necessarily the same 95%
at 2 AM and 4 AM. The study of individual timetables
shows that activities interruptions are very common.
Thus, in 10% of the timetables, the sleeping activity
was reported several times during the day (and up to
7 times), or no time at all. This example illustrates the
gap between aggregated and individual behavior.
Modelling the human sleeping activity as an activity
carried out only once per night for a duration of 8
hours may be enough to match the behavior
distribution at a macroscopic level. But this does not
model individual realistic sleeping behaviors in the
sense that in many cases, the simulated behaviors may
not match the actual observed ones because of their
number of repetitions per day, or their mean duration
(people wake up during the night, sleep several times
a day, etc.).
Yet the sleeping activity is really easy to model: it
is an activity adopted every day by almost everyone,
with a simple schedule. For an activity much more
difficult to model such as "being on the phone", one
can easily imagine the difference there may be
between the aggregate and individual behaviors.
3.4.2 Enhance the Information Extracted
from the TUS
The information typically used by statistical methods
are the mean durations (and the associated standard
deviations) of each activity, as well as the percentage
of individuals who adopt a specific activity at any
given time. This data is sufficient to generate realistic
activities at a macroscopic level, but lacks realism at
a microscopic level, because it does not take into
account the number of times each activity is actually
repeated each day. That is why we extract more
information from the TUS, in order to match more
precise activity features at a macroscopic level.
Figure 1: The "sleep activity" over time.
ICAART 2017 - 9th International Conference on Agents and Artificial Intelligence
72

Let (, ) be the number of repetitions of the
activity a, in the timetable t.
Let
(,,)be the probability distribution of
(, ) for the activity a, for all individuals of type i
and for all days of type d.
For each
, let
()
be the collection of couples
(starting time, finishing time), from every episode of
the activity in
.
Our model requires to extract from the TUS all
(,,)and all
()
for every activity a, every
individual type i, and every type of day d.
Please note that the usual data used by statistical
methods (mean duration/standard deviation and
percentage of individuals adopting a specific activity
at a given time step) are included in this data.
If this new information is taken into account
during the process of macroscopic matching between
observed activities and simulated ones, we believe
that the simulated individual activities are much
closer to the observed ones, and thus more realistic.
That is why we will build in our agent model the
parameters for task description based on this
information. However we must also deal with activity
variability over time.
3.5 Activity Variability over Time
3.5.1 The Absence of Information on the
Variability of Activity in the TUS
Another difficulty is the absence in the TUS of
information about the variability of activity over time.
For the same individual, no more than two days of
their life are given, and these days are never
consecutive (usually a weekday and weekend day).
From one or two timetables of an individual, it is
impossible to know if the times, durations and
frequencies indicated for each activities are rather
usual or exceptional.
Example: Let T
1
and T
2
be two timetables
collected in the TUS (respectively a Wednesday and
a Saturday) for an individual A. In T
1
, only 4 hours of
sleep are indicated, and 10 hours in T
2
. What does it
say about the average sleep durations of A? It is
impossible to know if these values are representative
of the mean duration of sleep on weekdays and
weekend or not. A could be sleeping 4 hours per night
during week nights, or this Wednesday he might have
attended a party and slept less than usual.
This problem does not appear when one attempts
to generate a schedule for only one day, because in
this case, it doesn’t matter if the activities observed in
the TUS are usual or not; one just has to reproduce
them. But when one wants to generate a schedule for
weeks or months, one needs to know if the activities
are usual or not, because only the usual activities
should be repeated day after day.
In order to generate individual realistic human
activity over time, one has to generate routine
activities which will regularly be the same, but also
variations around these routines (Feldman and
Pentland 2003; Haradji et al. 2012).
This means that generating the schedule for a
week with copies of the same day over and over is
impossible (no activity variability). On the other
hand, generating the schedule for a week with totally
different days each day does not bring more
consistency over time (no routine activity).
3.5.2 Weekly “Routine” Schedule
Our proposal to solve this problem is to generate the
information that is lacking. To do so, we will make
one strong hypothesis by considering that the most
atypical behaviors at a macroscopic level (the least
represented ones in the TUS) are also atypical ones at
a microscopic level, that is to say that they are only
special cases, specific exceptions, and cannot be the
routine behaviors of any individual. That is a simplify
model of the reality. It is possible that some humans
exhibit routine behaviors that are atypical: for
example, some humans do sleep on average 2 hours
per night. But since these cases are very uncommon,
we do not take them into account.
Weekly “routine” schedules will be based only on
regular behaviors. All the other behaviors (unusual
ones) found in the TUS will allow us to feed the
variability around routine behaviors.
For each simulated individual we will create a
weekly routine schedule based on all regular
behaviors on the timetables corresponding to his type.
The unusual behaviors of these timetables will
indicate how the behavior of the agent will change
around that routine.
In this way, the mean duration and standard
deviation of each activity are kept realistic at a
macroscopic scale, but the individual behavior gains
consistency over time.
3.6 Details of the Algorithm
We will now present the algorithm we use to generate
schedules. Please note that this algorithm is generic to
the extent that it works regardless of the typology of
individuals, the days and activities or the TUS
plugged in. The individual timetables are not required
as long as the data presented in the section 3.4.2 are
available.
Using Time Use Surveys in Multi Agent based Simulations of Human Activity
73
Table 1: Table presenting all notations of the algorithm.
(, )
number of repetitions of the activity
a, in the timetable t
(,,)
probabilistic distribution of N(a,t)
for all individuals of type i and for
all days of type d
()
all couples (starting time, finishing
time), from every episode in
(,,)
mean(
()
)
mean duration of the episodes from
()
stddev(
()
)
standard deviation of the episodes
from
()
PP(
()
)
preferential period of the activity in
()
DRS(ind,d)
daily routine schedule of the
simulated individual ind, for the
days of type d
WRS(ind)
weekly routine schedule of the
simulated individual ind
DS(ind,rd)
actual daily schedules for the
individual ind, for the real day rd
3.6.1 Step 1: Calculation of Temporality
Information
Let A be the set of activities of the simulation
Let I be the set of individual types
Let D be the set of types of day
For every activity a in A, for every type of individual
i in I, and for every type of day d in D, we first
compute
(,,) and
()
(see section 3.4.2 for
definitions).
For every
()
, we compute mean(
()
) and
stddev(
()
), the mean duration and standard
deviation of episodes from
()
.
We then build PP(
()
), the preferential period of
the activity. The PP are calculated such as 75% of the
episodes from
()
start after the starting time of PP,
and 75% of the episodes from
()
finish before the
finishing time of PP.
3.6.2 Step 2: Determination of Daily Routine
Schedule
Let DRS(ind,d)={task
1
, task
2
, …, task
m
} be the daily
routine schedule of the simulated individual ind
(which individual type is i), for the type of day d. This
schedule is a collection of tasks (see section 3.2 for a
definition of task in the model)
For every activity a in A, let x(a) be a possible number
of repetition of a, chosen randomly in
(,,).
We then create a task ta, corresponding to the activity
a, with the following properties:
• Minimum duration = mean(
()
) -
stddev(
()
)
• Maximum duration = mean(
()
) +
stddev(
()
)
• Preferential period: PP(
()
)
We add x(a) repetitions of the task ta in DRS(ind,d)
3.6.3 Step 3: Determination of Weekly
Routine Schedule
Let rd be any real day of the week (Monday,
Tuesday… Sunday).
Let WRS(ind)={DRS(ind,d
1
) , … , DRS(ind,d
k
) ,… ,
DRS(ind,d
n
)} be the weekly routine schedule of the
simulated individual ind (which individual type is i),
with d
1
, …, d
k
, … d
n
the n different type of day in D.
For every type of individual i in I, let Pdj(i,rd), (with
jϵ[0,n]) be the probabilities that the day rd be of type
d
j
for an individual of type i.
For every day of the week, we add in WRS(ind) the
corresponding DRS(ind,d) thanks to a random draw
in Pdj(i, rd), (with jϵ[0,n]).
3.6.4 Step 4: Determination of the Simulated
Schedules
Let ind be a simulated individual.
Let DS(ind,rd)={task
1
, … task
m
} be the actual daily
schedules for the individual ind, for the real day rd.
DS(ind,rd) is build as follows:
for every type of day d, we determine the daily routine
schedules DRS(ind,d) (step 2) and the weekly routine
schedule WRS(ind) (step 3).
Then, for every new simulated day sd (which type of
day is d), for every task ta in DRS(ind,d), we add ta’,
a copy of ta, in DS(ind,rd). But there is a probability
of 0.3 that we turn ta’ into an “unusual task” (see
section 3.5.2). This corresponds to the fact that,
statistically, only 68.2% of the episodes have a
duration situated in the interval [mean(
()
) -
stddev(
()
) ; mean(
()
) + stddev(
()
)].
However, at this point of the algorithm, every episode
is inside this interval. So, in order to keep a realistic
variability of these durations at a macroscopic level,
we have to “push” 1/3 of these durations outside the
interval.
Turing ta’ into an “unusual” task is done by the
following operation:
With a probability 0.3 (probability of unusual task),
select randomly one of the two possible alterations
(this choice is equiprobable):
a) Set minimum duration = mean(
()
) -
2*stddev(
()
)
ICAART 2017 - 9th International Conference on Agents and Artificial Intelligence
74

Set maximum duration = mean(
()
) -
stddev(
()
)
b) Set minimum duration = mean(
()
) +
stddev(
()
)
Set maximum duration = mean(
()
) +
2*stddev(
()
)
Please note that, statistically, around 4.5% of the
durations are outside the interval [mean(
()
)-
2*stddev(
()
);mean(
()
)+2*stddev(
()
)]. We
do not deal with them (we consider those tasks as too
rare).
3.6.5 Conclusion about the Algorithm
With this algorithm, the duration and standard
deviation of the simulated activities at a macroscopic
level are still respected, but the average number of
repetitions of each activity is respected too. In
addition, the simulated individuals exhibit both
routine activities and variation around them. We
believe that these features increase realism in the
individual schedules generated.
In this algorithm, we suppose that the tasks are
independent from each other, but it is possible to deal
with such dependencies during the random draw in
during step 2 (for example to take into account that
if an individual is cooking during the day, he is more
likely to eat at some point after that).
The tasks created by this algorithm are not
complete at this point. They lack community and
location information. This information cannot be
found in the TUS, it has to be added by the modeller.
So, for each activity of the simulation, the modeller
has to explicitly fill up the features “community” and
“location” (see section 3.2).
With this additional information, the tasks created
in this algorithm are complete (in the sense of our
simulator). The actual daily schedule DS(ind,rd)
created for every simulated individual ind and for
every day rd can be directly sent to the agents in the
simulator. Every day of the simulation, the agents will
receive their tasks, and they will decide how they are
going to perform them.
3.7 Validation Methodology
This model has been implemented and is currently
being tested with the data from the INSEE TUS. The
next step is to validate the result of the produced
simulation.
Several methods are possible. First, we would like
to verify that the autonomy of the agents does not
harm the macroscopic realism of the simulated
behaviors. Indeed, as we generate non-scripted
schedules, the agents have some degree of freedom to
reorganize them. That can be checked by launching a
large number of simulations and generate the TUS
timetables associated with each day of simulation.
Then we can compute the statistical results at a
macroscopic level from these new timetables as if
they were real ones, and finally compare them with
the real ones. This method is easy to perform (it only
relies on computation time), but like the validation of
the statistical methods, only verifies the realism of the
activities at a macroscopic scale.
A second verification is to compare real and
simulated activities at a microscopic level. However,
we cannot manually verify a large number of
produced behaviors. Our proposed approach is to
generate “new TUS timetables” as in the previous
method and to perform a classification process with
the real TUS timetables and the simulated ones.
Based on previous work (Darty et al. 2014), we claim
that if the obtained clusters are mixed (they contain
both real timetables and simulated ones), it means that
the simulated activities are indistinguishable from
real ones, based on the considered variables.
However, we still need to define the relevant
classification variables. That will allow us to state that
the individual simulated activities are “realistic”.
4 CONCLUSION AND
PERSPECTIVES
We have presented a multi agent model using
concepts coming from statistical methods of human
activity generation. In particular, thanks to data
collected in TUS, we are able to calibrate the
simulated behaviors. This model has two major
advantages. First, compared to traditional statistical
methods, it allows the generation of more realistic
individual behaviors, while keeping the same quality
of realism at a macroscopic level. Second, compared
to more traditional MABS, the use of TUS allows the
objective measurement of the realism of the simulated
activities. In addition, the international and generic
nature of TUS makes them usable in various
application domains.
The next step of our work is to implement this
model on data collected within our project to study
the realism of the behavior simulated.
This work leads to many perspectives. In the field
of energy simulation, adding reactivity and autonomy
to the simulated individuals allows the prediction of
long-term consumption, and the ability to take into
Using Time Use Surveys in Multi Agent based Simulations of Human Activity
75

account the impact of new types of consumption
(generalization of electric cars, self-production and
self-consumption of electricity, etc.). One also
becomes able to deal with major events (climatic,
social, etc.). Another research track currently
followed by our team is to study the impact of new
electrical tariff on consumption. How do consumers
react to a change in the price of electricity?
In the area of MABS, the widespread use of TUS
could bring a better understanding of the relationship
between the notions of realism and credibility (some
of the actual behaviors observed in the TUS seem
highly unlikely or even incomprehensible).
Furthermore, the worldwide nature of TUS can also
help modellers to introduce, in a consistent and
measurable way, some lesser explored aspects of
human activity simulation (such as the individual’s
culture or other local specificity).
REFERENCES
Amouroux, É. et al., 2013. Simulating human activities to
investigate household energy consumption. In
Proceedings of the 5th International Conference on
Agents and Artificial Intelligence. pp. 71–80.
Amouroux, É. et al., 2014. SMACH: Agent-Based Simula-
tion Investigation on Human Activities and Household
Electrical Consumption. Communications in Computer
and Information Science, 449, pp.194–210.
Caillou, P. and Gil-Quijano, J., 2012. Simanalyzer:
Automated description of groups dynamics in agent-
based simulations. International Conference on
Autonomous Agents and Multiagent Systems, Volume
3, pp.1353–1354.
Chiou, Y., 2009. Deriving US household energy
consumption profiles from american time use survey
data a bootstrap approach. 11th International Building
Performance Simulation.
Darty, K., Saunier, J. and Sabouret, N., 2014. Behavior
Clustering and Explicitation for the Study of Agents’
Credibility: Application to a Virtual Driver Simulation.
International Conference on Agents and Artificial
Intelligence, pp.82–99.
DeGroot, M., 1986. Probability and statistics, Addison-
Wesley.
Drogoul, A. and Ferber, J., 1992. Multi-agent simulation as
a tool for modeling societies: Application to social
differentiation in ant colonies. on Modelling
Autonomous Agents in a Multi-Agent World, pp.2–23.
Drogoul, A., Vanbergue, D. and Meurisse, T., 2003. Multi-
agent based simulation: Where are the agents? In Multi-
agent-based simulation II. Springer Berlin Heidelberg,
pp. 1–15.
Feldman, M. and Pentland, B., 2003. Reconceptualizing
organizational routines as a source of flexibility and
change. Administrative science quarterly.
Gratch, J. et al., 2009. Assessing the validity of appraisal-
based models of emotion. ACII.
Grosz, B. and Kraus, S., 1996. Collaborative plans for
complex group action. Artificial Intelligence, 86(2),
pp.269–357.
Haradji, Y., Poizat, G. and Sempé, F., 2012. Human activity
and social simulation V. G. Duffy, ed., Boca Raton,
FL : CRC Press.
Hitchcock, G., 1993. An integrated framework for energy
use and behaviour in the domestic sector. Energy and
Buildings, 20(2), pp.151–157.
Hubner, J. and Sichman, J., 2007. Developing organised
multiagent systems using the MOISE+ model:
programming issues at the system and agent levels.
International Journal of Agent-Oriented Software
Engineering, 1, pp.370–395.
INSEE, 2010. http://www.insee.fr/fr/publications-et-
services/irweb.asp?id=edt2010.
Lacroix, B., Mathieu, P. and Kemeny, A., 2013.
Formalizing the construction of populations in multi-
agent simulations. Engineering Applications of
Artificial Intelligence, 26(1), pp.211–226.
Laird, J.E., 2012. The Soar cognitive architecture, The MIT
Press.
Lanquepin, V., Carpentier, K. and Lourdeaux, D., 2013.
HUMANS: a HUman models based artificial
eNvironments software platform.
Proceedings of the
Virtual Reality International Conference: Laval
Virtual, p.9.
Law, A., Kelton, W. and Kelton, W., 1991. Simulation
modeling and analysis, McGraw-Hill Education.
Pelachaud, C., 2009. Modelling multimodal expression of
emotion in a virtual agent. Philosophical Transactions
of the Royal Society B: Biological Sciences, 364(1535),
pp.3539–3548.
Rakha, H. et al., 1996. Systematic verification, validation
and calibration of traffic simulation models. 75th
Annual Meeting of the Transportation Research Board.
Rao, A. and Georgeff, M., 1991. Modeling rational agents
within a BDI-architecture. In J. A. and R. F. and E.
Sandewall, ed. Proceedings of the 2nd International
Conference on Principles of Knowledge Representation
and Reasoning. Morgan Kaufmann publishers Inc.: San
Mateo, CA, USA, pp. 473--484.
Richardson, I. et al., 2010. Domestic electricity use: A high-
resolution energy demand model. Energy and
Buildings, 42(10), pp.1878–1887.
Sharma, S. and Otunba, S., 2012. Collaborative virtual
environment to study aircraft evacuation for training
and education. Collaboration Technologies and
Systems, pp.569–574.
Shendarkar, A. et al., 2008. Crowd simulation for
emergency response using BDI agents based on
immersive virtual reality. Simulation Modelling
Practice and Theory, 16(9), pp.1415–1429.
Stinson, L., 1999. Measuring how people spend their time:
a time-use survey design. Monthly Lab. Rev., 122, p.12.
Tambe, M., 1997. Towards flexible teamwork. Journal of
artificial intelligence research, 7, pp.83–124.
ICAART 2017 - 9th International Conference on Agents and Artificial Intelligence
76

Tanimoto, J., Hagishima, A. and Sagara, H., 2008. A
methodology for peak energy requirement considering
actual variation of occupants’ behavior schedules.
Building and Environment, 43(4), pp.610–619.
Thalmann, D., Musse, S. and Braun, A., 2007. Crowd
simulation, Springer London.
Traum, D. et al., 2003. Negotiation over tasks in hybrid
human-agent teams for simulation-based training.
Proceedings of the second international joint
conference on Autonomous agents and multiagent
systems, pp.441–448.
Ulicny, B. and Thalmann, D., 2001. Crowd simulation for
interactive virtual environments and VR training
systems. In Computer Animation and Simulation.
Springer Vienna, pp. 163–170.
Widén, J., Molin, A. and Ellegård, K., 2012. Models of
domestic occupancy, activities and energy use based on
time-use data: deterministic and stochastic approaches
with application to various building-related. Journal of
Building Performance Simulation, 5(1), pp.27–44.
Wilke, U. et al., 2013. A bottom-up stochastic model to
predict building occupants’ time-dependent activities.
Building and Environment, 60, pp.254–264.
Yamaguchi, Y. and Shimoda, Y., 2015. Evaluation of a
behavior model of occupants in home based on
Japanese national time use survey. Proceedings of
BS2015.
Using Time Use Surveys in Multi Agent based Simulations of Human Activity
77
