Application of the Six Sigma Method for Improving Maintenance
Processes – Case Study
Michał Zasadzień
Institute of Production Engineering, Silesian University of Technology, Roosevelta 26, Zabrze, Poland
Keywords: Maintenance, Six Sigma, Improvement, Breakdown, Process, DMAIC.
Abstract: The article presents an implementation attempt of the DMAIC method used in the Six Sigma concept for the
improvement of production processes connected with maintenance. Thanks to the tools included therein
(process map, FMEA, SIPOC chart) we were able to define the: problem, i.e. which types of breakdowns
cause the most machine stoppage; precise structure of the failure removal process and its needs, owners,
resources, client-supplier relationships in particular sub-processes; source causes for overly long stoppages.
Learning the process and the causes of malfunctions allowed us to develop improvement procedures aimed
at minimising the fault removal times. The procedures developed have been implemented in the company
alongside a control plan, which will ensure supervision and their efficient functioning in the future.
1 INTRODUCTION
1.1 Maintenance
Processes connected with maintaining technical
resources used in production in good condition are
some of the key elements which affect the efficiency
of production processes, which directly influences
the company’s competitiveness on the market
(Żurakowski, 2004). Thanks to an efficient machine
park, a production company can supply its goods to
the customers in required quantity, quality and
within the agreed deadlines; it becomes a reliable
and trustworthy partner for its clients. A key element
to the production process is the availability of
machinery and equipment. Availability (operational
time) of machines and equipment which take part in
the production process is limited by several
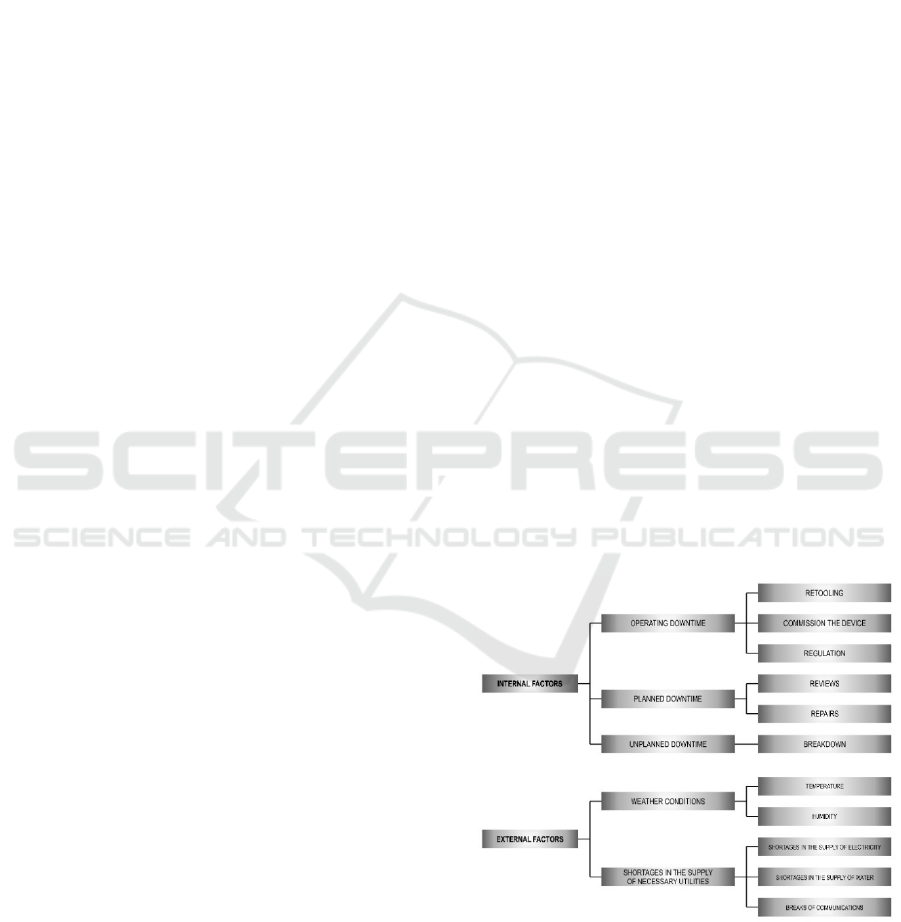
elements, which can be classified into two main
groups: stoppages caused external factors and
stoppages caused by internal factors. External
factors do not depend on the technical condition of
the machinery or the way it is operated. These
factors include stoppages caused by e.g. media
supply shortages (water, electricity,
communication), but also weather conditions which
make operation impossible (temperature in the
production hall). Internal stoppage factors depend on
the way the machines are operated and their
technical condition. These include stoppages caused
by breakdowns, inspections and renovation works,
but it is also the time needed for refitting or
calibration of the machines, launching them after a
stoppage, introducing improvements, training new
employees, etc. An example division is presented in
Figure 1.
Figure 1: Factors affecting machine unavailability (based
on Zasadzień and Midor 2015).
From the availability period we can also
distinguish the unused time (the period when the
machine is not working despite being operational),
which depends on planning, production quantity and
314
ZasadzieÅ
ˇ
D M.
Application of the Six Sigma Method for Improving Maintenance Processes â
˘
A ¸S Case Study.
DOI: 10.5220/0006184703140320
In Proceedings of the 6th International Conference on Operations Research and Enterprise Systems (ICORES 2017), pages 314-320
ISBN: 978-989-758-218-9
Copyright
c
2017 by SCITEPRESS – Science and Technology Publications, Lda. All rights reserved
organisation. It is not considered as either external or
internal factor, as the machine is available for work
at the time.
The occurrence of a breakdown of a machine
involved in the production process can cause delays,
endanger its operators or the natural environment; it
increases the risk of crossing delivery deadlines or
decrease in product quality. The probability of
stoppages caused by breakdowns can be minimised
by introducing advanced maintenance strategies,
which include preventive maintenance based on
inspections and preventive renovation, or predictive
maintenance, based on monitoring the technical
condition (condition based maintenance) (Legutko,
2009). Even the most technically and
organisationally advanced preventive measures
cannot reduce the probability of a breakdown to an
absolute zero.
A breakdown is a sudden and mostly unforeseen
occurrence, which is why the process of its removal
is very complex; it is necessary to act in a rush and
reorganise working schedules. It consists of
administrative, organisational and technical
activities. Reducing the breakdown removal time,
and therefore reducing the downtime of the machine
directly affects the efficiency indicators of the
production process. It is, therefore, important to
skilfully direct the main and auxiliary processes
connected with the company’s activity in order to
efficiently use the working time, materials, machines
and equipment (Mikler, 2005). The maintenance
department often operates based on no precisely
defined schedule and its priorities are set on the fly,
usually with not enough human and technical
resources available, which is why the skills of
managing working time and using it efficiently are
especially important here (Midor, Szczęśniak and
Zasadzień, 2010; Mączyński and Nahirny, 2012).
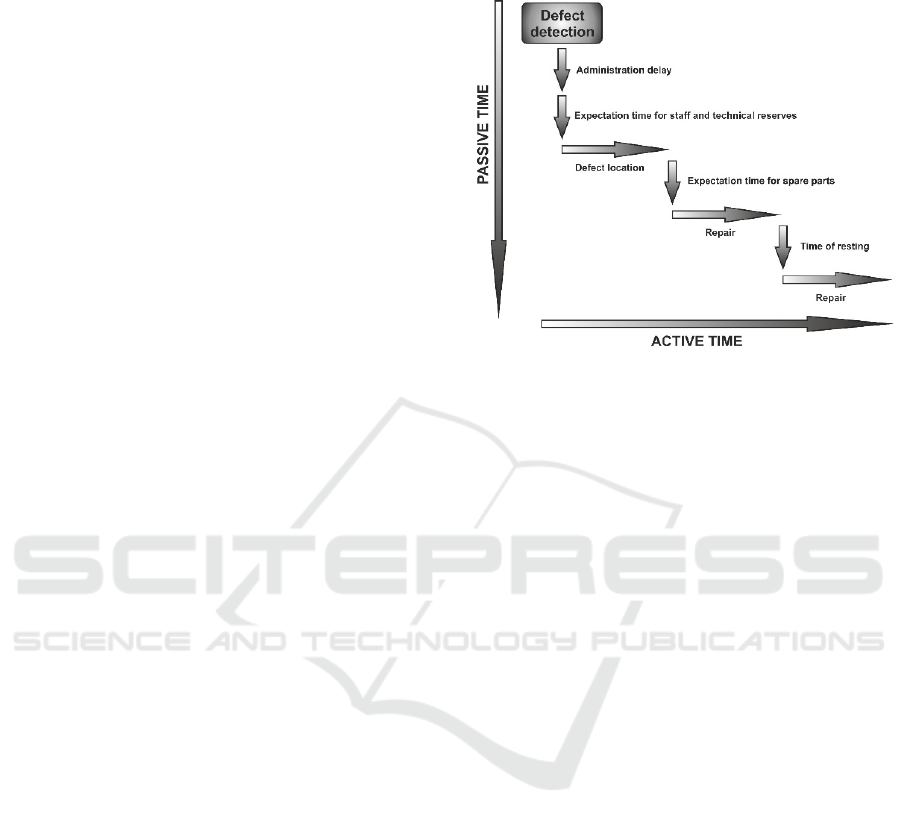
Stoppage caused by a breakdown can consist of
active and passive time, as presented in Figure 2.
The length of the downtime period caused by a
breakdown can be composed of elements whose
duration depends on the organisation and
management of the maintenance department
(administrative delay, waiting for personnel and
spare parts), i.e. the so-called support capability, as
well as on ease of maintenance, i.e. the ease with
which a given machine can be brought back to an
operational condition. Ease of maintenance depends
primarily on the qualifications and competence of
employees, the machine’s structure, its technical
condition and location. Shortening the downtime
caused by a breakdown consists in, for the most part,
shortening the passive and/or active time of the
breakdown removal process.
Figure 2: Time in the defect removal process (based on
Mikler, 2005).
1.2 DMAIC
Strategies for improving production processes have
been described in literature many times (Sahno and
Shavtshenko, 2014; Soković et al., 2009). Currently,
we have at our disposal such methods and concepts
of quality management as: PFMEA, TQM, Six
Sigma and others (Tague, 2005; Andrássyová,
2013). Apart from those, many less complex tools,
such as the Pareto chart, Ishikawa diagram or 5
WHYs (Midor, 2014) are also used with much
success.
One of the elements of streamlining the
production process can be the DMAIC (Define -
Measure - Analyse - Improve - Control) method,
rooted in the automotive industry and successfully
utilised in process improvement in accordance with
the Six Sigma assumptions (Krzemień and Wolniak,
2007; Wojraszak and Biały, 2013). Six Sigma is a
complex and flexible system for achieving,
sustaining and maximising business achievements. It
is characterised by the understanding of customers’
needs and organised use of facts, data and statistical
analysis results, and is based on management,
streamlining and constantly creating new, ever better
solutions with reference to all the processes taking
place in the company. Furthermore, it is aimed at
minimising the costs of bad quality while
simultaneously increasing customer satisfaction
(Truscott, 2003)). The method is used to eliminate
the causes of defects, losses they incur and any
problems related to quality in the aspects of
production, services and management. To solve
Application of the Six Sigma Method for Improving Maintenance Processes â
˘
A¸S Case Study
315
these problems, the method employs quality tools
and statistical techniques (Eckes, 2000).
When implementing the DMAIC method, a
number of auxiliary quality improvement tools and
methods are used. The improvement cycle using the
DMAIC method consists of the following elements
(Dreachslin and Lee, 2007; Bargerstock and
Richards, 2015):
Define. In this stage a team is created which
will be responsible for the implementation of
the method. The defining phase must identify
the following elements: determining the
problem (description of the problem, time of
occurrence), scope of the project (elements of
the process the team will work on), aim of the
project (a tangible goal to achieve and sustain
in the future).
Measure. During the measurement stage
parameters and places of measurement should
be defined, i.e. the points of process quality
and its costs along with a precise reflection of
the actual state. Conducting measurements
successfully requires a statistical outlook on
the particular production processes and
problems related to them. The measurement
stage employs methods such as: descriptive
statistics, summary charts, the SIPOC method
and the process map.
Analyse. During this stage of the
methodology, by analysing the particular
parameters of the process, the team will be
able to determine the causes of the problem,
which will then need to be eliminated or
fixed. The results obtained during the
measurement stage are used in order to
investigate the correlation between causes of
defects and process variability sources. In
order to identify the causes of process
variability, which are a significant factor in
defect creation, the PFMEA analysis, the
Pareto - Lorenz chart and the Ishikawa
diagram are often used.
Improve. Improvement can otherwise be
understood as engagement in the course of
the production process, i.e. reduction of the
defect rate. It consists in searching for and
evaluating potential causes of process
variability and investigating their
correlations. Learning the multi-factor
relations allows for achieving the desired
results.
Control. The control stage takes place after
finishing the new process implementation
phase. The fundamental goal of Six Sigma is
the constant observation of the improvements
introduced to maintain a desired level of
quality. In this phase of the DMAIC the
measurement system and potential
verification process are repeated to confirm
the improvement of the process. Afterwards,
measures are taken to appoint control over
the streamlined processes; usually a so-called
control plan is created.
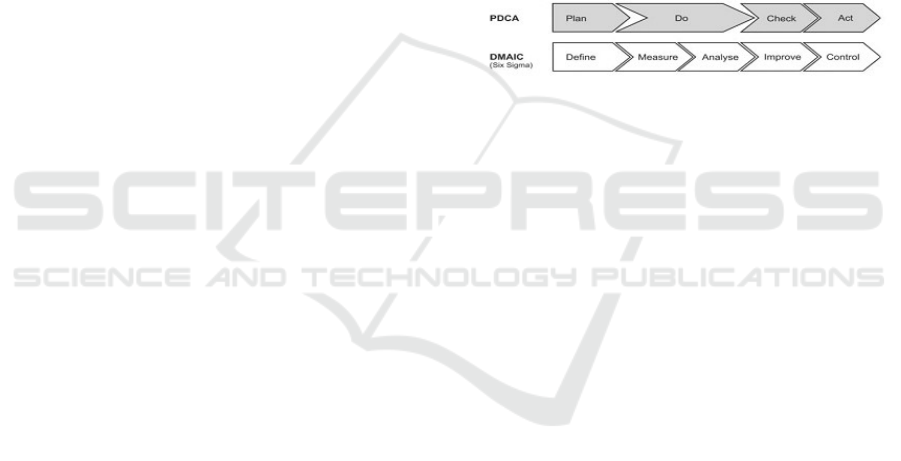
As we can infer from the above description,
based on the concepts of Six Sigma and Lean, the
DMAIC method used in management systems relies
on the principle of constant improvement and PDCA
formulated by E. Deming (Deming, 2000) and
required by the ISO 9001 series standards. A
comparison of both concepts has been presented in
the literature in many forms (George et al., 2005;
Soković et al., 2010) (fig. 3).
Figure 3: PDCA vs DMAIC.
The DMAIC methodology is used for improving
production processes, successfully contributing to
the reduction of the number of non-compliant
products and reducing production costs. The author
of this elaboration decided to introduce this method
to processes auxiliary to the production process, i.e.
to the maintenance process. The maintenance
process, as every other process, has its inputs,
outputs, clients, suppliers and can be described using
indicators, similar to the production process. The
case presented pertains to the breakdown removal
process.
2 DMAIC IMPLEMENTATION
2.1 Define
In the company which is the subject of this study the
key machines are the extruders producing HDPE
(high-density polyethylene) pipes. Due to that fact, a
total of 154 breakdowns of these machines were
analysed in the period of 32 months. This allowed us
to identify those components whose breakdowns
caused the longest stoppages, as presented in Table
1.
As can be seen in the above table (Tab. 1), the
breakdown that caused the longest downtime was
the damaged connector of extruder head heater. In
ICORES 2017 - 6th International Conference on Operations Research and Enterprise Systems
316
the examined period of time the downtime due to
this failure lasted more than 130 hours (7
breakdowns of this type), and the average time of
downtime was 18 hours, therefore, it was decided
that the problem should be subjected to analysis. The
aim was to reduce the total duration of downtime
caused by this failure by reducing the average
downtime duration and the number of breakdowns.
Table 1: Extruder component stoppages analysed.
Failure
Average
downtime
duration
[h]
Total
downtime
duration
[h]
Damaged heater supply
connector
18.69 130.83
Incorrect caterpillar track
haul-off
14.19 103.49
Pipe surface corrugation 10.19 71.31
Leak of oil from
transmission gear
9.50 37.99
Crown brush failure 17.80 35.59
Error on controller display 22.83 2.83
No heating 0.98 20.64
Fuse blown 0.48 20.30
Destroyed basket for
granulated product
18.60 18.60
No granules haul 1.61 12.88
Failure of ozone exhaust 0.42 7.48
Damaged frequency
invertor
7.34 7.34
Leak of mass from the
head
1.08 4.32
Leak in heat exchanger 3.81 3.81
No cooling 0.16 2.28
Saw failure 0.22 1.55
Printer failure 0.50 1.00
Clogged head sieve 0.44 0.88
Calibrator failure 0.24 0.72
Vacuum pump 0.21 0.21
Damaged air duct 0.03 0.03
Extractor failure 0.01 0.02
Drive system failure 0.02 0.02
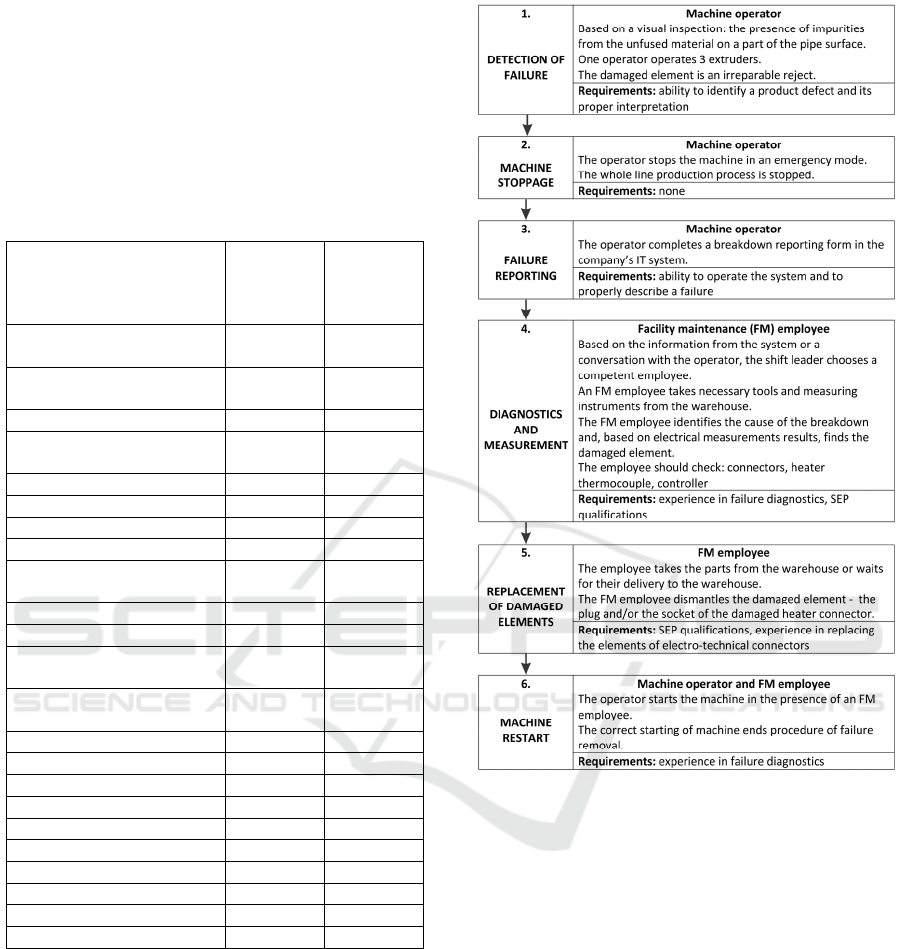
2.2 Measure
Based on the information obtained from the
production and maintenance employees, a map for
the process of identifying and removing failures of
the extruder head heater connector was created. The
process map has been presented in Fig. 4.
Figure 4: Failure removal process map.
2.3 Analyse
Based on the information collected in the process of
identifying all the process steps and creating a
process map, a modified PFMEA matrix was
developed to identify potential causes and effects of
delays during the process of removing a failure of
extruder head heater and estimate their importance
for the process. For the needs of the case study, a
scale from 1 to 4 was adopted, where 1 means a
positive situation and 4 – a negative one (Table 2).
Application of the Six Sigma Method for Improving Maintenance Processes â
˘
A¸S Case Study
317
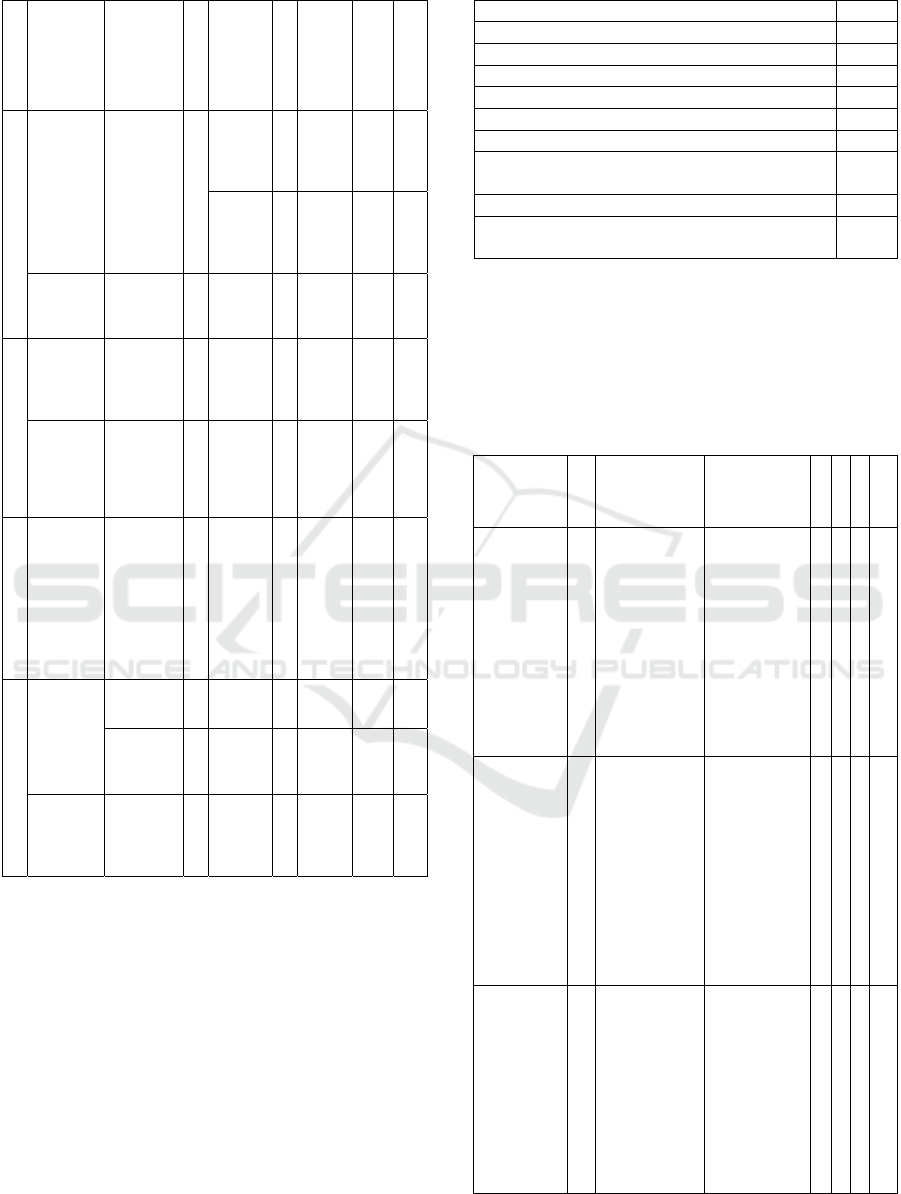
Table 2: PFMEA matrix.
Process stage
Problem
Cause
Importance
Effect
Occurrence
Current
prevention
Effectiveness
of prevention
IOE
1.
Failure
detected too
late
Connector
burnt during
work
4
Line
stoppage.
3
Observat
ion of the
product
by the
operator
4 48
Possibility
of further
defects
1
Observat
ion of the
product
by the
operator
4 16
Failure
occurs after
extruder
refitting
Connector
damaged in
the process o
f
refitting
3
Line
stoppage
3
N
one 4 36
3.
Too long
time of
recording the
failure in the
system
Insufficient
knowledge o
f
the IT system
1
FM is not
aware of
the failure
3
Training
of a
newly
employe
d worker
2 6
FM does not
know the
failure
details
Inaccurate
description o
f
failure
3
FM
employee
does not
have the
sufficient
equipment
4
N
one 4 48
4.
Incorrect
diagnostics
Having
identified the
cause of the
failure, the
employee
does not
control the
remaining
elements of
the system
4
Long
duration o
f
failure
removal
2
N
one 4 32
5.
Long waiting
time for the
parts
Lack of parts
in the
warehouse
4
Prolonged
failure
removal
1
N
one 4 16
Long
searching for
parts in the
warehouse
3
Prolonged
failure
removal
2
N
one 4 24
Long
duration of
damaged
elements
replacement
Waiting for
the head
temperature
to go down
4
Prolonged
failure
removal
4
N
one 4 64
The analysis conducted by means of the PFMEA
tool revealed which of the analysed causes of the
problems was the most important for the process of
failure removal. Table 3 contains the analysis
synthetic results.
For further works aimed at improving the
process, problems whose IOE was at least 40, i.e.
three most important items: waiting for the head
temperature to go down, connector burnt during
work – line stoppage and inaccurate description of
the failure were selected.
Table 3: PFMEA analysis results.
Cause IOE
Waiting for the head temperature to go down 64
Connector burnt during work – line stoppage 48
Inaccurate description of failure 48
Connector damaged in the process of refitting 36
Incorrect diagnostics 32
Long searching for parts in the warehouse 24
Connector burnt during work – possibility of
further defects
16
Lack of parts in the warehouse 16
Too long waiting for the failure to be recorded
in the system
6
2.4 Improve
At the further stage of analysis, improvement actions
for all the important problems were proposed. Their
synthetic summary has been given in Table 4.
Table 4: Improvement actions.
Cause
IOE
Improvement
actions
Benefits I O E
IOE
Waiting for
the head
temperature
to go down
64
Introducing a
system of
doubled
heads. A
spare head is
waiting at the
quick
replacement
station.
No need to
wait for the
head to cool
down.
Replacement
of the head
for a cold one
enables an
immediate
failure
removal.
4 2 2 16
Connector
burnt
during
work – line
stoppage
48
Installing a
system of
product
surface
monitoring
with software
for image
analysis.
No need for
the operator
to observe
the pipe
surface.
Automatic
alarm
initiation in
case of
surface
defects.
4 2 2 16
Inaccurate
description
of failure
48
Introducing a
uniform base
for failure
reporting in
the IT system
and training
of machine
operators in
failure
identification.
FM
employees
receive
reliable and
precise
information
enabling their
faster
preparation
for work.
3 1 2 6
ICORES 2017 - 6th International Conference on Operations Research and Enterprise Systems
318
The introduced improvement actions allowed a
considerable reduction of IOE values for the
analysed problems.
An estimation of the costs involved in the
improvement actions has revealed that the cheapest
solution is improving the process of failure
reporting, as the enterprise has a possibility of
modifying the IT system. Introducing a spare head at
the extruder workstation required constructing and
making trolleys for fast head replacements. Since the
company manufactures its products on a mass scale,
the expensive heads are stored in the company’s
warehouses. The most costly improvement action is
introducing a system for product surface quality
monitoring. It has been decided that such a system
will be implemented in the places where operators
have a hindered access, i.e. where observation of the
process is difficult.
2.5 Control
After implementing the actions planned, the values
of duration of downtimes due to failures of heaters
in extruder heads are monitored on a regular basis
and their causes analysed according to the schedule
contained in Table 5.
Table 5: Process monitoring.
Element of
control
Duration of
downtimes due
to heater
connectors’
failures
Elements of
downtime
duration
Control limit
Downtime
duration <10 h
None
Frequency of
control
1/half year 1/half year
Control system
Records in IT
system
Failure removal
reports
Control method Figures Charts
Response plan
Meeting with
production
managers
Meetings with
FM shift leaders
Person in charge FM manager FM manager
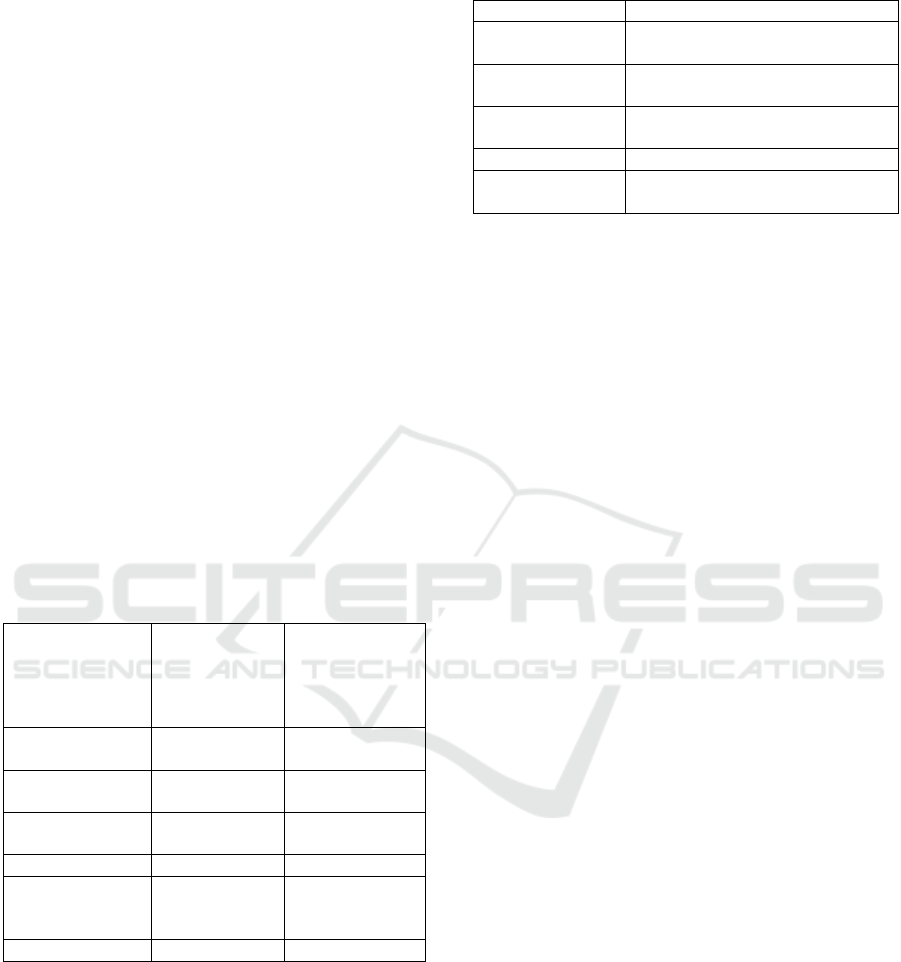
At the last stage of creating a control plan,
standardization (Table 6) was taken into
consideration, aimed at maintaining the standards
which the process of failure removal improvement is
based on.
Table 6: Standardization.
Person in charge Undertaken actions
Quality engineer
Instructions on head replacement
using a fast exchange trolley
Quality engineer
Instructions for pipe surface
control
Production
manager
Operators’ training in product
surface observation
Quality engineer Failure reporting instructions
FM manager
Training for operators in failure
reporting and diagnostics
Training actions are undertaken in the event new
workers are employed and any important changes
have been made in the instructions and procedures.
3 CONCLUSIONS
The aim of the undertaken actions has been
achieved. The duration of downtimes caused by
failures of extruder head heater connectors was
reduced. The period of results verification lasted 8
months. During that time there were two such
failures and downtime duration decreased from 18 to
9 hours. This process will be further monitored.
DMAIC is a long-term method and despite being
very extended and time-consuming, it guarantees
proper identification of problems and their effects
for the maintenance process. It ensures developing
and implementing effective improvement actions
and, what is most important, it guarantees that the
implemented actions will be continued in the future.
The described case study has proved that it is
possible to effectively use quality engineering
methods and tools for maintenance process
improvement. This allows increasing the availability
of machines as well as shortening the duration of
downtimes and failure removal.
ACKNOWLEDGEMENTS
This article was prepared within the statutory
research titled “Production engineering methods and
tools for development of smart specializations”,
work symbol 13/030/BK_16/0024 performed at
Silesia University of Technology, Institute of
Production Engineering.
Application of the Six Sigma Method for Improving Maintenance Processes â
˘
A¸S Case Study
319

REFERENCES
Andrássyová Z., Žarnovský J., Álló Š., Hrubec J. 2013.
Seven new quality management tools, Advanced
Materials Research. vol. 801, special issue, pp. 25-33.
Bargerstock A.S., Richards S.R. 2015. Case Study:
Application of DMAIC to Academic Assessment in
Higher Education Quality Approaches, Higher
Education, vol. 6, no. 2, pp. 31-40.
Deming W.E. 2000. The New Economics for Industry,
Government, Education, 2
nd
edition. MIT Press.
Cambridge.
Dreachslin J.L., Lee P.D. 2007. Applying Six Sigma and
DMAIC to Diversity Initiatives, Journal of Healthcare
Management, vol. 52, no. 6, pp. 361-367.
Eckes G. 2000. The Six Sigma Revolution, John Wiley &
Sons, Inc. New York.
George M., Rowlands D., Price M., Maxey J. 2005. Using
DMAIC to improve speed, quality, and cost. In The
Lean Six Sigma Pocket Toolbook: A Quick Reference
Guide to Nearly 100 Tools for Improving Process
Quality, Speed, and Complexity, McGraw-Hill, pp. 1-
26.
Krzemień E., Wolniak R. 2007. Analysis of process of
constant improvement of six sigma. In Current trends
in commodity science. Proceedings of the 9th
International Commodity Science Conference (IGWT),
ed. R. Zieliński. Poznan University of Economics
Publishing House. Poznan, pp. 227-232.
Legutko S. 2009. Development trends in machines
operation maintenance, Eksploatacja i Niezawodnosc
– Maintenance and Reliability, no. 2, pp. 8-16.
Mączyński W., Nahirny T. 2012. Efektywność służb
utrzymania ruchu jako składowa efektywności
przedsiębiorstwa. In Innowacyjność procesów i
produktów, ed. R. Knosala, Oficyna Wydawnicza
PTZP. Opole, pp. 203-213.
Midor K. 2014. An analysis of the causes of product
defects using quality management tools, Management
Systems in Production Engineering, no. 4, pp. 162-
167.
Midor K., Szczęśniak B., Zasadzień M. 2010. The
identification and analysis of problems within a scope
of cooperation between traffic maintenance
department and production department. Scientific
Journals Maritime University of Szczecin, vol. 96, no.
24, pp. 48-52.
Mikler J. 2005. Strategie Utrzymania Ruchu: przegląd i
analiza, Seminar Protech.
Sahno, J., Shevtshenko, E. 2014. Quality improvement
methodologies for continuous improvement of
production processes and product quality and their
evolution. In Proceedings of 9th International
DAAAM Baltic Conference Industrial Engineering,
Tallinn University Of Technology, Tallinn, pp. 181-
186.
Soković M., Jovanović J., Krivokapić Z., Vujović A.
2009. Basic Quality Tools in Continuous Improvement
Process, Strojniški vestnik - Journal of Mechanical
Engineering, no 5, pp. 1-4.
Sokovic M., Pavletic D., Kern Pipan K. 2010. Quality
Improvement Methodologies – PDCA Cycle, RADAR
Matrix, DMAIC and DFSS, Journal of Achievements
in Materials and Manufacturing Engineering, vol 43,
issue 1, pp. 476-483.
Tague N.R. 2005. The Quality Toolbox , ASQ Quality
Press, Milwaukee, 2
nd
edition.
Truscott W. 2003. Six Sigma: Continual Improvement For
Businesses, Butterworth Heinemann. New York.
Wojtaszak M., Biały W. 2013. Measurement system
analysis of attribute or continuous data, as a one of the
first steps in Lean Six Sigma projects. In Systems
supporting production engineering, ed. J.
Kaźmierczak. PA NOVA. Gliwice, pp. 144-162.
Zasadzień M., Midor K. 2015. Innovative application of
quality management tools in a hard coal mine. In
Proceedings of 15th International Multidisciplinary
Scientific GeoConference SGEM 2015, book1, vol. 3,
pp. 415-422.
Żurakowski F. 2004. Funkcjonowanie przedsiębiorstwa.
Zarządzanie, Wydawnictwa Szkolne i Pedagogiczne.
Warszawa.
.
ICORES 2017 - 6th International Conference on Operations Research and Enterprise Systems
320
