
Remote Photoplethysmography for the Neuro-electrostimulation
Procedures Monitoring
The Possibilities of Remote Photoplethysmography Application for the Analysis of
High Frequency Parameters of Heart Rate Variability
Vladimir Kublanov, Konstantin Purtov and Daniil Belkov
Research and Development Medical and Biological Engineering Center of High Technologies,
Ural Federal University, Mira str. 19, 620002, Yekaterinburg, Russian Federation
Keywords:
Autonomic Nervous System, Remote Photoplethysmography, Blood Volume Pulse, Heart Rate Variability,
Respiration, Remote Sensing.
Abstract:
The paper presents assessments of the remote photoplethysmography (rPPG) capabilities for evaluation of
heart rate variability (HRV) for monitoring the neuro-electrostimulation procedures. In our experiment, 20
minute long videos of 20 people in office lighting conditions were analyzed. We checked the accuracy of
well-known methods and some modern methods of rPPG. In this work, we evaluated the accuracy of rPPG
methods in high frequency (HF) band (0.4 - 0.15 Hz), and sub-bands (0.4 - 0.3 Hz), (0.3 - 0.15 Hz). For
the sub-band (0.3-0.15 Hz) HRV signals obtained with rPPG are better correlated with HRV signals obtained
with electrocardiography (ECG). The results have shown that POS method provides the best HRV parameter
evaluation.
1 INTRODUCTION
Due to increased mortality from cardiovascular dis-
eases devices for continuous monitoring of human
physiological parameters were actively developed in
the past decade. Nowadays the size of holter mon-
itors has been significantly reduced. Fitness tracker
and other devices for everyday use have appeared.
The main disadvantage of such devices is their influ-
ence on the organism caused by the contact with the
body. Thus, the remote monitoring methods are more
promising.
The cardiovascular system is one of the most im-
portant element of the human body. The heart rate
(HR) and heart rate variability (HRV) are the main
parameters that allow to investigate the cardiovascu-
lar system functioning.
In recent years researchers have presented a num-
ber of new methods for non-contact physiological
monitoring by using the remote photoplethysmogra-
phy technology (rPPG). There are already more than
300 articles about the development of this technology.
In these studies, the possibilities of applying rPPG
technology as an alternative channel for monitoring
the human state were actively investigated. In partic-
ular, there were approaches that use rPPG for mon-
itoring premature babies (N. Blanik and Leonhardt,
2016) and patients under anesthesia (U. Rubins and
Miscuks, 2013).Lots of articles have shown that rPPG
can reliably measure the HR in comparison with the
contact photoplethysmography. It was shown that it
is possible to determine the parameters of pulse rate
variability, blood oxygen saturation, respiratory rate
and other parameters in controlled experiments.
In many studies the video records shorter than 5
minutes were used. For example, in (M.Z.Poh and Pi-
card, 2011), (Y. Sun and Hu, 2012) the investigation
of pulse rate variability parameters in HF ( 0.4 - 0.15
Hz), LF ( 0.15 - 0.04 Hz) bands was conducted. In
such short periods of time subject is able to sit still.
So the influence of movements was minimal. Such
conditions impose significant limitations on the ap-
plicability of rPPG technology.
In other studies (Y. Sun and Greenwald, 2013),
(A.A Kamshilin and Giniatullin, 2013), specialized
light sources were used to enhance the rPPG sig-
nals. In (M.Z.Poh and Picard, 2011), (A. Moco and
de Haan, 2015), sources of ambient light, such as the
sun or a lamp ”Philips HF-3319 EnergyLight White”
in front of the skin were used. These sources provide
a uniform level of illumination. Such sources illu-
minate the face almost regardless of the position of
Kublanov V., Purtov K. and Belkov D.
Remote Photoplethysmography for the Neuro-electrostimulation Procedures Monitoring - The Possibilities of Remote Photoplethysmography Application for the Analysis of High Frequency
Parameters of Heart Rate Variability.
DOI: 10.5220/0006176003070314
Copyright
c
2017 by SCITEPRESS – Science and Technology Publications, Lda. All rights reserved

the head. However, light sources are usually located
above the head. Due to that, there is some reflection
and regions with different luminance.
The studies (M.Z.Poh and Picard, 2011), (Y. Sun
and Greenwald, 2013) evaluate the HRV parameters
in comparison with the contact photoplethysmogra-
phy (PPG). However, the most examined and reliable
way to determine the changes of the autonomic ner-
vous system by means of the HRV evaluation is based
on electrocardiography (ECG).
Earlier, we have presented the possibilities of as-
sessing the VLF and LF parameters assessment by
using the PCA-based rPPG (Kublanov and Purtov,
2015). However, it was shown that this method does
not give a correct estimation of the HF band.
The main idea of this work is to evaluate the pos-
sibilities of rPPG for detecting changes of HRV in the
HF band. To do this, we evaluate the accuracy of the
rPPG methods compared with the parameters of HRV
obtained by ECG.
Besides, we measure the respiratory rate (RR) by
using the motion tracking techniques with preprocess-
ing by Eulerian Video Magnification method. Such
techniques now are very popular, but they work only
if the person has relatively stable position in time.
2 MATERIALS AND METHODS
2.1 Methods
In recent years researchers have presented a number
of new methods for recovering rPPG signals. Their
full comparison with all the components and condi-
tions is not possible in a single article. Therefore, in
this paper we consider the methods, which:
1. Allow to process a signals in real-time;
2. Work with only one digital RGB camera;
3. Have varying physiological models of signals.
Thus, we choose the following methods: RoverG,
XoverY, CHROM, ICA, PCA, 2SR, POS. These
methods were proposed in the works (M.Z.Poh
and Picard, 2011),(D. McDuff and Picard, 2014),
(M. Lewandowska and Kocejko, 2011), (de Haan
and Jeanne, 2013), (W. Wang and de Haan, 2015),
(W. Wang and de Haan, 2016).
The settings for each of the rPPG method were
used in accordance with recommendations of the au-
thors. For example, the ICA method was imple-
mented in accordance with the specifications: we split
the signals to the 30 seconds overlap-add windows,
and use the JADE ICA algorithm. The pulse compo-
nent selection was based on the FFT analysis After
the selection, the signals were inverted according to
the rule: µ
peakamp
< µ
troughamp
,
where µ
peakamp
is the mean absolute peak value,
µ
troughamp
is the mean absolute trough value
Each rPPG method was used on the same skin
areas (pixels) to ensure the correctness of compari-
son. For each subject, the choice of skin boundaries
was made in HSV and YC
b
C
r
color formats. Before
the processing, the color boundaries were determined
manually to get the maximum skin area on the face
without areas with glare, because reflectance has great
influence on the parameters of rPPG signal.
In the first image of the video, the face area was
detected by using the Viola-Jones method (Viola and
Jones, 2001). In other images, it was tracked by us-
ing implementation of KCF method (F. Henriques and
Batista, 2015) which allows to work in real-time.
The method presented in a master thesis (Balakr-
ishnan, 2014) was used to RR detection. It allows to
estimate the RR signals by tracking the chest move-
ments with motion preprocessing by Eulerian video
magnification.
2.1.1 Evaluation Metrics
For comparison of different rPPG methods, we evalu-
ate their performance by the following metrics.
• The Pearson correlation coefficient was used to
evaluate the accuracy of different rPPG methods.
It allow to compare HR and HRV signals mea-
sured by rPPG with reference to PPG and ECG
signals.
• The signal to noise ratio (SNR) was used to as-
sess the quality of measured rPPG signals. It is
derived by the ratio between the energy around
the first HR harmonic and the remaining parts in
the 4 - 0.5 Hz frequency band. The location of the
first harmonic is determined by the contact PPG-
signal. It is was measured as follows:
SNR = 10 ·lg
(U
signal
)
2
(U
noise
)
2
, (1)
where U
signal
is the intensity of the first heart rate
harmonic, U
noise
is the intensity of the remaining
parts in the (4 - 0.5 Hz) frequency band.
2.2 Experiment
This work is performed at the Research and Devel-
opment Medical and Biological Engineering Center
of High Technologies, Ural Federal University (Rus-
sian Federation) with partisipation of employees of

the Psychiatry Department, Ural State Medical Uni-
versity (Russian Federation). Ethical committee ap-
proved of this study. Informed consent was obtained
from each subject. Twenty healthy volunteers (males
and females) aged from 20 to 25 took part in this
investigation. Records were made after using the
”SYMPATHOCOR-01” neuro-electrostimulation de-
vice (Kublanov, 2008).
Neuro-electrostimulation process with using the
SYMPATHOCOR-01 device is the procedure when
the device generates the field of spatially distributed
current pulses at the subject neck. The neuro-
electrostimulation effect can be measured by different
techniques, such as the ECG. It was decided to check
the accuracy of rPPG methods after the stimulation
procedure.
The experiment is conventionally divided into 3
parts. The first and the third parts are the 5 minute rest
periods when the subject does not do anything. In the
second part of the experiment the subjects performed
the ”Bourdon test” which took 10 minutes duration.
The test task is not considered in this study.
2.2.1 Description
Simultaneous recording of the video and human phys-
iological parameters (ECG, PPG, respiratory rate)
was carried out during the experiment. The studies
were all conducted indoors without sunlight. Each
subject sat in front of a monitor of a personal com-
puter (PC). The webcam was placed on the right from
the monitor at a distance of 0.5 meters from a subjects
face. The experiment room was illuminated by two
usual fluorescent light sources placed on the ceiling.
Each experiment was recorded and took 20 minutes.
Subjects were asked to sit in front of the camera and
perform a computer test.
All methods were implemented as a real-time ap-
plication in the Python 2.7. The application uses
the popular open-source packages OpenCV 2.4.11,
numpy, PyQt. The implementation runs on a com-
mon personal computer with computatonal unit Intel
Core i7 4770, 3,4 GHz, and 8 Gb DDR4 RAM.
2.2.2 Video Recording
Each experiment were recorded by using the low-
cost webcam Logitech C920, which allows to cap-
ture RGB frames approximately at 30 frames per sec-
ond (fps) in color (24 bits, 8 bit per color chan-
nel). The camera resolution was 640 × 480 pixels.
Each image frame was saved in raw png format to
the local database with a filename which contains the
time of the frame capture. The template of a file-
name format is ”image[%d] yyyy-MM-dd hh-mm-
ss.msec.png”, where %d means the sequential num-
ber of the image. Such a filename format allows to
accurately determine capture moments.
2.2.3 Contact Measurements
The referenced HR, HRV and RR signals were ob-
tained by the rehabilitation complex ”REACOR”
(MEDICOM MTD, Russian Federation). It pro-
vides a real-time registration of respiratory monitor-
ing, ECG and PPG with 250 Hz sampling rate and
stores the signals in the PC. To analyse and compare
the signals, all data were saved as comma-separated
text files in the local database. To ensure good elec-
trical contact of the electrodes with the body, gel
”Uniagel” (Geltek-Medica, Russian Federation) was
used. The changes in finger blood flow are measured
by contact photoplethysmography from left forefin-
ger. RR signal was measured by using the respiration
transducer belt.
3 RESULTS
In this section, the results of measuring HR, HRV
and RR obtained by different rPPG methods are pre-
sented. For convenience, we show the evaluation only
for 7 subjects, but their data are comparable with other
subjects.
3.1 Heart Rate
Figure 1 shows the spectrograms of measured sig-
nals. First column contains spectrograms of PPG sig-
nals. The other columns present the spectrograms
of rPPG signals obtained by the following meth-
ods: PCA, ICA, 2SR, POS, CHROM, XoverY and
RoverG. All spectrograms were calculated for 10-
second time windows with 5-second overlap.
The HR was determined as the maximum power
spectrum in the (4 - 0.5 Hz) frequency band, which
corresponds to the range of 30 to 240 heart beats per
minute. In this case the error of determining HR was
less a 0.1 Hz.
Tables 1 and 2 represent the accuracy of the HR
for these rPPG methods. Table 1 contains the aver-
age value of the absolute difference between rPPG
HR and PPG HR. Table 2 contains the values of stan-
dard deviation for the difference between rPPG HR
and PPG HR.
Currently, ICA and PCA methods are the most
common ways to measure rPPG signals and estimate
the HR. According to the data presented in Table 1,
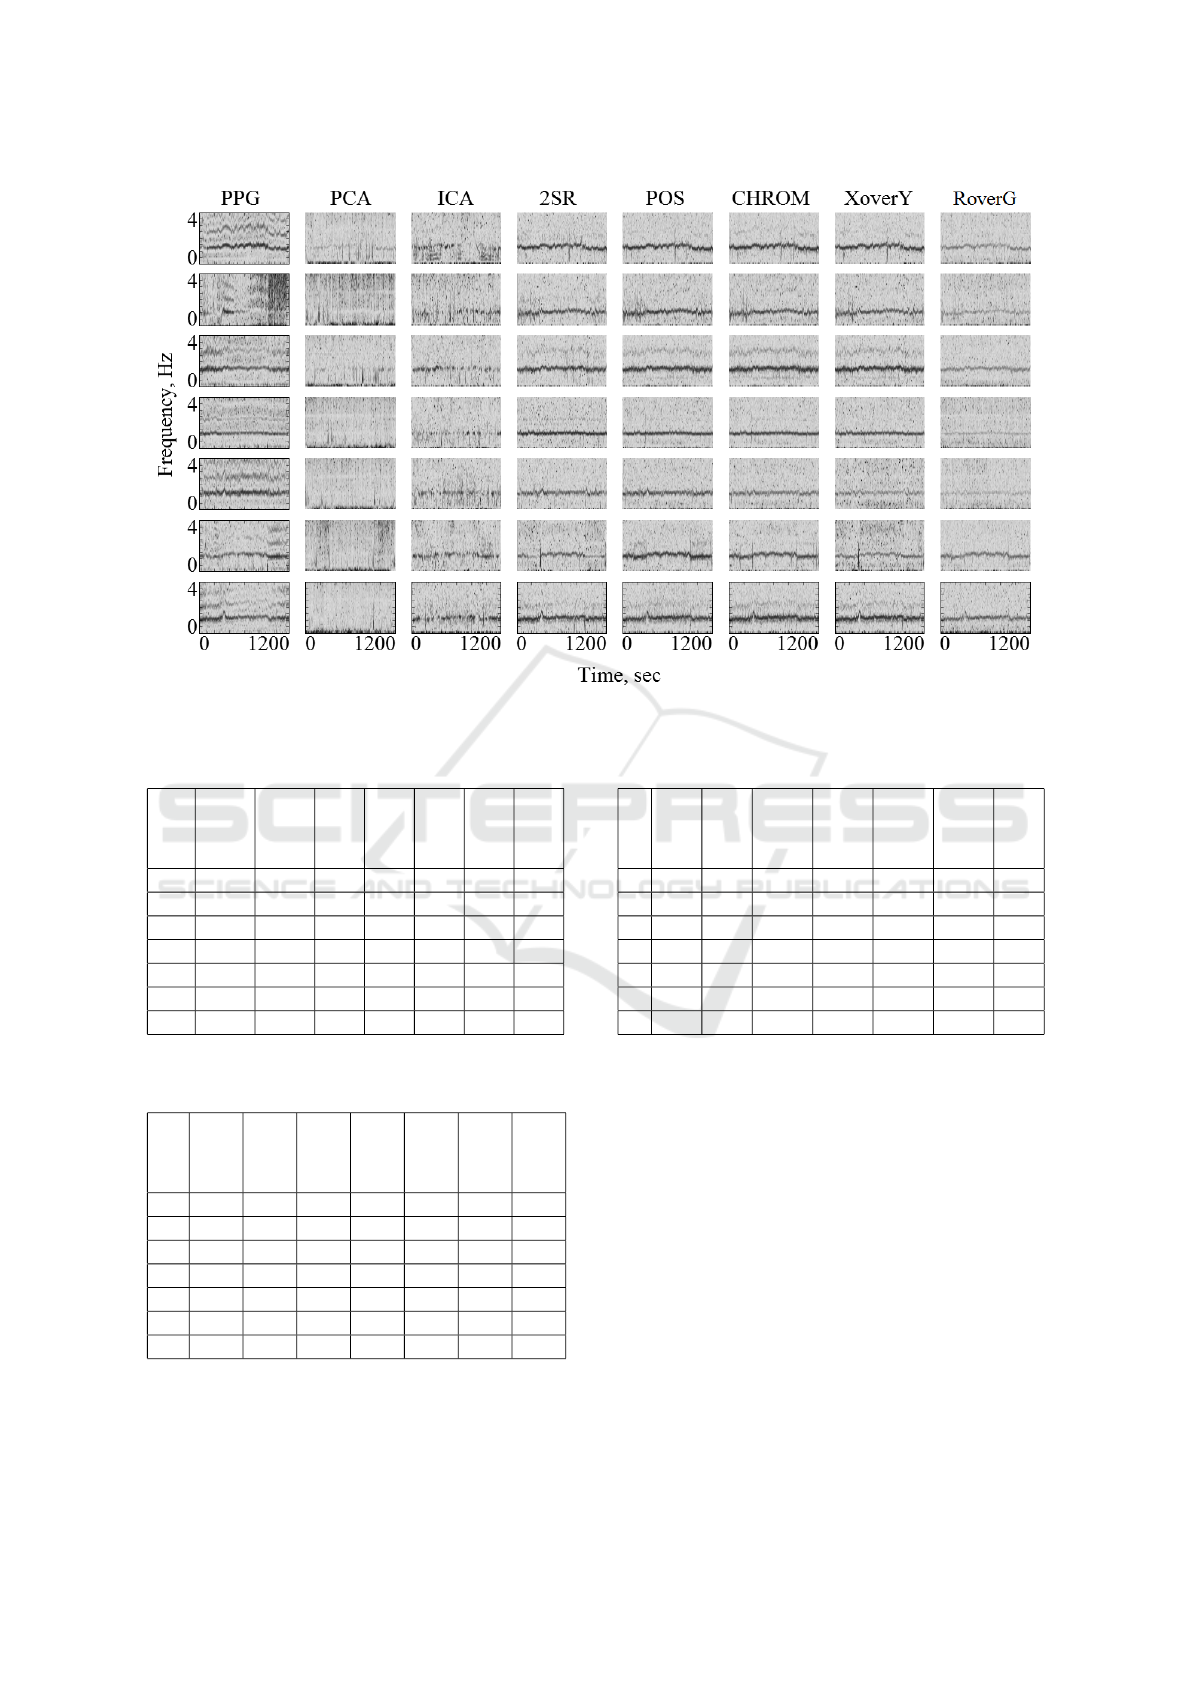
Figure 1: The spectrograms of PPG and rPPG signals; rows denote the unique subjects.
Table 1: Mean values of absolute difference between HR
rPPG and HR PPG, msec.
Subjects
PCA
ICA
2SR
POS
CHROM
XoverY
RoverG
1 133 302 11 8 8 8 11
2 184 154 74 75 74 76 84
3 372 145 8 8 9 9 16
4 189 181 3 4 4 3 6
5 414 207 23 30 31 18 45
6 301 88 18 9 14 19 13
7 168 77 10 12 10 11 14
Table 2: Standart deviation of absolute difference between
HR rPPG and HR PPG, msec.
Subjects
PCA
ICA
2SR
POS
CHROM
XoverY
RoverG
1 236 292 64 46 45 47 32
2 226 230 184 185 185 187 186
3 414 273 32 33 34 34 46
4 339 265 16 19 19 15 22
5 401 281 74 102 102 47 115
6 255 204 78 36 60 73 49
7 264 160 35 39 34 36 42
HR accuracy obtained by these methods is signif-
icantly worse than HR accuracy obtained by other
methods.
Table 3: Mean value of SNR rPPG signals with 10 sec
overlap-add window, dB.
Subjects
PCA
ICA
2SR
POS
CHROM
XoverY
RoverG
1 7.30 6.85 10.15 10.70 10.65 10.60 8.85
2 7.15 7.05 9.35 9.75 9.80 9.60 8.40
3 6.50 6.85 9.65 10.00 10.05 9.90 8.95
4 6.30 6.25 10.95 11.40 11.30 11.35 8.95
5 5.80 5.95 8.95 9.45 9.15 8.95 7.60
6 6.05 7.35 9.25 10.10 10.15 9.75 9.45
7 6.35 7.10 9.85 9.90 10.3 10.30 9.25
The HR estimates obtained by 2SR, POS,
CHROM, XoverY are highly reliable and slightly dif-
ferent from each other. The RoverG method is one of
the first rPPG method. So, it is more inaccurate than
others, but much better than PCA or ICA.
The quality of rPPG signals was evaluated by SNR
metric, which was described in the previous section.
Table 3 presents the results of the average SNR, where
each score was obtained as the average value of SNR
calculated for 10 second intervals with a 5 second
overlap.
According to Table 3, it is evident that CHROM
and POS methods show the largest SNR values. In
our tests for 20 people, the difference between these
methods does not exceed 1 dB. ICA and PCA meth-
ods showed the lowest SNR results. This may be due
to the large time intervals (30 seconds) required for

the correct calculation of these methods.
3.2 Heart Rate Variability
HRV signals are of great interest in the evaluation of
parameters of cardiovascular system. According to
the international standard of research (HRV, 1993),
HRV signal can be determined as the distance be-
tween the peaks of the PPG signal.
To increase the accuracy of peaks localization,
each rPPG signal was interpolated to 250 Hz sampling
rate by using a cubic spline interpolation. It was se-
lected to correspond the accuracy of contact methods.
After that, all signals were filtered by the 5 or-
der Butterworth bandpass filter with 1 Hz bandwidth
and central frequency selected according to the cur-
rent HR. To calculate the pulse to pulse intervals, the
common PPG peak detection algorithm was used.
All extrasystoles in the HRV ECG signals were re-
moved in accordance with the article (T. Briiggemann
and Schroder, 1996).
Tables 4, 5, 6 present the results of a comparative
analysis of the ECG HRV and rPPG HRV signals in
VLF (0.04 - 0.003 Hz), LF (0.15-0.04 Hz) and HF
(0.4 - 0.15 Hz) bands. The Pearson correlation coeffi-
cient was used as the similarity criterion.
According to Tables 4, 5, 6, PCA, ICA methods
show significantly poorer scores than other methods.
It can be explained by the fact that the subjects were
working with the PC, and, thus, did not control their
behavior during the video recording.
According to Table 4, in the VLF band the HRV
rPPG signals were determined with high accuracy by
methods POS, CHROM, XoverY and 2SR. The Pear-
son correlation coefficient for these methods in all
studies is higher than 0.9. The most accurate esti-
mates were obtained by POS method.
Table 5 shows that in the LF band the most ac-
curate methods are POS, CHROM, XoverY and 2SR.
The Pearson correlation coefficient in this case varies
from 0.7 to 1.
In the HF band, the maximum values of the Pear-
son correlation coefficient match to POS, CHROM,
XoverY and 2SR. However, these values were
changed in the range from 0 to 0.9. This suggests a
weak correlation between rPPG HRV and ECG HRV
signals in the HF band.
3.3 Respiration Rate
The Pearson correlation coefficients obtained in HF
band were low. Therefore, it was decided to deter-
mine the accuracy of various subbands of HF. First of
all the accuracy of RR selection was checked. The
Table 4: Pearson correlation coefficient between ECG HRV
and rPPG HRV VLF (0.04 - 0.003 Hz) band.
Subjects
PCA
ICA
2SR
POS
CHROM
XoverY
RoverG
1 0.48 0.42 0.95 0.97 0.98 0.98 0.92
2 0.38 0.59 0.89 0.87 0.93 0.87 0.87
3 0.12 0.06 0.97 0.99 0.98 0.96 0.94
4 0.41 0.25 1.00 1.00 0.94 1.00 0.89
5 0.06 0.03 0.93 0.95 0.90 0.93 0.67
6 0.10 0.32 0.93 0.97 0.94 0.94 0.96
7 0.32 0.73 0.95 0.99 0.99 0.98 0.97
Table 5: Pearson correlation coefficient between ECG HRV
and rPPG HRV LF (0.15 - 0.04 Hz) band.
Subjects
PCA
ICA
2SR
POS
CHROM
XoverY
RoverG
1 0.02 0.09 0.76 0.81 0.85 0.81 0.49
2 0.09 0.30 0.69 0.73 0.72 0.69 0.60
3 0.04 0.27 0.86 0.92 0.90 0.84 0.75
4 0.12 0.01 0.95 0.95 0.84 0.97 0.63
5 0.02 0.17 0.72 0.79 0.62 0.70 0.47
6 0.03 0.25 0.67 0.81 0.68 0.78 0.75
7 0.05 0.19 0.68 0.87 0.88 0.83 0.72
Table 6: Pearson correlation coefficient between ECG HRV
and rPPG HRV in HF (0.4 - 0.15 Hz) band.
Subjects
PCA
ICA
2SR
POS
CHROM
XoverY
RoverG
1 0.04 0.03 0.44 0.48 0.50 0.41 0.30
2 0.04 0.12 0.45 0.54 0.39 0.47 0.25
3 0.05 0.03 0.63 0.67 0.66 0.57 0.44
4 0.12 0.01 0.53 0.31 0.38 0.55 0.11
5 0.03 0.06 0.18 0.36 0.13 0.26 0.07
6 0.08 0.16 0.53 0.56 0.42 0.55 0.51
7 0.13 0.07 0.71 0.74 0.76 0.74 0.56
respiration is the main component in HF band. Usu-
ally it has the biggest values in HRV HF spectrogram.
Figure 2 presents the spectrograms of RR signals
measured by different methods. Each row contains
the spectrograms of signals for a single subject. The
contact RR (cRR) signal was obtained by using res-
piration transducer belt placed on the subject chest.
Video RR (vRR) was obtained by using the method
based on Eulerian video magnification with tracking
points on the subject chest by Lucas-Kanade algo-
rithm. The other columns in the figure present the
HRV signals that were obtained by ECG and rPPG
techniques in HF band.
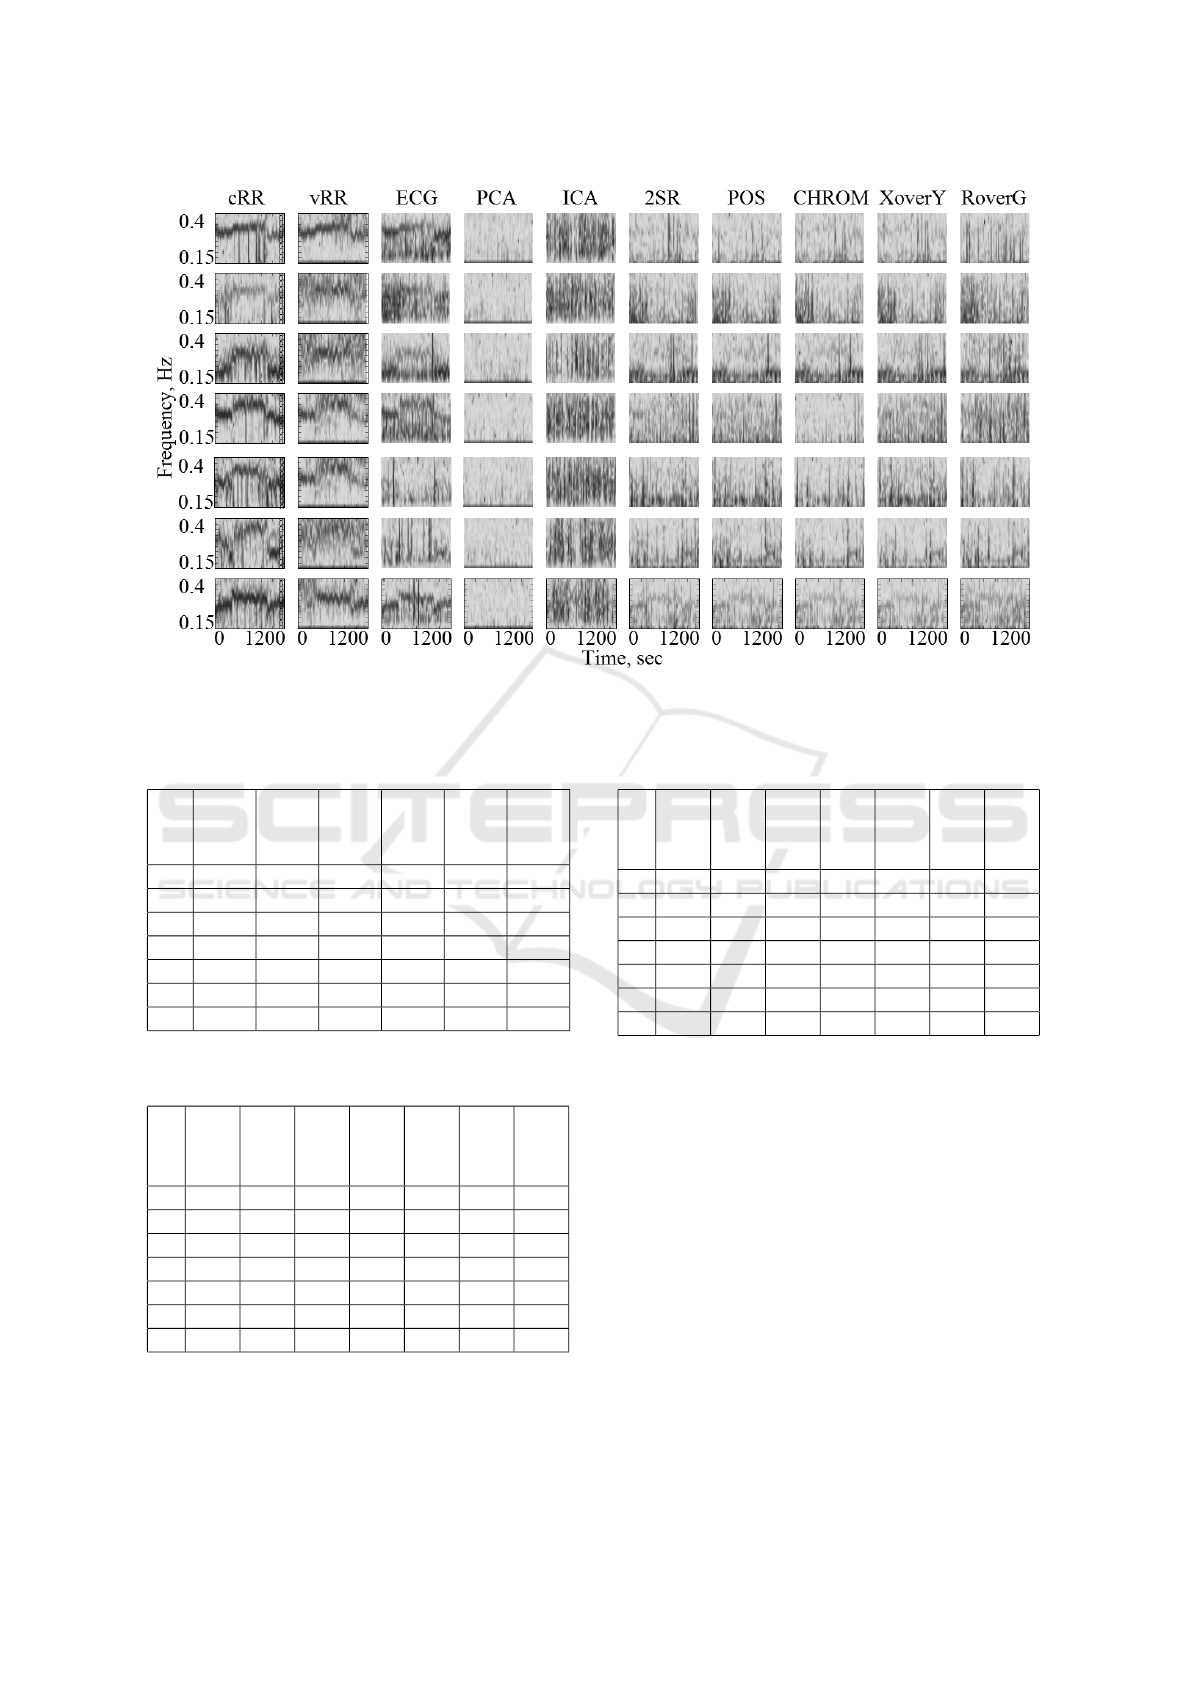
Figure 2: The spectrograms of HRV signals obtained by rPPG and ECG, and respiration signals measured by video (vRR)
and respiration belt (cRR).
Table 7: The comparision of RR signals measured by video
and respiration belt.
Subjects
mean
std
cRR
min
vRR
min
cRR
max
vRR
max
1 0.03 0.09 0.15 0.35 0.47 0.50
2 0.07 0.09 0.15 0.33 0.45 0.51
3 0.11 0.10 0.18 0.27 0.42 0.55
4 0.01 0.05 0.33 0.33 0.53 0.56
5 0.04 0.06 0.23 0.27 0.53 0.57
6 0.02 0.05 0.30 0.30 0.45 0.52
7 0.03 0.09 0.15 0.35 0.47 0.55
Table 8: Pearson correlation coefficient between ECG HRV
and rPPG HRV in HF (0.4 - 0.3 Hz) sub-band.
Subjects
PCA
ICA
2SR
POS
CHROM
XoverY
RoverG
1 0.03 0.02 0.43 0.47 0.49 0.43 0.34
2 0.02 0.09 0.41 0.50 0.30 0.46 0.18
3 0.01 0.01 0.41 0.39 0.43 0.32 0.26
4 0.15 0.04 0.47 0.11 0.27 0.46 0.01
5 0.00 0.11 0.06 0.19 0.05 0.04 0.02
6 0.06 0.11 0.39 0.34 0.22 0.32 0.29
7 0.14 0.01 0.66 0.66 0.70 0.67 0.47
According to the whole set of data some of which
are presented in Figure 2, signals vRR match well
with signals cRR. Table 7 shows the comparision of
Table 9: Pearson correlation coefficient between ECG HRV
and rPPG HRV in HF (0.3 - 0.15 Hz) sub-band.
Subjects
PCA
ICA
2SR
POS
CHROM
XoverY
RoverG
1 0.04 0.02 0.47 0.51 0.53 0.43 0.28
2 0.10 0.14 0.47 0.57 0.44 0.47 0.31
3 0.08 0.07 0.74 0.78 0.77 0.69 0.55
4 0.09 0.00 0.60 0.49 0.48 0.64 0.19
5 0.04 0.01 0.34 0.46 0.24 0.40 0.11
6 0.08 0.21 0.62 0.69 0.53 0.67 0.63
7 0.10 0.14 0.73 0.79 0.80 0.78 0.63
accuracy for cRR and vRR signals. The first col-
umn corresponds to the mean deviation RR for 60-
second time intervals with 30 second overlap. The
second column shows the values of the standard devi-
ation. Other columns contain the values which corre-
spond to minimal (cRR
min
and vRR
min
) and maximal
(cRR
max
and vRR
max
) measured values.
It can be seen that the HRV ECG signals were
slightly modulated by respiration. In many cases, they
contain other fundamental frequencies. In HRV rPPG
signals the breath in fact is absent. HRV signals ob-
tained by ICA and PCA methods in HF band look like
noise.
We hypothesized that for frequencies below the
mean breathing rate the correlation will be high. The
HF band was divided into two sub-bands 0.4 - 0.3 Hz
and 0.3-0.15 Hz. The Pearson correlation coefficients

for the signals in these sub-bands are shown in Tables
8 and 9 respectively.
According to Tables 8 and 9, the lower frequency
sub-bands of HRV rPPG and HRV ECG are more cor-
related. In this case the value of correlation coefficient
has increased in all studies.
Therefore, RR measured by rPPG methods should
be tested additionally, for example, using the method
of chest movement evaluation.
4 CONCLUSION
One of the main results of this study is the compari-
son of existing real-time rPPG methods. It was shown
that the most common methods ICA and PCA have
the worst assessment of HR and HRV. Recently intro-
duced POS method has the greatest accuracy in HR
and HRV estimation. It allows to detect rPPG signals
even under changing light conditions.
Another conclusion is that the existing rPPG tech-
niques allow to measure the parameters of HRV with
a low-cost camera in VLF (0.04 - 0.003 Hz) and LF
(0.15-0.04 Hz) bands with high-precision accuracy.
The HRV in HF band has the lowest reliability. Our
study showed that the low frequency sub-band of the
HF has a larger correlation with HRV ECG than the
high frequency sub-band.
RR is another parameter which can be checked
by video. It was shown that under normal condi-
tions HRV rPPG signals contain almost no informa-
tion about respiration. Instead of this, the accuracy
of motion detection method proved to be the most
reliable for breathing detection. Therefore, the best
way to determine RR is the estimation of chest move-
ments.
In future works, we plan to investigate the possi-
bilities of rPPG methods in clinical practice, and us-
ing the rPPG as the biofeedback method for neuro-
electrostimulation.
ACKNOWLEDGEMENTS
We would like to thank the volunteers for participa-
tion in this study.
The work was supported by Act 211 Government
of the Russian Federation, contract 02.A03.21.0006.
And partially supported by Russian Foundation for
Assistance to Small Innovative Enterprises (FASIE)
(Russia).
REFERENCES
(1993). Task force of the european society of cardiology and
the north american society of pacing electrophysiol-
ogy. heart rate variability: standards of measurement,
physiological interpretation, and clinical use. Com-
puters in cardiology.
A. Moco, S. S. and de Haan, G. (2015). Ballistocardio-
graphic artifacts in ppg imaging. IEEE TRANSAC-
TIONS ON BIOMEDICAL ENGINEERING.
A.A Kamshilin, V. Teplov, E. N.-S. M. and Giniatullin, R.
(2013). Variability of microcirculation detected by
blood pulsation imaging. PloS one.
Balakrishnan, G. (2014). Analyzing pulse from head mo-
tions in video.
D. McDuff, S. G. and Picard, R. (2014). Improvements
in remote cardio-pulmonary measurement using a five
band digital camera. IEEE TRANSACTIONS ON
BIOMEDICAL ENGINEERING.
de Haan, G. and Jeanne, V. (2013). Robust pulse rate from
chrominance-based rppg. IEEE TRANSACTIONS ON
BIOMEDICAL ENGINEERING.
F. Henriques, R. Caseiro, P. M. and Batista, J. (2015).
High-speed tracking with kernelized correlation fil-
ters. TPAMI.
Kublanov, V. (2008). A hardware-software system for di-
agnosis and corrections of autonomic dysfunctions.
Biomedical Engineering.
Kublanov, V. and Purtov, K. (2015). Heart rate variability
study by remote photoplethysmography. Biomedicin-
skaya radioe’lektronika.
M. Lewandowska, J. R. and Kocejko, T. (2011). Measuring
pulse rate with a webcam a non-contact method for
evaluating cardiac activity. Proceedings of the Feder-
ated Conference on Computer Science and Informa-
tion Systems.
M.Z.Poh, D. and Picard, R. (2011). Advancements in non-
contact, multiparameter physiological measurements
using a webcam. IEEE Transactions on Biomedical
Engineering.
N. Blanik, K. Heimann, C. P.-M. P. V. B. B. V. T. O. and
Leonhardt, S. (2016). Remote vital parameter mon-
itoring in neonatology robust, unobtrusive heart rate
detection in a realistic clinical scenario. Biomedizinis-
che Technik.
T. Briiggemann, D. Andresen, D. W.-J. R. A. C. and
Schroder, R. (1996). Heart rate variability: How to
exclude extrasystoles from the analysis? Circulation.
U. Rubins, J. S. and Miscuks, A. (2013). Application of
colour magnification technique for revealing skin mi-
crocirculation changes under regional anaesthetic in-
put. In SPIE Proceedings Vol. 9032:. SPIE.
Viola, P. and Jones, M. (2001). Robust real time object de-
tection. Second International Workshop on Statistical
and Computational Theories of VisionModeling.
W. Wang, S. S. and de Haan, G. (2015). A novel algorithm
for remote photoplethysmography: Spatial subspace
rotation. IEEE TRANSACTIONS ON BIOMEDICAL
ENGINEERING.

W. Wang, B.der Brinker, S. S. and de Haan, G. (2016). Al-
gorithmic principles of remote-ppg. IEEE TRANSAC-
TIONS ON BIOMEDICAL ENGINEERING.
Y. Sun, S. Hu, V. A.-P. R. K. and Greenwald, S. (2013).
Noncontact imaging photoplethysmography to effec-
tively access pulse rate variability. Biomedical optics.
Y. Sun, C. Papin, V. A.-P. R. K. S. G. and Hu, S. (2012). Use
of ambient light in remote photoplethysmographic
systems: comparison between a high-performance
camera and a low-cost webcam. Biomedical optics.
