
NodeTrix-CommunityHierarchy: Techniques for Finding Hierarchical
Communities for Visual Analytics of Small-world Networks
Jaya Sreevalsan-Nair and Shivam Agarwal
Graphics-Visualization-Computing Lab, International Instittue of Information Technology, Bangalore, India
Keywords:
Small-world Networks, NodeTrix, Similarity Matrix, Hierarchical Communities, Workflow, Visual Analytics,
Clustering Algorithm.
Abstract:
While there are several visualizations of the small world networks (SWN), how does one find an appropriate
set of visualizations and data analytic processes in a data science workflow? Hierarchical communities in
SWN aid in managing and understanding the complex network better. To enable a visual analytics workflow
to probe and uncover hierarchical communities, we propose to use both the network data and metadata (e.g.
node and link attributes). Hence, we propose to use the network topology and node-similarity graph using
metadata, for knowledge discovery. For the construction of a four-level hierarchy, we detect communities on
both the network and the similarity graph, by using specific community detection at specific hierarchical level.
We enable the flexibility of finding non-overlapping or overlapping communities, as leaf nodes, by using spec-
tral clustering. We propose NodeTrix-CommunityHierarchy (NTCH), a set of visual analytic techniques for
hierarchy construction, visual exploration and quantitative analysis of community detection results. We ex-
tend NodeTrix-Multiplex framework (Agarwal et al., 2017), which is for visual analytics of multilayer SWN,
to probe hierarchical communities. We propose novel visualizations of overlapping and non-overlapping com-
munities, which are integrated into the framework. We show preliminary results of our case-study of using
NTCH on co-authorship networks.
1 INTRODUCTION
Visual analytics of small world networks (SWNs),
which include social networks, is an approach to ex-
tract knowledge from a complex network. Several
existing visualizations of SWNs tend to exclusively
use the data-space (Henry et al., 2007); while a small
set of visualization techniques for multi-variate net-
works and multiplex networks make use of the meta-
data (i.e. node and link attributes) (Perer and Shnei-
derman, 2006) (van den Elzen and van Wijk, 2014).
However, the question remains as to how much these
visualizations help in fitting other data analytic pro-
cesses into the data science workflow
1
of a network
researcher or analyst.
Visual analysis of a large community becomes
more tractable upon exploring its smaller child com-
munities. Hence, hierarchical communities gives
1
We disambiguate the usage of “workflow,” where our
work refers to the analysis and reflection phases in the “re-
search programming” workflow (Guo, 2012) or “data sci-
ence” workflow (Guo, 2013), as opposed to scientific work-
flow systems (Davidson and Freire, 2008).
more insight to the dynamics of large networks.
Both the network data and metadata can be used
to probe and uncover such hierarchies. Here, we
use node-similarity analysis for knowledge discov-
ery from metadata. Use of visual analytics makes
our targeted workflow semi-automated, with the do-
main expert-in-the-loop. Thus, we propose NodeTrix-
CommunityHierarchy (NTCH), a set of techniques
for visual analytics of hierarchical communities in
SWNs. NTCH is designed to use nested views (Javed
and Elmqvist, 2012) for compact visualizations; as
well as, to use selective data and algorithms for build-
ing a four-level community hierarchy. Consider an
instance of an outcome of NTCH – while the co-
authorship network visualization uncovers informa-
tion on locally dense subnetworks and their central
actors, there is more knowledge that can be extracted
from text analysis of abstracts of publications in the
network. This information has the potential to demon-
strate similarities in research profiles of authors, and
further predict if two authors in a smaller commu-
nity will publish together in future. Such localized
information can eventually enable one to understand
140
Sreevalsan-Nair J. and Agarwal S.
NodeTrix-CommunityHierarchy: Techniques for Finding Hierarchical Communities for Visual Analytics of Small-world Networks.
DOI: 10.5220/0006175701400151
In Proceedings of the 12th International Joint Conference on Computer Vision, Imaging and Computer Graphics Theory and Applications (VISIGRAPP 2017), pages 140-151
ISBN: 978-989-758-228-8
Copyright
c
2017 by SCITEPRESS – Science and Technology Publications, Lda. All rights reserved

(a) (b)
Figure 1: (a) Our proposed set of techniques, NodeTrix-CommunityHierarchy, for visual analytics of SWNs. (b) Schematic
diagram of four-level community hierarchy in a SWN, constructed by using its metadata to generate the similarity graph and
choosing nodes and community detection algorithms for further division.
the global dynamics of large networks. Another goal
of NTCH is to explore the formation of overlap-
ping communities, which is how real communities are
formed. Overlapping communities is a challenge with
respect to detection, representation, and visualization;
due to which most of the existing work are limited
to considering non-overlapping communities. Hence,
NTCH has the flexibility of finding overlapping com-
munities in the leaf nodes of the hierarchy, using spec-
tral clustering.
We reuse the NodeTrix (Henry et al., 2007) for
visualizing SWNs. NodeTrix exploits the “locally
dense, globally sparse” topology of SWN, in provid-
ing a nested view in a hybrid visualization. Commu-
nities extracted using modularity-based methods, are
locally dense subnetworks, which are represented as
matrices or “aggregated nodes” in NodeTrix. These
methods yield large communities in large SWNs.
Network science has shown that a viable commu-
nity must be of size 150 (the Dunbar number (Dun-
bar, 1998)), or more compactly, 100 (Leskovec et al.,
2009). NTCH enables decision-making for commu-
nity analytics, such as, which communities can be
explored for further divisions and which community
detection approaches can be used to find the leaf
nodes (Figure 1(a)). Our previous work, NodeTrix-
Multiplex (NTM) (Agarwal et al., 2017), is a visual
analytic framework which extends NodeTrix with a
focus+context approach for analyzing multiplex or
multi-relational networks. Here, we use NTM to vi-
sualize SWN with its similarity graph/network layer,
as well as to extend NTM to perform community an-
alytics (Figure 1(b)).
Our novel contributions in NTCH are two-fold:
firstly, in using a combination of visual analytics and
quantitative analysis for making decisions on con-
structing a community hierarchy; and secondly, in
extending NTM for cluster analytics on probing leaf
node communities. We demonstrate preliminary re-
sults of using NTCH on two co-authorship networks.
Notations: A SWN is denoted as N = {V ,E,E
S
},
where V is the vertex
2
set of the network, and E the
edge set, and E
S
the edge set in the node-similarity
graph. e(u,v) ∈ E or E
S
is an edge exists between
vertices u, v ∈ V and it stores edge weight, a nor-
malized real value. L
i
is the i
th
level of community
hierarchy of the network, and C
L
i
j
is the j
th
of the
N
i
communities in the i
th
level (i.e., 0 ≤ j < N
i
). S
i
is the subnetwork of interest in the i
th
layer, where
S
i
=
S
k
C
L
i
k
, where k indicates selected communities.
C
L
i
j
and S
i
are vertex sets; their edge sets contain
edges whose vertices belong to the vertex sets, inclu-
sively. In our work, In L
0
, S
0
= C
L
0
0
= N . N
i
com-
munities in L
i
are detected when community detec-
tion is applied to S
i−1
. For nested community detec-
tion, we refer to N
c
to be the number of communities
that can be detected in a (generic) community C, ir-
respective of the hierarchical levels. For quantitative
analysis, we use Newman-Girvan modularity as Q
h
,
generalized modularity as Q
g
, silhouette coefficient
as SC, and fuzzy partition coefficient as FPC. A den-
sity metric to check the “goodness” of the community
detection within a selected subnetwork, R
e
, is defined
as the ratio of number of inter-community links to the
total number of links in the subnetwork, prior to com-
munity detection. Intermediate matrices such as de-
gree matrix, modularity matrix, weight matrix, clus-
ter membership matrix, and identity matrix of size n
are referred to as D, B, W , U, and I
n
, respectively.
The two co-authorship networks in our case-study are
the IEEE Infovis conference (IV) and the IEEE VAST
conference (VA) co-authorship networks.
2
We refer to “network”, “nodes” and “links” with re-
spect to the dataset, and “graph”, “vertices”, and “edges,”
to the data structures, respectively.
NodeTrix-CommunityHierarchy: Techniques for Finding Hierarchical Communities for Visual Analytics of Small-world Networks
141

2 RELATED WORK
We look at relevant work on visualization of commu-
nities in complex networks, and community detection
techniques for finding overlapping communities in a
hierarchy, which are integral parts of design decisions
for NTCH.
Visualization of Communities in Complex Net-
works: NodeTrix (Henry et al., 2007) is a hybrid vi-
sualization of social networks, where the small world
property of “globally sparse but locally dense” has
been exploited to provide the layout. It integrates bet-
ter readability of node-link and matrix representations
of the network in respective scenarios (i.e. sparse and
dense nature of the network which in the global and
local spatial context, respectively) (Ghoniem et al.,
2004). NodeTrix has been extended (Henry et al.,
2008) to include node duplication to indicate over-
lap of a node in multiple communities. In our pre-
vious work on NodeTrix-Multiplex (NTM) (Agarwal
et al., 2017), we use NodeTrix for the network vi-
sualization of multilayer SWNs. NTM introduces a
focus+context approach by using communities in the
SWN layer as foci. A hybrid data model is used in
NTM, where any layer of the focus can be visualized;
and the remaining network, i.e. the context, is visu-
alized in another layer. NTM has used matrix seri-
ation to finding patterns of near-cliques within a fo-
cus. In NTCH, we use these patterns to propose pa-
rameters for community detection within the focus.
NTM enables users to find communities which persist
across layers in these subnetworks. Our implementa-
tion of NTCH is built on the visual analytic tool de-
veloped using NTM. Similar to our proposed cluster
visualization techniques, visualizations of groups in
graphs (Vehlow et al., 2015) use logical visual group-
ings. In contrast to our matrix visualization tech-
niques and nested views, node-link diagrams and inte-
grated (linked) views have been widely used for visu-
alizing hierarchical structures in networks (Rufiange
et al., 2012; Shi et al., 2009; Vehlow et al., 2013).
Detangler (Renoust et al., 2015) is a visual analyt-
ics system for multiplex networks, where new data
abstractions, such as substrate and catalyst networks,
have been used for visualization.
Hierarchical and Overlapping Communities in
Complex Networks: The algorithms for identify-
ing hierarchical overlapping communities in complex
networks, often use agglomerative methods. In such
methods, the overlap between communities is studied
across layers. However, we use divisive methods us-
ing partitioning (clustering) methods, with a restric-
tion on finding overlapping communities in L
2
com-
munities. The use of divisive methods and its re-
striction are due to the limitations of our proposed
workflow in conjunction with use of visual analyt-
ics. In many of the existing agglomerative methods,
each network node is added to multiple communities
until a termination criterion is satisfied. This crite-
rion is usually based on properties such as, node fit-
ness (Lancichinetti et al., 2009), gain in similarity-
based modularity (Huang et al., 2010), and local-first
approach (Coscia et al., 2014). Divisive methods typ-
ically use Newman-Girvan modularity (Newman and
Girvan, 2004), Q
h
, as a termination condition for par-
titioning (Fortunato, 2010), e.g. Louvain commu-
nity detection (Blondel et al., 2008), and yield non-
overlapping communities. We have used the gener-
alized modularity function, Q
g
, as given in (Havens
et al., 2013) for computing modularity for both over-
lapping as well as non-overlapping communities; Q
g
being equivalent to Q
h
in the latter.
Our use of similarity graph for analyzing the
network is equivalent to an abstraction of a multi-
relational or multiplex network (Kivel
¨
a et al., 2014).
Use of modularity for finding non-overlapping (or
crisp) communities has been extended to multilayer
networks (Bennett et al., 2015)(Mucha et al., 2010).
However, overlapping community detection in multi-
layer network has inherent challenges, e.g. percola-
tion of communities across layers. (De Domenico
et al., 2015) have proposed use of modular flows
between nodes across layers to identify overlapping
communities in multilayer networks, in flat hierarchy.
We use a similar concept, by evaluating the modu-
lar flows occur in aggregated nodes (communities in
L
2
) across layers in community hierarchy. Newman
has proposed the use of spectral cuts using modularity
matrix for community detection in networks (New-
man, 2006) as an improvement over using the adja-
cency or weight matrix. In a similar vein, we propose
to use spectral clustering for finding leaf node com-
munities, with the flexibility of finding overlapping
or non-overlapping communities.
Fuzzy c-means algorithm has been used for
overlapping community detection in complex net-
works (Zhang et al., 2007; Xie et al., 2013). The
soft modularity function Q
g
(Havens et al., 2013),
which is a generalized function for both crisp and
fuzzy communities, has been an improvement over
the modularity function given in (Zhang et al., 2007)
for overlapping communities. Q
g
gives probabilistic
membership matrix whereas the latter uses possibilis-
tic membership, with a user-defined threshold.
IVAPP 2017 - International Conference on Information Visualization Theory and Applications
142

3 HIERARCHICAL
COMMUNITIES
Different from NodeTrix, which is exclusively for vi-
sualizing the layout of SWNs, our motivation is to
devise techniques for a “data science” workflow for
exploring a community hierarchy in the network, us-
ing both the network data as well as the metadata.
Two of the integral design decisions of our workflow
is to perform network analysis for community hier-
archy ; and incorporate processes which will allow
finding the leaf node communities. For the former,
we use the defining matrices of the network, such as
adjacency and similarity; and for the latter, we use vi-
sual analytics of communities in the third level. Since
our analysis is in the matrix space, matrix seriation
is important for identifying interesting patterns in the
matrix, needs to be included in our workflow.
Use of Metadata: Owing to the small world prop-
erty, within two levels of community detection using
modularity-based methods (e.g. Louvain), closely-
knit communities are often uncovered in a SWN.
Such communities are mostly complete subnetworks
(near cliques), or subnetworks with hubs, owing to
which further divisiveness in the community hierar-
chy using the network data causes fragmentation. In
existing literature, use of community size as a pa-
rameter for finding the viability of a community has
been established, using reference values of commu-
nity size, such as, mean value of 8.4 (Huberman
and Adamic, 2004), Dunbar number of 150 (Dun-
bar, 1998), or maximum size of 100 (Leskovec et al.,
2009; Narasimhamurthy et al., 2010).
However, our hypothesis is that some of these
communities are big (≈ 30 − 100) enough to fur-
ther divide or “disintegrate” into smaller, but relevant,
communities by using information from the metadata.
Since the network data has been exhausted for gener-
ating two levels of the community hierarchy, we pro-
pose the use of metadata, specifically node and link
attributes, to discover knowledge about the network,
for finding leaf node communities. One such knowl-
edge discovery method is the use of a similarity ma-
trix, which has been in effective in visualization of a
SWN (Parveen and Sreevalsan-Nair, 2013).
Similarity Graph: We transform the metadata of the
network to a similarity matrix, thus effectively per-
forming dimensionality reduction (Strehl and Ghosh,
2003). Similarity matrix is a square matrix of size
n, computed using pairwise similarity scores between
nodes, and it is the weighted adjacency matrix for the
similarity graph. There are several algorithms in lit-
erature which use a combination of attributes from
the links as well as the nodes for similarity compu-
tation (e.g., author-topic similarity graph (Rosen-Zvi
et al., 2010) for co-authorship networks). A simi-
larity graph with ε-neighborhood retains only those
edges with weight (i.e., distance between the nodes
connected by the edge) less than ε (Von Luxburg,
2007), for which we use a user-defined parameter.
This makes the graph sparser than a fully connected
graph, thus reduces the clutter in its matrix visualiza-
tion. The generation of the similarity graph makes the
SWN, a multi-relational or multiplex network. We
use the network layer as structural layer and similar-
ity graph/network layer as functional layer in NTM,
as has been used in (Agarwal et al., 2017).
We use the similarity layer for finding the leaf
node communities in the SWN. However, modularity-
based methods, such as Louvain, will not work for
mostly complete graph, such as the similarity graph.
Hence, we propose spectral clustering for community
detection in the similarity layer. In spectral clustering
in networks, a network embedding in spectral space
is determined, and the nodes are clustered using com-
monly used partitioning algorithms, such as k-means
and fuzzy c-means (FCM). Spectral clustering gives
us the flexibility to extract both overlapping and non-
overlapping communities.
Matrix Seriation: Seriation is a process of sort-
ing objects along rows and columns in a two-way
one-mode matrix (e.g. adjacency, similarity, dis-
tance matrices) to identify pertinent patterns of clus-
tering (Liiv, 2010). We visualize matrices automat-
ically seriated using selected algorithms, namely vi-
sual assessment of clustering tendency (VAT) algo-
rithm (Bezdek et al., 2007) and coarse seriation in
CLUSION (Strehl and Ghosh, 2003). VAT uses the
minimum spanning tree of the dissimilarity graph to
give a sorted order of nodes, and upon reordering,
the clusters appear as square blocks along the diag-
onal of the matrix. CLUSION uses a permutation
matrix computed using the cluster membership ma-
trix (Strehl and Ghosh, 2003), to group nodes in a
cluster together. We use VAT to estimate number
of clusters and CLUSION to display constituency of
non-overlapping communities in the matrix. Auto-
seriated similarity matrices gives effective visualiza-
tion of the SWNs as well as its hierarchical clustering
tendency (Parveen and Sreevalsan-Nair, 2013).
Spectral Clustering: Spectral clustering is done by
applying partitioning algorithm (k-means, FCM, etc.)
on the embedding of the network in spectral space.
Spectral decomposition of the Laplacian of the weight
(i.e. adjacency) matrix gives the embedding. We
then perform normalized spectral clustering (Ng et al.,
2002), where eigenvectors of the normalized Lapla-
cian matrix form columns in the embedding matrix.
NodeTrix-CommunityHierarchy: Techniques for Finding Hierarchical Communities for Visual Analytics of Small-world Networks
143

The normalized rows of the embedding matrix give
the position coordinates of the nodes in the spec-
tral space.The symmetric normalized Laplacian ma-
trix, for a graph G(V,E), of n vertices, degree ma-
trix, D, and weight matrix, W , is given by: L
sym
=
I
n
− D
−0.5
W D
−0.5
.
Spectral clustering can be done using either
the normalized or the unnormalized Laplacian ma-
trix. We choose to use the normalized Lapla-
cian matrix L
sym
because L
sym
shows stronger and
consistent convergence of spectral clustering algo-
rithm (Von Luxburg, 2007). Hence, we propose
to use the MULTICUT algorithm (Ng et al., 2002),
which is a normalized spectral clustering algorithm
that uses a normalized graph Laplacian. Zhang et
al. (Zhang et al., 2007) have used spectral cluster-
ing using normalized graph Laplacian (random walk)
L
rw
= D
−1
W , and FCM algorithm (Dunn, 1973)
for finding overlapping communities in complex net-
works. Since we want to have a common spectral
mapping leading to either partitioning algorithms (k-
means or FCM), we use L
sym
for the spectral map-
ping. Nonetheless, the eigenvalues and eigenvec-
tors of both normalized graph Laplacians are re-
lated (Von Luxburg, 2007), and since the similarity
graph without ε-neighborhood does not contain nodes
with low degrees, both normalized graph Laplacians
will give similar outcomes. At the same time, White
et al. (White and Smyth, 2005) have used L
rw
in or-
der to maximize the modularity function Q
h
(New-
man and Girvan, 2004), which measures the quality
of node clusters in a graph. Hence, we can explore the
use of spectral mapping using L
rw
in SWNs in NTCH,
in future.
Hierarchical Approach: We propose a four-level
community hierarchy for SWN analysis (Figure 1).
We perform Louvain community detection twice on
the SWN layer to obtain communities in L
1
and L
2
.
Popular methods based on modularity optimization,
such as Louvain algorithm (Blondel et al., 2008), suf-
fer from resolution limit (Fortunato and Barthelemy,
2007), which fails to identify communities in smaller
networks, like the L
2
communities. Hence, we use
the similarity graph for each community and spec-
tral clustering on it to get the leaf node communi-
ties. We choose spectral clustering using partition-
ing algorithms, so that, our approach has the flexi-
bility of re-using the spectral embedding of the com-
munity for either k-means or FCM algorithms. This
re-use makes the clustering computationally effective
as spectral mapping is O(n
3
) for n nodes in the sub-
network. A point to note here is that, the use of FCM
gives relative membership of a node across commu-
nities, but not a measure of overlap. Hence, the mem-
bership values of two nodes within a community can-
not be compared.
We use a divisive hierarchical clustering method
as opposed to agglomerative methods (Coscia et al.,
2014), as we are interested in visually exploring
the network and probing further into communities.
Agglomerative methods are well-suited for finding
which communities a specific node belongs to. How-
ever, even though neat layouts of the network, as in
NT (Henry et al., 2007), can be achieved with either
divisive or agglomerative methods, the former more
efficient as the termination condition for building the
network has more control. For the latter, the logical
termination is when all nodes belong to a single clus-
ter and few levels of hierarchy may still show more
fragmented structure in comparison to the same num-
ber of levels of divisive hierarchy. Hence, we use a
divisive method for performing visual analytics on a
four- level community hierarchy. The entire network
is at L
0
. Louvain community detection is applied L
0
and L
1
communities to get L
1
and L
2
ones, respec-
tively. Spectral clustering, with user’s choice of par-
titioning algorithm, on L
2
communities gives the leaf
node (L
3
) communities.
Adaptive Community Hierarchy: The objective of
our work is to explore hierarchical communities in a
SWN using visual analytics. Such an objective directs
our proposed workflow towards allowing the user to
make decisions on which communities to propagate
the hierarchy further and which partition algorithms
to use for leaf node communities. We provide users
with sufficient information about the tendency of a
community to form communities within itself. This
information helps the user to “confirm” or “approve”
further divisive clustering or community formation
within a community, thus giving an adaptive commu-
nity hierarchy.
We perform community detection in L
1
and L
2
communities, selectively. The rationale is if we
blindly perform community detection in all commu-
nities, it leads to excessive fragmentation. Fragmenta-
tion causes a spike in the number of inter-community
links, which causes clutter in the NodeTrix layout.
The increase in clutter due to the excessive fragmen-
tation causes the network to lose its “globally sparse”
property. Thus, in order to avoid fragmentation, we
“confirm” a L
1
or L
2
community C, for further divi-
sion, based on its analytics. For L
1
, only if modular-
ity Q
h
of C is above a specific threshold, Q
T
h
, and if
R
e
of C is as low as possible, Louvain algorithm can
be applied on C. We can confirm only after perform-
ing the community detection and not a priori, because
computing metrics of its community formation, such
as Q
h
and R
e
. These metrics are needed to determine
IVAPP 2017 - International Conference on Information Visualization Theory and Applications
144
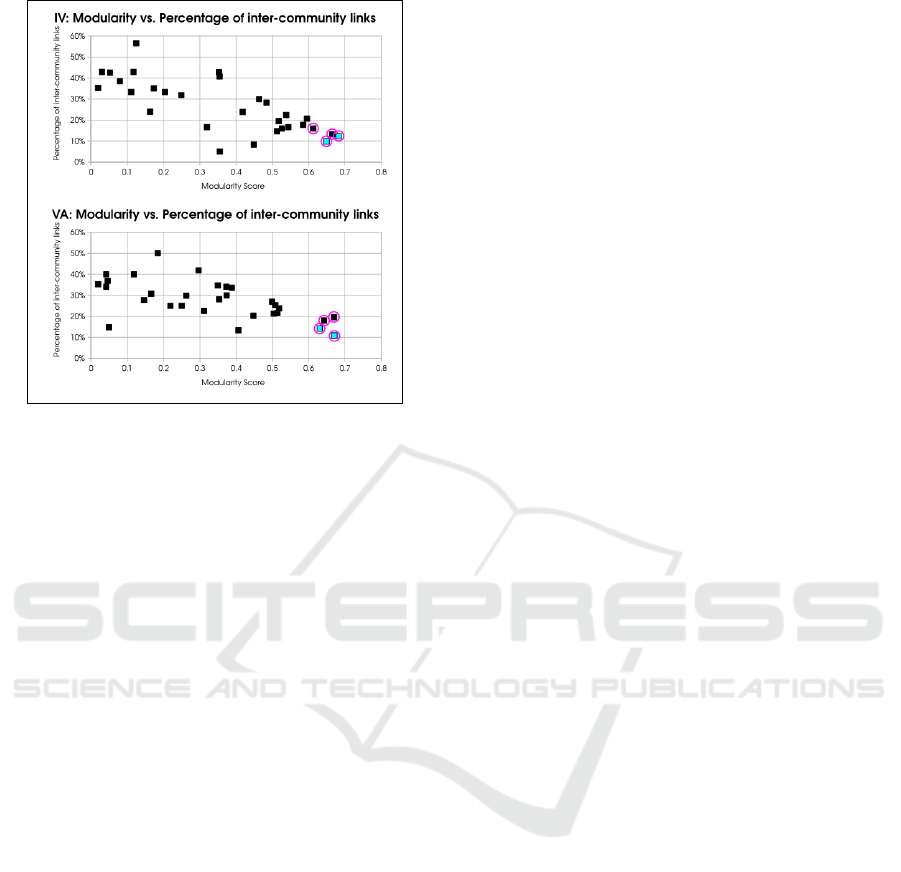
Figure 2: Q
h
vs. R
e
plots for selecting communities in L
1
for further division using Louvain algorithm, in our case-
study. Magenta highlights are communities with Q
h
> Q
T
h
for a threshold Q
T
h
= 0.6, amongst which cyan points are
the ones with as low R
e
as possible. Hence, the latter are
selected.
the goodness of the community detection. Thus, anal-
ysis of the Q
h
− R
e
relationship of L
1
communities
is used to select those for Louvain algorithm to find
communities within themselves (Figure 2). Similarly,
we selectively perform community detection within
L
2
communities of interest, which we determine by
visualizing their VAT-seriated adjacency and similar-
ity matrices to find interesting patterns. We allow the
user to select the community detection method (spec-
tral clustering with k-means or FCM) and confirm L
3
communities, after considering the quantitative anal-
ysis and visualizations of the outcomes of the the cho-
sen methods.
Semantics of Community Hierarchy: The seman-
tics of the L
1
and L
2
communities are different from
the L
3
ones. The former are purely based on con-
nected components or near cliques which are uncov-
ered purely based on the relationship captured by the
edges in the SWN, e.g. co-authorship relationship.
The latter, on the other hand, captures the semantics
of similarity within a community. A point to note
here is that the similarity is computed from the infor-
mation in the metadata, which is different from ex-
plicit information from the relationship captured by
the edges. Hence, the semantics of the community
hierarchy changes depending on the metadata analyt-
ics we perform. For instance, when using author-
topic similarity to find the L
3
communities in a co-
authorship network, the L
3
communities are formed
by researchers who publish in similar topics. Even
though it may seem trivially intuitive that co-authors
in a L
2
community would definitely work on topics
of similar interests, it is not always true. When L
3
communities are computed in the similarity space us-
ing author-topic similarity, the information encoded
in the similarity graph is derived across all publica-
tions of such authors, including the ones they did not
co-author. Hence, the authors in a L
2
community may
be connected in a near-clique, but could be working in
diverse topics. One of the uses of such L
3
communi-
ties is link prediction, i.e. find authors who have not
co-authored, as per the data of the given network, but
are similar. In the example, such authors are in the
same community by virtue of their “connections” in
the SWN and they have the potential of co-authoring
papers, which may not be captured in the specific net-
work, which may not be inclusive.
4 NodeTrix-CommunityHierarchy
We propose NodeTrix-CommunityHierarchy
(NTCH), which is a set of techniques for visual
analytics for SWNs, using hierarchical communities.
NTCH enables users, such as network analysts, to
make decisions on probing such communities, which
are determined from the data as well as metadata
of the SWN. NTCH uses specific user interactions
(UIs) with communities; and community (or cluster)
visualization techniques. For the former, the UIs are
available in our previous visual analytic tool, NTM,
and for the latter, we extend capabilities of NTM.
Communities are represented using their adjacency
matrices, which are visualized as aggregated nodes,
as provided in the NodeTrix layout. We propose UIs
for spectral clustering as well as cluster visualization
techniques as an extension to NTM. Our proposed
techniques are two different visualizations of the
cluster membership matrix, U, using node-link as
well as matrix representations. U is a rectangular
matrix, which is an outcome of the partitioning algo-
rithms, k-means or FCM. The rows and columns of
U are clusters and nodes, respectively, and the matrix
element is the normalized extent of membership of
the node in a cluster. Cluster analytics in NTCH
includes quantitative analysis of the communities in
L
3
. The choice of using NodeTrix over node-link
diagrams, e.g. as in Gephi (Bastian et al., 2009),
is due to clear separability of the visualization of
the community of interest, as a matrix, from the
rest of the subnetwork in NodeTrix (Figure 3).
This separability enables us to visually analyze any
community represented as an aggregated node, and
treated as a focus (Agarwal et al., 2017).
NodeTrix-CommunityHierarchy: Techniques for Finding Hierarchical Communities for Visual Analytics of Small-world Networks
145
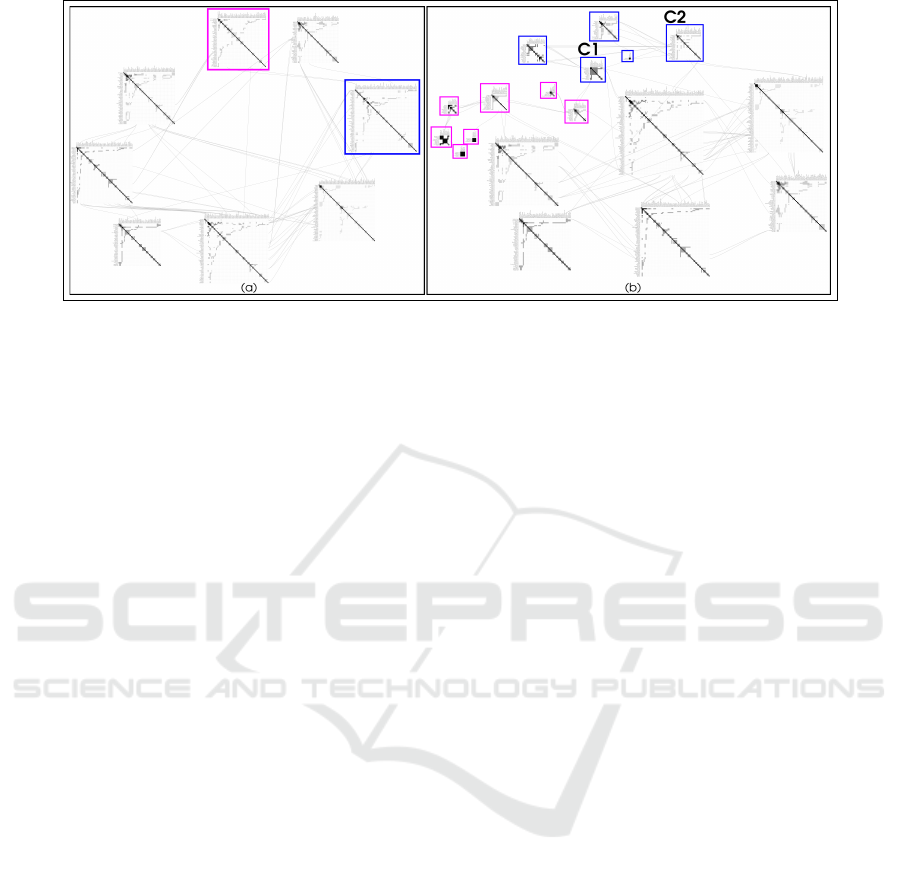
Figure 3: Visualizations of the IV network displaying communities in (a) L
1
, and (b) L
2
. The color coding shows the parent
L
1
communities of the corresponding L
2
communities, obtained using Louvain algorithm. C1 (13 nodes, 37 intra-community
edges), and C2 (26 nodes, 44 intra-community edges) show aggregated nodes, where Shneiderman and Heer are the central
actors, respectively.
Aggregated Nodes: The aggregated nodes in NTCH
are matrix representations of L
2
communities, which
are generated automatically based on constraints ap-
plied on L
1
communities (Figure 2). The user can
select one of the aggregated nodes as focus, using the
focus+context approach in NTM; and perform spec-
tral clustering on it. The choice of the partitioning al-
gorithm (k-means or FCM) and parameters (e.g. num-
ber of clusters) are user inputs introduced in NTCH,
for which the multi-layer visualization from NTM and
VAT seriation are used. One of the noticeable differ-
ences between NodeTrix and NTM visualizations is
that the diagonal of the unweighted adjacency matri-
ces would have value 1 in the former, as opposed in 0
in the latter (colored as white and black, respectively,
in grayscale colormap). This is because in NodeTrix,
unweighted adjacency matrices are used, whereas we
use weighted adjacency (or similarity) matrices and
distance matrices for matrix visualization and spectral
clustering, respectively. We compute distance matri-
ces as difference of all-ones matrix and corresponding
normalized weight matrix. Our visualization in NTM
matches with that proposed in VAT and CLUSION.
Proposed Cluster Visualizations: In cluster mem-
bership matrix representation, U is rendered as a
rectangular matrix using colormapping just like the
square matrix of the aggregated nodes. Our proposed
cluster graph representation is a node-link diagram,
where both clusters and vertices are nodes of the di-
agram, which uses edge thickness to represent the
membership value, u
i j
. The cluster visualizations are
currently included as an additional panel in the NTM
tool.
Quantitative Analysis of Community Detection:
We use metrics such as modularity, Q
g
and clus-
ter validity measures (silhouette coefficient and fuzzy
partition coefficient), for quantifying the quality of
community formation or clustering within a chosen
community. We use Q
h
for measurement of perfor-
mance of Louvain community detection (on L
0
and
L
1
communities). We use appropriate cluster va-
lidity measures for L
2
communities for evaluating
spectral clustering. For accommodating both non-
overlapping as well as overlapping communities, we
use a generalized modularity function (Havens et al.,
2013), given by Q
g
= tr(UBU
T
)/kW k, where U is the
n × N
c
membership matrix for n nodes and N
c
clus-
ters/communities (overlapping or non-overlapping);
modularity matrix B = [W − m
T
m/kW k]; m =
{m
1
,. .., m
n
}, where m
i
=
∑
n
j=1
w
i j
and kW k =
∑
n
i, j=1
w
i j
. For non-overlapping communities, Q
g
is
equivalent to Q
h
. Additionally, we compute qual-
ity metrics for partitions using cluster validity mea-
sures, such as, mean of silhouette coefficients of
all nodes (Rousseeuw, 1987) for crisp partitions in
k-means, and fuzzy partition coefficient (Pal and
Bezdek, 1995) for fuzzy partitions in FCM.
Proposed Workflow: Here, we stitch together the de-
sign decisions discussed so far, i.e. the use of meta-
data, adaptive hierarchical community detection al-
gorithm, and finding overlapping communities. Our
workflow spans across the analysis and reflection
phases in the research programming workflow (Guo,
2012). Guo describes these phases using action-level
granularity; whereas we use process-level granularity.
Our workflow consists of 4 stages (Figure 1): data
modeling for analysis, hierarchy construction, com-
munity analysis, community extraction. In data mod-
eling, we use a similarity function, appropriate for
the application data, to generate a similarity matrix,
i.e. E
S
for the SWN. Between hierarchy construc-
tion and community analysis, we perform a commu-
IVAPP 2017 - International Conference on Information Visualization Theory and Applications
146
nity detection algorithm only on selected communi-
ties, based on qualitative as well as quantitative anal-
yses of these communities. Upon “confirmation” of
finding communities within communities, we perform
community extraction, thus feeding back into hier-
archy construction,
We introduce new UIs for implementing NTCH,
for cluster analytics. Operations on aggregated nodes
or foci include parameter selection for clustering, and
cluster visualizations. In NTCH, the user can in-
teractively choose parameters, such as, threshold for
ε-neighborhood for similarity graph, seriation algo-
rithm, clustering algorithm, and number of clusters.
These additional UIs are supported in our Graphical
User Interface (GUI) for NTM (Agarwal et al., 2017).
Subnetwork of Interest: We have implemented our
visual analytic tool for NTCH using D3.js library. Our
tool is inclusive of all the UIs in NTM as well as new
ones proposed here. We can load the entire network
for the graph layout using NT, and use zoom capa-
bilities in D3.js for visualizations. However, load-
ing the entire network makes the UIs much slower.
Hence, we load as many L
1
communities as possible,
as the application can accommodate for interactive
speeds for loading and visualizing subnetwork con-
taining ∼ 500 nodes. We choose to load the L
1
com-
munities so that there is a logical grouping of nodes
which are loaded together and analyzed further. The
criteria for selecting L
1
communities, we use here are
based on its properties such as Q
h
and N
c
. The criteria
we use are Q
h
> Q
T
h
and N
c
, where Q
T
h
and N
T
c
are
user-defined thresholds, albeit are data-driven (Fig-
ure 4).
5 CASE-STUDY ON
CO-AUTHORSHIP NETWORKS
Our case-study on co-authorship networks, uses the
following datasets: Infovis (IV), and VAST (VA) co-
authorship networks (Isenberg et al., 2015) during
(1995-2015), and (2005-2015), respectively.
For data modeling in NTCH, we use the meta-
data, i.e. abstracts of papers used in the network data,
to compute author-topic similarity (Rosen-Zvi et al.,
2010). For hierarchy construction, we perform Lou-
vain algorithm on the networks to obtain L
1
, and we
get the results as shown in Table 1. We get N
1
commu-
nities in L
1
, however we select only N
∗
1
communities,
which corresponds to subnetwork S
1
, to be loaded on
NTCH. Community analysis enables selecting N
∗
1
communities (Figure 4), and two communities each in
IV and VA networks for finding L
2
communities (Fig-
ure 2). We further perform community extraction
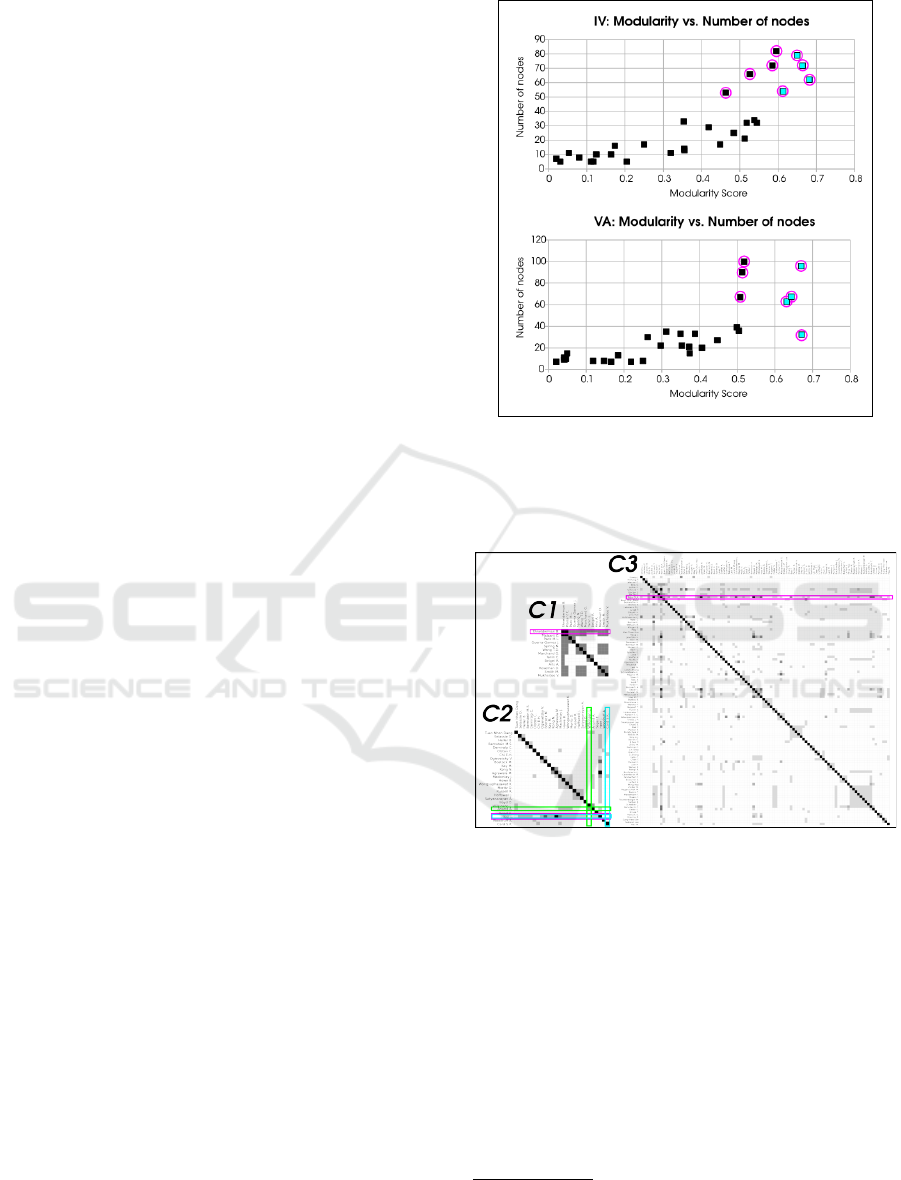
Figure 4: Q
h
vs. N
c
plots for selecting L
1
communities in
NTCH, in our case-study. Magenta highlights show com-
munities which have Q
h
> Q
T
h
and N
c
> N
T
c
, amongst which
cyan points are those which satisfy the former exclusively.
We use N
T
c
= 50 and Q
T
h
= 0.6.
Figure 5: Aggregated nodes of C1, C2, C3 in the SWN,
showing Shneiderman, Heer, and Keim, as central actors
(magenta highlights), respectively. (Heer, Card) highlighted
in cyan; (Anand, Wilkinson) in green.
until L
2
communities. On visual inspection, we select
L
2
communities whose central actors are: Shneider-
man and Heer in IV, and Keim in VA, referred to as
C1, C2, and C3, respectively (Figure 5)
3
. C1 has 13
nodes and 37 intra-community links; C2 has 26 and
4; and C3 has 100 and 475, respectively.
We perform in-depth community analysis, which
is specifically cluster analytics, on C1, C2, and C3,
for finding L
3
communities using the similarity graph.
Louvain algorithm automatically gives 10, 7, and 8
3
The images are better readable at high zoom levels (e.g.
400%), and higher resolution versions of the images are
available at http://ntch.au-syd.mybluemix.net/
NodeTrix-CommunityHierarchy: Techniques for Finding Hierarchical Communities for Visual Analytics of Small-world Networks
147
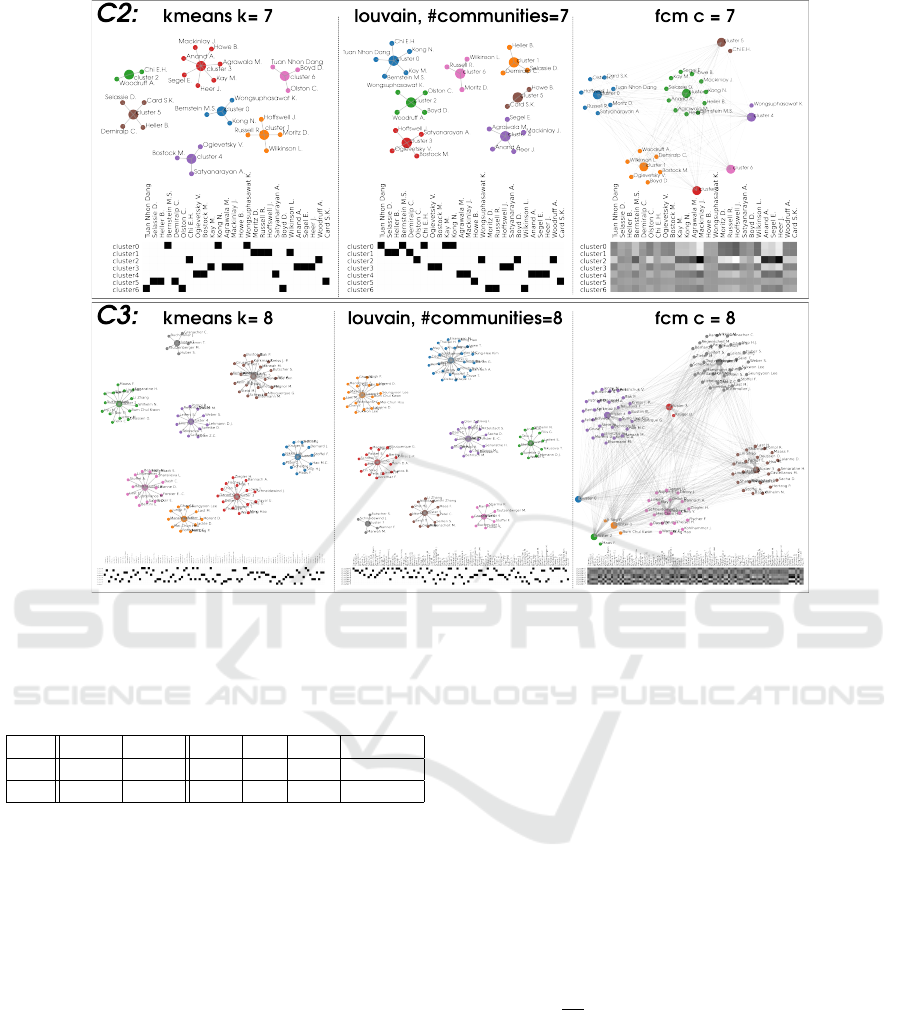
Figure 6: Cluster visualization for k=7 and k=8 clusters (or communities) for C2 and C3, respectively.
Table 1: Outcomes of number of communities in our case-
study in L
0
,L
1
,L
2
. We perform Louvain algorithm on 2
communities each in L
1
to get N
2
= 18 and 16 communities
for IV and VA networks, respectively.
DS |V | |E| N
1
N
∗
1
S
1
|E(S
1
)|
IV 1235 2705 150 8 540 1318
VA 1266 3911 123 7 515 1862
communities in C1, C2, C3, respectively. We show
both VAT and CLUSION seriations in C1-C3. Lou-
vain algorithm gives 10 communities in C1, which
has only 13 nodes, is excessive, which indicates that
C1 inherently has poor edge density, which limits the
performance of Louvain algorithm. The similarity
matrix is mostly “homogeneous” (Figure 7), indicat-
ing weak community formation within C1, based on
author-topic similarity.
Estimating Number of Clusters: Cluster analytics
(Figure 6) gives 7 communities in C2, formed using
k-means as well as Louvain, and overlapping com-
munities using FCM for c=7. perform a similar anal-
ysis for 8 communities in C3. We make two observa-
tions – firstly, the results from Louvain and k-means
partitions are not the same, owing to the difference
in their optimization function; secondly, the FCM re-
sults show multiple empty clusters for C2 and fuzzy
communities in C3, owing to dense inter-cluster links
in the cluster membership graph visualization. Thus,
this validates choices of user-defined parameters that
when finding overlapping communities, analysis must
be made on a lower number of clusters, in comparison
to that of the non-overlapping communities.
We observe that FCM at lower number of clusters
gives overlapping communities with a good balance
of separability as well as overlap (Figure 8). The plots
show variations in community detection outcomes us-
ing Louvain algorithm and spectral clustering (using
both k-means and FCM). We see that Q
g
is overall
low for these communities, indicating that Q
g
which
is a metric based on edge density of the adjacency ma-
trix, is not appropriate for distance-based measures of
the similarity matrix. We have analyzed for a max-
imum of d
|V |
3
e for V nodes in the community. Q
g
and SC values of Louvain algorithm are similar to the
Q
g
value of the corresponding k-means partitioning,
at k=7 and k=8 in C2 and C3, respectively (Figure 8).
This observation with respect to k-means and FCM
partitioning confirms with the number of communi-
ties, which are detected by the Louvain algorithm. At
these values of k, we also observe that the FPC due to
FCM and Q
g
due to k-means are co-incident with the
values of Q
g
and SC of the Louvain algorithm.
Improving FCM Results: We improve the FCM re-
IVAPP 2017 - International Conference on Information Visualization Theory and Applications
148
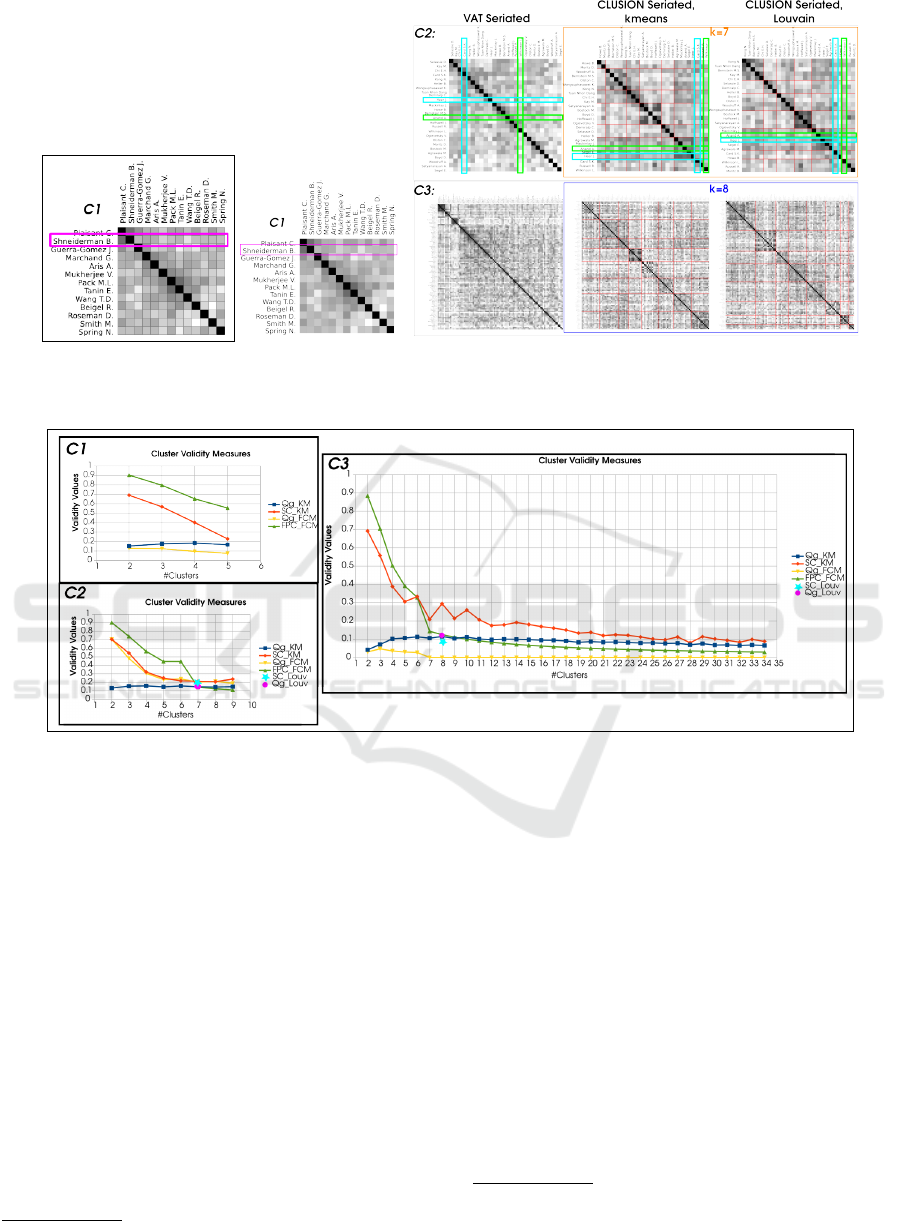
Figure 7: (left) VAT-seriated similarity matrix visualization of C1, (right) VAT- and CLUSION-seriated similarity matrix
visualization C2 and C3. The latter shows Louvain and k-means clustering results for k=7 and k=8 clusters (or communities)
for C2 and C3, respectively.
Figure 8: Quantitative analytics of modularity and cluster validity metrics for different number of communities/clusters,
which are L
3
communities.
sults by visualizing clusters for c=2 and c=3 for C2,
and c=2 for C3. We find that C2 has more defined
communities with good overlap, as opposed to C3.
The difference in sizes of the 2 clusters in C3 indi-
cates that the tendency to form communities based on
author-topic similarity is comparatively low, as larger
subset of the community belong to one cluster pre-
dominantly.
Insights About the Community and Network: We
can gain insights such as link prediction and relevant
overlap in communities, in a selected community us-
ing our proposed workflow. An example of link pre-
diction is that in C2, Heer and Card do not have any
IV papers, hence they do not have a link (Figure 5);
but they are highly similar (Figure 7). Upon external
investigation, we have found that {Heer, Card} have
published in CHI and on other articles
4
. An example
of a relevant overlap in communities, {Anand, Wikin-
4
Heer, Jeffrey, Stuart K. Card, and James A. Landay.
son} fall in different communities (Figures 6 and 7),
but have a strong inter-community link by virtue of
having common papers (Figure 5). The strong inter-
community link shows overlap between two commu-
nities. In NTCH, we visualize these communities in
the context of a relevant larger subnetwork or the en-
tire network, which enables on relationship of the au-
thors outside their communities.
Expert User Evaluation: The data science workflow
created using NTCH has been evaluated by a network
science researcher. The expert has commented on
the usefulness of such a workflow for a mesoscopic
(community-based) analysis of a social network, by
drilling down specific communities to enable further
knowledge discovery. The expert has mentioned that
the data model and the choice of processes includ-
“Prefuse: a toolkit for interactive information visualiza-
tion.” In Proceedings of the SIGCHI conference on Human
factors in computing systems, pp. 421-430. ACM, 2005.
NodeTrix-CommunityHierarchy: Techniques for Finding Hierarchical Communities for Visual Analytics of Small-world Networks
149
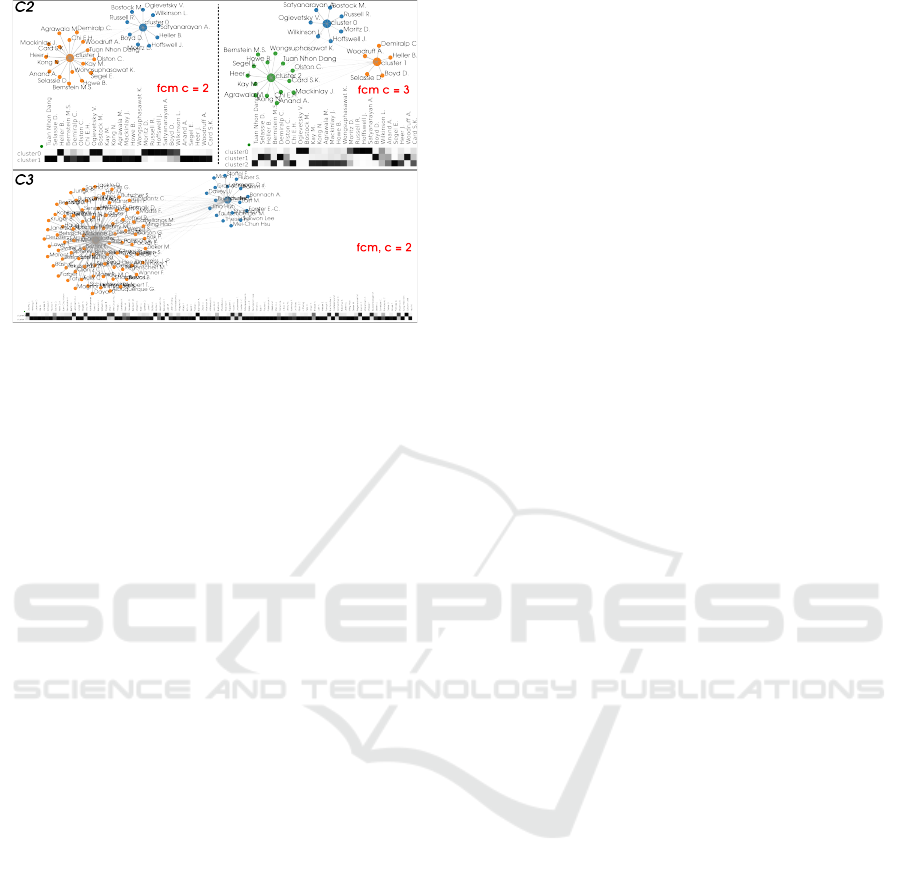
Figure 9: FCM visualization for lower values of k for C2
and C3.
ing the visualization make a meaningful workflow.
The facility to perform cluster analytics on commu-
nities of size 100, such as C3, with supporting GUI,
was found to be helpful, as real communities of this
size are known to exist. However, the expert sug-
gested improving the scalability of such a “locality-
driven” workflow for studying “locally global” trends
in larger parent communities, say in L
1
communities
in the community hierarchy.
6 CONCLUSIONS
In this paper, we have proposed techniques for visual
analytics of a SWN, in a data science workflow, us-
ing hierarchical communities. Our proposed set of
techniques is built on three core ideas, namely, us-
ing metadata in addition to network data for knowl-
edge discovery, adaptive community hierarchy con-
struction, and finding overlapping communities using
visual analytics. While our workflow enables meso-
scopic analysis of network in local scales, the de-
sign of the workflow has to be improved for analyz-
ing larger parent communities. Our future work also
includes analyzing other community detection algo-
rithms for exploring overlapping communities. Cur-
rently, we focus on finding overlapping communities
only in leaf nodes; however our workflow needs to
be revised to finding overlapping communities across
different levels in the community hierarchy.
ACKNOWLEDGEMENTS
The authors are grateful to Amit Tomar for initial im-
plementations of the tool, and to the anonymous re-
viewers for comments in improving the paper. This
work has been partially supported by funding from
NRDMS, Department of Science & Technology, Gov-
ernment of India; RSA division of EMC
2
India; and
INCOIS, Ministry of Earth Sciences, Government of
India.
REFERENCES
Agarwal, S., Tomar, A., and Sreevalsan-Nair, J. (2017).
NodeTrix-Multiplex: Visual Analytics of Multiplex
Small World Networks, pages 579–591. Springer In-
ternational Publishing, Cham.
Bastian, M., Heymann, S., Jacomy, M., et al. (2009). Gephi:
an open source software for exploring and manipulat-
ing networks. ICWSM, 8:361–362.
Bennett, L., Kittas, A., Muirhead, G., Papageorgiou, L. G.,
and Tsoka, S. (2015). Detection of composite com-
munities in multiplex biological networks. Scientific
reports, 5.
Bezdek, J. C., Hathaway, R. J., and Huband, J. M. (2007).
Visual assessment of clustering tendency for rectangu-
lar dissimilarity matrices. Fuzzy Systems, IEEE Trans-
actions on, 15(5):890–903.
Blondel, V. D., Guillaume, J.-L., Lambiotte, R., and Lefeb-
vre, E. (2008). Fast unfolding of communities in large
networks. Journal of statistical mechanics: theory
and experiment, 2008(10):P10008.
Coscia, M., Rossetti, G., Giannotti, F., and Pedreschi,
D. (2014). Uncovering hierarchical and overlapping
communities with a local-first approach. ACM Trans-
actions on Knowledge Discovery from Data (TKDD),
9(1):6.
Davidson, S. B. and Freire, J. (2008). Provenance and
scientific workflows: challenges and opportunities.
In Proceedings of the 2008 ACM SIGMOD inter-
national conference on Management of data, pages
1345–1350. ACM.
De Domenico, M., Lancichinetti, A., Arenas, A., and Ros-
vall, M. (2015). Identifying modular flows on mul-
tilayer networks reveals highly overlapping organiza-
tion in interconnected systems. Physical Review X,
5(1):011027.
Dunbar, R. (1998). Grooming, gossip, and the evolution of
language. Harvard University Press.
Dunn, J. C. (1973). A fuzzy relative of the isodata process
and its use in detecting compact well-separated clus-
ters.
Fortunato, S. (2010). Community detection in graphs.
Physics reports, 486(3):75–174.
Fortunato, S. and Barthelemy, M. (2007). Resolution limit
in community detection. Proceedings of the National
Academy of Sciences, 104(1):36–41.
Ghoniem, M., Fekete, J.-D., and Castagliola, P. (2004). A
comparison of the readability of graphs using node-
link and matrix-based representations. In Information
Visualization, 2004. INFOVIS 2004. IEEE Symposium
on, pages 17–24. Ieee.
Guo, P. (2013). Data science workflow: Overview and chal-
lenges. Communications of the ACM.
IVAPP 2017 - International Conference on Information Visualization Theory and Applications
150

Guo, P. J. (2012). Software tools to facilitate research pro-
gramming. PhD thesis, Stanford University.
Havens, T. C., Bezdek, J. C., Leckie, C., Ramamohanarao,
K., and Palaniswami, M. (2013). A soft modular-
ity function for detecting fuzzy communities in so-
cial networks. Fuzzy Systems, IEEE Transactions on,
21(6):1170–1175.
Henry, N., Bezerianos, A., and Fekete, J.-D. (2008). Im-
proving the readability of clustered social networks
using node duplication. Visualization and Computer
Graphics, IEEE Transactions on, 14(6):1317–1324.
Henry, N., Fekete, J.-D., and McGuffin, M. J. (2007). Node-
trix: a hybrid visualization of social networks. Visu-
alization and Computer Graphics, IEEE Transactions
on, 13(6):1302–1309.
Huang, J., Sun, H., Han, J., Deng, H., Sun, Y., and Liu,
Y. (2010). Shrink: a structural clustering algorithm
for detecting hierarchical communities in networks.
In Proceedings of the 19th ACM international con-
ference on Information and knowledge management,
pages 219–228. ACM.
Huberman, B. A. and Adamic, L. A. (2004). Information
dynamics in the networked world. In Complex net-
works, pages 371–398. Springer.
Isenberg, P., Heimerl, F., Koch, S., Isenberg, T., Xu, P.,
Stolper, C., Sedlmair, M., Chen, J., M
¨
oller, T., and
Stasko, J. (2015). Visualization publication dataset.
Dataset: http://vispubdata.org/.
Javed, W. and Elmqvist, N. (2012). Exploring the design
space of composite visualization. In Visualization
Symposium (PacificVis), 2012 IEEE Pacific, pages 1–
8. IEEE.
Kivel
¨
a, M., Arenas, A., Barthelemy, M., Gleeson, J. P.,
Moreno, Y., and Porter, M. A. (2014). Multilayer net-
works. Journal of complex networks, 2(3):203–271.
Lancichinetti, A., Fortunato, S., and Kert
´
esz, J. (2009).
Detecting the overlapping and hierarchical commu-
nity structure in complex networks. New Journal of
Physics, 11(3):033015.
Leskovec, J., Lang, K. J., Dasgupta, A., and Mahoney,
M. W. (2009). Community structure in large net-
works: Natural cluster sizes and the absence of large
well-defined clusters. Internet Mathematics, 6(1):29–
123.
Liiv, I. (2010). Seriation and matrix reordering methods:
An historical overview. Statistical analysis and data
mining, 3(2):70–91.
Mucha, P. J., Richardson, T., Macon, K., Porter, M. A., and
Onnela, J.-P. (2010). Community structure in time-
dependent, multiscale, and multiplex networks. sci-
ence, 328(5980):876–878.
Narasimhamurthy, A., Greene, D., Hurley, N., and Cun-
ningham, P. (2010). Partitioning large networks with-
out breaking communities. Knowledge and informa-
tion systems, 25(2):345–369.
Newman, M. E. (2006). Finding community structure in
networks using the eigenvectors of matrices. Physical
review E, 74(3):036104.
Newman, M. E. and Girvan, M. (2004). Finding and eval-
uating community structure in networks. Physical re-
view E, 69(2):026113.
Ng, A. Y., Jordan, M. I., Weiss, Y., et al. (2002). On spectral
clustering: Analysis and an algorithm. Advances in
neural information processing systems, 2:849–856.
Pal, N. R. and Bezdek, J. C. (1995). On cluster validity
for the fuzzy c-means model. Fuzzy Systems, IEEE
Transactions on, 3(3):370–379.
Parveen, S. and Sreevalsan-Nair, J. (2013). Visualization
of small world networks using similarity matrices. In
Big Data Analytics, pages 151–170. Springer.
Perer, A. and Shneiderman, B. (2006). Balancing system-
atic and flexible exploration of social networks. IEEE
Transactions on Visualization and Computer Graph-
ics, 12(5):693–700.
Renoust, B., Melanc¸on, G., and Munzner, T. (2015). De-
tangler: Visual analytics for multiplex networks. In
Computer Graphics Forum, volume 34, pages 321–
330. Wiley Online Library.
Rosen-Zvi, M., Chemudugunta, C., Griffiths, T., Smyth, P.,
and Steyvers, M. (2010). Learning author-topic mod-
els from text corpora. ACM Transactions on Informa-
tion Systems (TOIS), 28(1):4.
Rousseeuw, P. J. (1987). Silhouettes: a graphical aid to
the interpretation and validation of cluster analysis.
Journal of computational and applied mathematics,
20:53–65.
Rufiange, S., McGuffin, M. J., and Fuhrman, C. P. (2012).
Treematrix: A hybrid visualization of compound
graphs. In Computer Graphics Forum, volume 31,
pages 89–101. Wiley Online Library.
Shi, L., Cao, N., Liu, S., Qian, W., Tan, L., Wang, G., Sun,
J., and Lin, C.-Y. (2009). Himap: Adaptive visual-
ization of large-scale online social networks. In Visu-
alization Symposium, 2009. PacificVis’ 09. IEEE Pa-
cific, pages 41–48. IEEE.
Strehl, A. and Ghosh, J. (2003). Relationship-based cluster-
ing and visualization for high-dimensional data min-
ing. INFORMS Journal on Computing, 15(2):208–
230.
van den Elzen, S. and van Wijk, J. J. (2014). Multivariate
network exploration and presentation: From detail to
overview via selections and aggregations. Visualiza-
tion and Computer Graphics, IEEE Transactions on,
20(12):2310–2319.
Vehlow, C., Beck, F., and Weiskopf, D. (2015). The state
of the art in visualizing group structures in graphs. In
Eurographics Conference on Visualization (EuroVis)-
STARs, pages 21–40.
Vehlow, C., Reinhardt, T., and Weiskopf, D. (2013). Visu-
alizing fuzzy overlapping communities in networks.
Visualization and Computer Graphics, IEEE Transac-
tions on, 19(12):2486–2495.
Von Luxburg, U. (2007). A tutorial on spectral clustering.
Statistics and computing, 17(4):395–416.
White, S. and Smyth, P. (2005). A spectral clustering ap-
proach to finding communities in graph. In SDM, vol-
ume 5, pages 76–84. SIAM.
Xie, J., Kelley, S., and Szymanski, B. K. (2013). Overlap-
ping community detection in networks: The state-of-
the-art and comparative study. Acm computing surveys
(csur), 45(4):43.
Zhang, S., Wang, R.-S., and Zhang, X.-S. (2007). Identi-
fication of overlapping community structure in com-
plex networks using fuzzy c-means clustering. Phys-
ica A: Statistical Mechanics and its Applications,
374(1):483–490.
NodeTrix-CommunityHierarchy: Techniques for Finding Hierarchical Communities for Visual Analytics of Small-world Networks
151
