
Consensus Clustering for Cancer Gene Expression Data
Large-Scale Analysis using Evidence Accumulation Approach
Isidora Šašić
1
, Sanja Brdar
2
, Tatjana Lončar-Turukalo
1
, Helena Aidos
3
and Ana Fred
3
1
Faculty of Technical Sciences,University of Novi Sad, Novi Sad, Serbia
2
BioSense Institute, Zorana Đinđića 1, Novi Sad, Serbia
3
Instituto de Telecomunicacoes, Instituto Superior Tecnico, Lisbon, Portugal
Keywords: Clustering, Consensus Clustering, Cancer Gene Expression.
Abstract: Clustering algorithms are extensively used on patient tissue samples in order to group and visualize the
microarray data. The high dimensionality and probe specific noise make the selection of the appropriate
clustering algorithm an uneasy task. This study presents a large-scale analysis of three clustering algorithms:
k-means, hierarchical clustering (HC) and evidence accumulation clustering (EAC) on thirty-five cancer gene
expression data sets selected to benchmark the performance of the clustering algorithms. Separated
performance analysis was done on data sets from Affymetrix and cDNA chip platforms to examine the
possible influence of the microarray technology. The study revealed no consistent algorithm ranking can be
inferred, though in general EAC presented the best compromise of adjusted rand index (ARI) and variance.
However, the results indicated that ARI variance under repeated k-means initializations offers useful
information on the need to implement more complex clustering techniques. If repeated K-means converges
to the same partition, also confirmed by the HC clustering, there is no need to run EAC. However, under
moderate or highly variable ARI in repeated K-means, EAC should be used to reduce the uncertainty of
clustering and unveil the data structure.
1 INTRODUCTION
Cancer genomics aims to uncover the molecular basis
of cancer. Different layers of genomic information
are used in cancer studies, with gene expression
profiles (transcriptome) being the most common.
Gene expression profiling provides an insight into
gene activity under different conditions. There is a
large amount of genome-wide gene expression data in
public archives (Rung et al, 2013) available to
identify the cancer signatures and more effective
diagnosis and treatment.
Clustering algorithms are extensively used on
patient tissue samples in order to group and visualize
the microarray data. Subgrouping of the similar
samples serves to reveal the new cancer subtypes and
to personalize the treatment approach. However, the
high dimensional and intrinsically noisy samples hide
the geometry of the clusters making the selection of
an appropriate clustering algorithm difficult. In the
clinical research, there is a prevalence of the simple
clustering methods, such as agglomerative clustering
and k-means (Alizadeh et al, 2000; Bredel et al, 2005;
D'haeseleer, 2005; Golub et al, 1999; Sorlie et al,
2003). The reason might be the ease of their use and
availability of implementations (de Souto et al.,
2008).
The data availability and modest variety of
implemented algorithms motivated a study by de
Souto et al. (2008) providing the first analysis of
several clustering algorithms combined with different
proximity measures and data normalization
techniques. The study uses 35 data sets from cDNA
or Affymetrix chip platforms (see Table 1), and
compares hierarchical clustering (HC), such as single,
complete and average linkage, mixture of
multivariate Gaussians (MMG), k-means, spectral
clustering and nearest neighbour methods (de Souto
et al, 2008). The overall performance of these
individual algorithms was the best in MMG, closely
followed by k-means, whereas HC proved as very
sensitive to noise.
The performance of the individual clusterings can
be significantly improved if they are combined,
similary to the ideas used in supervised learning
(classifier ensemble). In the unsupervised scenario,
176
Å
˘
aaÅ ˛aiÄ
˘
G I., Brdar S., LonÄ ar-Turukalo T., Aidos H. and Fred A.
Consensus Clustering for Cancer Gene Expression Data - Large-Scale Analysis using Evidence Accumulation Approach.
DOI: 10.5220/0006174501760183
In Proceedings of the 10th International Joint Conference on Biomedical Engineering Systems and Technologies (BIOSTEC 2017), pages 176-183
ISBN: 978-989-758-214-1
Copyright
c
2017 by SCITEPRESS – Science and Technology Publications, Lda. All rights reserved

the clustering ensemble comprises multiple partitions
obtained by the base clusterings. The evidence on
data structure may be accumulated introducing
diversity in several ways (Fred and Jain, 2005; Iam-
on 2010): (1) combining the results of different
clustering algorithms; (2) resampling the data, thus
producing different results, (3) running the same
algorithm many times with different parameters or
initializations, (4) using different feature subsets for
individual clusterings. The way of combining the
results of the individual clusterings as well differs,
with most of the methods resulting in a pairwise
similarity matrix used to obtain the final partition.
The comprehensive performance evaluation of
consensus clustering methods on the gene expression
data sets used to evaluate individual algorithms does
not exist. In Iam-on et al (2010), the novel link-based
cluster ensemble (LCE) method is introduced and
compared with several consensus methods over a
subset of 10 data sets of the available cancer gene
expression collection from Table 1. Mimaroglu et al.
(2012) as well report on their results obtained on just
one input ensemble per data set.
In this study we evaluate the performance of a
consensus clustering approach - evidence
accumulation (EAC) versus conventionally used
individual algorithms: k-means and average-link and
Ward’s linkage hierarchical clustering. The
accumulation of evidence is achieved by running the
k-means algorithm multiple times with different
initializations (Fred and Jain, 2005). All 35 data sets
selected to benchmark the performance of the
clustering algorithms in the recovery of cancer type
were the ones used (de Souto et al., 2008), specified
in Table 1. The adjusted rank index (ARI) was used
to evaluate the clusters obtained against the true
labels (Hubert et al, 1985). A separate performance
analysis was done on data sets from Affymetrix and
cDNA chip platforms, to additionally examine the
possible influence of the microarray technology. Kuo
et al (2002) suggested that probe-associated factors
influence in a different manner measurements from
the two technologies, resulting in their poor
correlation. Based on the performance on the
individual data sets, we explored the difference in
ARI scores between EAC methods and the individual
clustering approaches: k-means and hierarchical
clustering. Additionally, we strived at categorizing
results across used data sets and making
recommendations on using EAC.
2 METHODS
2.1 Data Sets
The study included thirty-five data sets used for the
evaluation of individual clustering algorithms in de
Souto et al. (2008). The data sets differ by the type of
the chip technology, tissue, the number of available
samples denoted by N, the class number, k, the sample
distribution per classes, the original dimensionality
denoted by m and the dimensionality after feature
reduction, denoted by d (Table 1). The full list of
references corresponding to the data sets is provided
in de Souto et al. (2008).
In cDNA microarray, the gene expression levels
are measured as the ratio of the signal from mRNA
target sample and the reference sample, making the
comparison to the other technologies difficult (Kuo et
al, 2002). Affymetrix data are estimates of the
number of mRNA copies in a sample. Following the
de Souto et al. (2008), in Affymetrix data a lower and
un upper limit on gene expression levels was set to 10
and 16.0000, respectively. Additionally, for the large
variations in Affymetrix gene expression levels, the
data sets from this chip technology were rank
normalized.
All data sets were available only with reduced
feature sets, thus the influence of different data
dimensionality reduction techniques were not
analysed.
2.2 Clustering Techniques
2.2.1 K-means
The simplicity and the linear computational
complexity of the k-means make it, even 50 years
(Steinhaus, 1956; Lloyd,1952) beyond its proposal,
the most widely used partitioning clustering
algorithm (Jain, 2010). K-means clusters are
represented by their centers, i.e. their prototypes
characterizing all objects in each cluster. To assign
objects to the clusters the Euclidean distance is
typically used as a similarity measure, and the final
assignment is done by minimizing within-cluster sum
of the squared error (SSE): initial centers of the
clusters are set by randomly selecting k samples from
the given data set, where k equals the actual number
of the classes in a data set. In an iterative procedure,
K-means updates centers to minimize objective
function until convergence. In this work, the K-means
was repeated for 50 times on each data set with
random initializations of the cluster centers and and k
was fixed to the true number of classes.
Consensus Clustering for Cancer Gene Expression Data - Large-Scale Analysis using Evidence Accumulation Approach
177
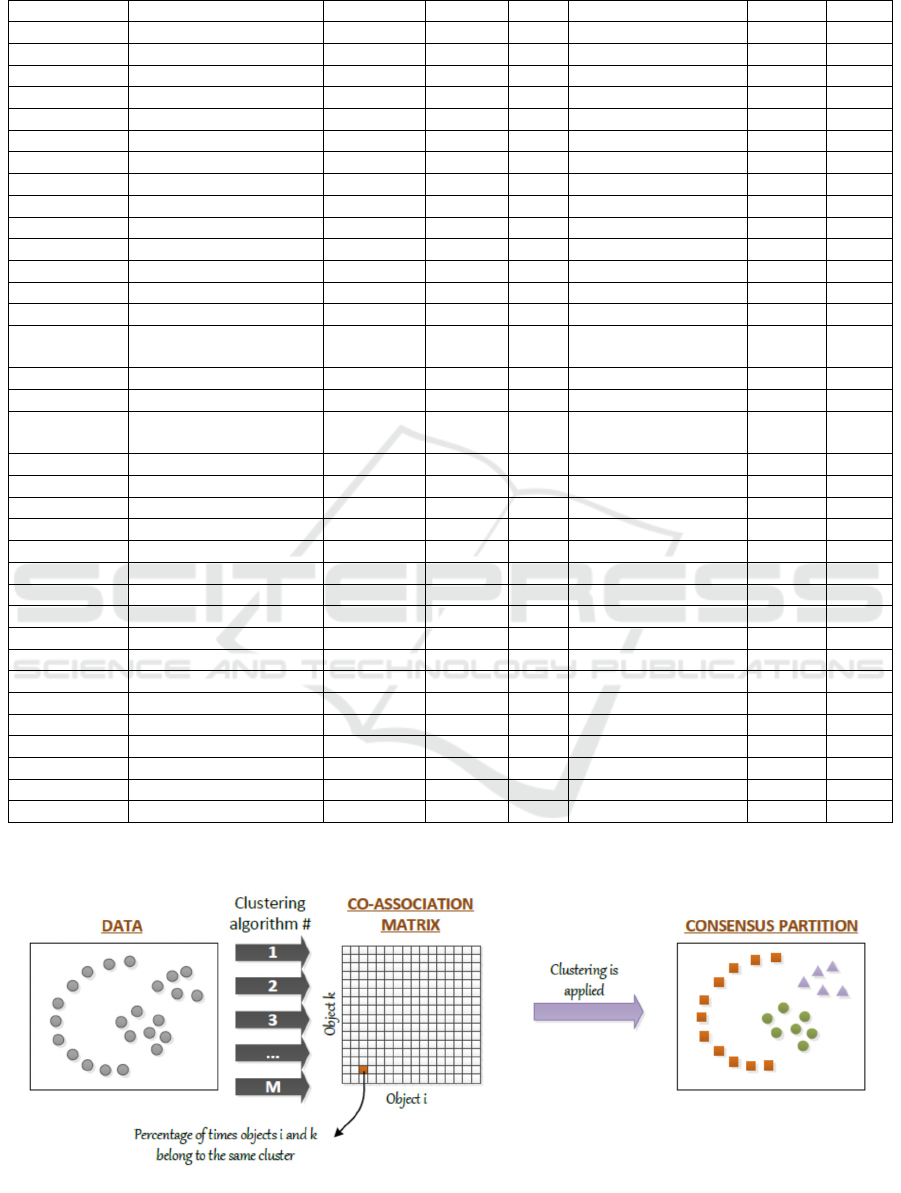
Table 1: Cancer gene expression data sets (full list of references in de Souto et al.(2008)).
Tissue Data set Chip N k Sample distribution m d
Blood Armstrong-V1 Affymetrix 72 2 24,48 12582 1081
Blood Armstrong-V2 Affymetrix 72 3 24,20,28 12582 1081
Lung / Bhattacharjee Affymetrix 203 5 139,17,6,21,20 12600 1543
Breast, Colon Chowdary Affymetrix 104 2 62,42 22283 182
Bladder Dyrskjot Affymetrix 40 3 9,20,11 7129 1203
Bone marrow Golub-V1 Affymetrix 72 2 47,25 7129 1877
Bone marrow Golub-V1 Affymetrix 72 3 38,9,25 7129 1877
Lung Gordon Affymetrix 181 2 31,150 12533 1626
Colon Laiho Affymetrix 37 2 8,29 22883 2202
Brain Nutt-V1 Affymetrix 50 4 14,7,14,15 12625 1377
Brain Nutt-V2 Affymetrix 28 2 14,14 12625 1070
Brain Nutt-V3 Affymetrix 22 2 7,15 1265 1152
Brain Pomeroy-V1 Affymetrix 34 2 25,9 7129 857
Brain Pomeroy-V2 Affymetrix 42 5 10,10,10,4,8 7129 1379
Multi-tissue Ramaswamy Affymetrix 190 14 11,10,11,11,22,10,11,
10,30,11,11,11,11,20
16063 1363
Blood Shipp Affymetrix 77 2 58,19 7129 798
Prostate Singh Affymetrix 102 2 58,19 12600 339
Multi-tissue Su Affymetrix 174 10 26,8,26,23,12,
11,7,27,6,28
12533 1571
Breast West Affymetrix 49 2 25,24 7129 1198
Bone marrow Yeoh-V1 Affymetrix 248 2 43,205 12625 2526
Bone marrow Yeoh-V2 Affymetrix 248 6 15,27,64,20,79,43 12625 2526
Blood Alizadeh-V1 cDNA 42 2 21,21 4022 1095
Blood Alizadeh-V2 cDNA 62 3 42,9,11 4022 2093
Blood Alizadeh-V3 cDNA 62 4 21,21,9,11 4022 2093
Skin Bittner cDNA 38 2 19,19 8067 2201
Brain Bredel cDNA 50 3 31,14,5 41472 1739
Liver Chen cDNA 180 2 104,76 22699 85
Lung Garber cDNA 66 4 17,40,4,5 24192 4533
Multi-tissue Khan cDNA 83 4 29,11,18,25 6567 1069
Prostate Lapointe-V1 cDNA 69 3 11,39,19 42640 1625
Prostate Lapoint-V2 cDNA 110 4 11,39,19,41 42640 2496
Brain Liang cDNA 37 3 28,6,3 24192 1411
Endometrium Risinger cDNA 42 4 13,3,19,7 8872 1771
Prostate Tomlins-V1 cDNA 104 5 27,20,32,13,12 20000 2315
Prostate Tomlins-V2 cDNA 92 4 27,20,32,13 20000 2315
Figure 1: Evidence accumulation clustering.
BIOINFORMATICS 2017 - 8th International Conference on Bioinformatics Models, Methods and Algorithms
178

2.2.2 Hierarchical Clustering
Agglomerative, bottom up, hierarchical clustering
was used with the Euclidean metric and several
linkages. Initially, each sample is assigned its own
cluster, which is further repeatedly merged using
certain linkage criteria until all samples are in one
cluster (Hastie et al., 2009). In this work Average and
Ward’s linkage (Ward, 1963) were tested. Average-
link groups the cluster pairs with the least mean
distance between the samples of each cluster, whereas
Ward’s linkage merges clusters resulting in the least
increase in within-cluster variance upon being
merged. The output hierarchy of the clusters can be
visualized in the form of a tree, called dendrogram. In
the dendrogram, each leaf node is an individual
sample, each inner node in the tree is the union of its
subclusters and the root is the cluster containing all
the samples. The final partition is obtained by cutting
the tree to result in the same number of clusters as the
number of classes k, in the given data set.
2.2.3 Evidence Accumulation Clustering
The simple use of a clustering algorithm, like K-
means, can give a diversity of solutions over the same
data set depending on the initialization, or of the
chosen k value. To overcome this issue, an approach
known as Clustering Ensemble has been proposed
that takes into account the diversity of solutions
produced by clustering algorithms. Clustering
ensembles can be generated from either different
clustering algorithms or from varying the algorithmic
parameters (Strehl and Ghosh, 2002; Ayad and
Kamel, 2008). To leverage clustering ensemble
results, Fred and Jain (2005) proposed an approach
known as Evidence Accumulation Clustering (EAC),
based on the combination of information of different
partitions, as illustrated in Figure 1.
The evidence accumulation clustering can be
summarized in the following steps: (i) building the
clustering ensemble, P, comprising the set of M
different partitions of a data set X.; (ii) combining
evidence from these partitions in a co-association
matrix; (iii) extracting the consensus partition. The
co-association matrix is built by taking the co-
occurrences of pairs of patterns in the same cluster as
votes for their association. The underlying hypothesis
is that patterns which should be grouped together, are
very likely to be assigned to the same cluster in
different data partitions. Therefore, the M data
partitions of N patterns yields a N x N
co - association matrix with elements:
=
(1)
where
is the number of times the pattern pair (i,j)
is assigned to the same cluster among the M
partitions. The last step of the evidence accumulation
clustering consists of extracting the consensus
partition, which is found by applying a clustering
algorithm to the co-association matrix.
In this paper, the clustering ensemble was
produced by applying k-means M=200 times, with k
randomly chosen between[
√
2
,
√
]. The
extraction of the consensus partition was performed
by applying two hierarchical clustering algorithms:
average-link and Ward's linkage with the final
number of clusters equal to the true number of
classes. The whole procedure, from the clustering
ensemble generation was repeated 50 times, with the
same parameters and the results are averaged.
2.2.4 Clustering Validation Measure
The validation of each clustering algorithm in each
data set is performed using the Adjusted Rand Index
(ARI) (Hubert and Arabie, 1985), which compares
the partition obtained by a clustering algorithm C =
{C
1
, C
2
, … , C
k
} against the ground-truth partition L
= {L
1
, L
2
, ..., L
s
}. This measure is an improved
version of Rand Index (RI) (Rand, 1971), which
quantifies agreement between two partitions by
counting the number of pairs of samples that are
clustered together or placed in different clusters in
both partitions, and the disagreement between
partitions by counting the number of pairs that are
clustered together in one partition but not in the other.
ARI corrects RI for a chance that random partitions
agree; it ensures that the value is then close to 0. The
maximum value of 1 is reached when external labels
and those assigned by clustering algorithms are
identical up to a permutation.
3 RESULTS AND DISCUSSION
Firstly, we present overall results by boxplots that
include results obtained on Affymetrix and cDNA
data sets (Figure 2 and 3). Box plots uncover how
agreements between clustering results and true labels
corresponding to cancer types highly vary, spanning
from 0 to 1, when results from all sets are analyzed
jointly. Median values of all methods, except for HC-
average, are approximately the same. Similar results
can be observed from box plots corresponding to
cDNA results.
Consensus Clustering for Cancer Gene Expression Data - Large-Scale Analysis using Evidence Accumulation Approach
179
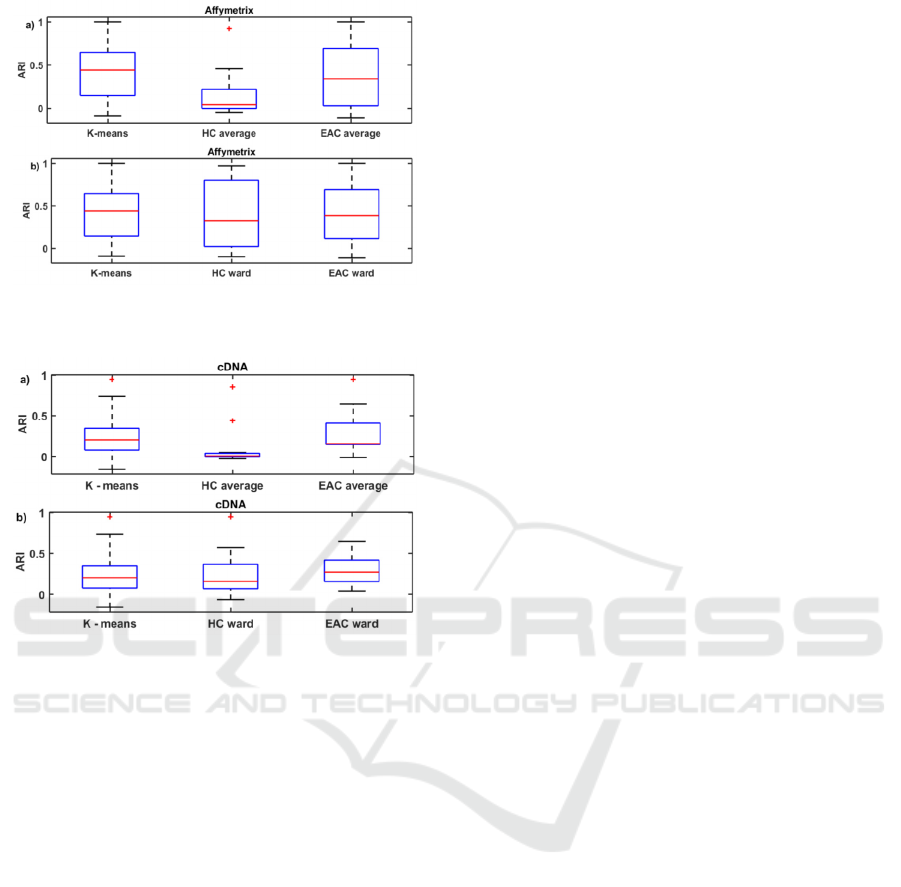
Figure 2: Box plots for ARI over all Affymetrix data sets
when HC and EAC use a) average-link b) Ward’s linkage.
Figure 3: Box plots for ARI over all cDNA data sets when
HC and EAC use a) average-link b) Ward’s linkage.
Only the strongest patterns can be observed from such
graphs. Results presented in this way imply that HC-
average is inappropriate for clustering cancer
genomics samples. Other methods should be further
examined across data sets to draw conclusions.
To compare EAC against individual clustering
approaches, we measured differences in the mean
ARI scores. Figures 4 and 5 present how the
difference in mean scores change across Affymetrix
and cDNA data sets. We can easily notice where EAC
improved the results. The results unveil that EAC
enhanced results on many data sets. The largest
failure of EAC was observed on Gordon data set
(ward version, Figure 4b) and Alizadeh v2 data set
(Figure 5a and 5b). These results were additionally
examined in the following discussion. We further
explored the results obtained on different data sets.
Results can be grouped into three categories thus
allowing us to infer useful conclusions. Here we
selected a few data sets to demonstrate different
scenarios and provide recommendations on EAC
algorithms usage. The first group of the results is
characterized by the stable result of K-means – the
same partition produced on almost all of 50 runs of
the algorithm with random initialization. This
scenario was observed on 8 out of 35 data sets. We
can inspect outcomes of clustering on Gordon data set
in Figure 6. K-means discovered partition that
perfectly aligned with the class labels. The result of
HC-ward was slightly below, but HC-average
completely failed to reconstruct cancer types. EAC-
average produced the same result as K-means,
however, Ward’s version of EAC broke down. Our
general recommendation is not to use EAC for data
sets where K-means converges to the same partition,
especially when HC clustering (average and/or
Ward’s) also confirms obtained partition. If there is
no consensus among K-means, and both version of
HC it makes sense to use EAC, but we would suggest
revising the way ensemble is created.
Our analysis revealed the advantage of EAC in the
scenarios where k-means produced results of
moderate variability (13 data sets). Variability of K-
means impacts the diversity of the ensemble.
Additional diversity induced by choosing different K
for the ensemble helped EAC to better resolve
uncertainties in assigning gene expression samples to
the clusters. Results obtained on Ramaswamy data set
and Nutt data sets (Figures 7 and 8) demonstrate EAC
typical performance in the moderate diversity
scenarios. EAC here managed to be at the level of the
best of K-means in 50 runs or highly surpassed its
performance. Similar conclusions were derived from
the study on another data collection (Hadjitodorov
2006). Also, EAC is preferable option over HC
clustering. EAC-ward performs better in this scenario
compared to EAC-average. In the worst case the
result of EAC was at the level of the median result of
K-means, but with lower or no variation in the final
result.
The third scenario encompasses cases where K-
means varies highly (14 data sets). High diversity of
ensemble is challenging for evidence accumulation
algorithms. Example is provided in Figure 9. We can
observe that EAC converges to the median result of
K-means. Alizadeh v2, also belongs to this group of
data sets, where EAC converged to the median K-
means performance. The results across other sets
from this category fluctuated around the median
performance of K-means and only on few data sets
significantly overpassed the result of the K-means.
EAC-ward handled better higher diversity of the input
ensemble compared to EAC-average. The scenario
where K-means vastly diverge indicates at difficulties
in clustering underlying data. EAC can be used to
reduce the uncertainty of clustering, but some other
options for constructing the ensemble and internal
measures of clustering validation should be further
considered.
BIOINFORMATICS 2017 - 8th International Conference on Bioinformatics Models, Methods and Algorithms
180
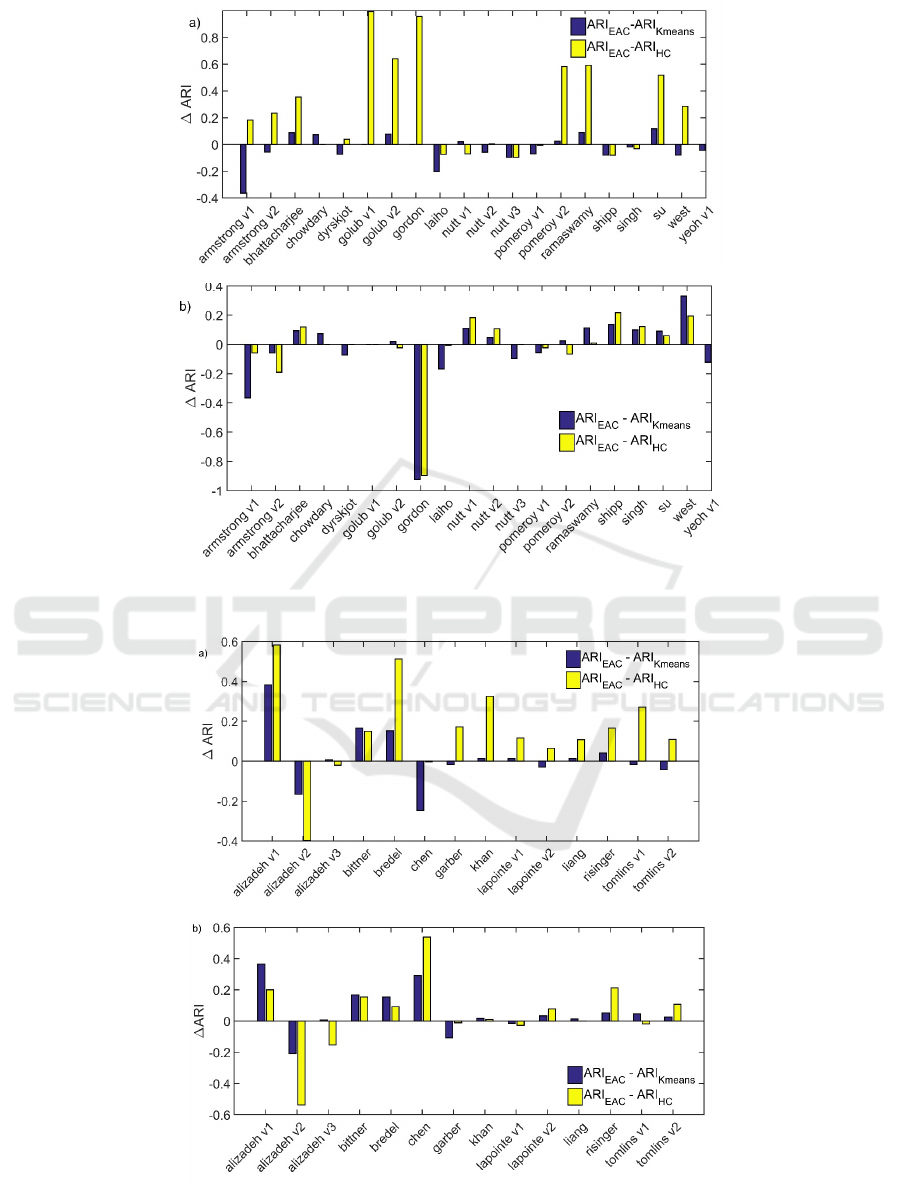
Figure 4: Affymetrix data sets: differences in ARI a) when average-link b) Ward’s linkage is used in both HC and EAC.
Positive differences mean the improvement is introduced using EAC consensus clustering.
Figure 5: cDNA data sets: differences in ARI a) when average-link b) Ward’s linkage is used in both HC and EAC. Positive
differences mean the improvement is introduced using EAC consensus clustering.
Consensus Clustering for Cancer Gene Expression Data - Large-Scale Analysis using Evidence Accumulation Approach
181
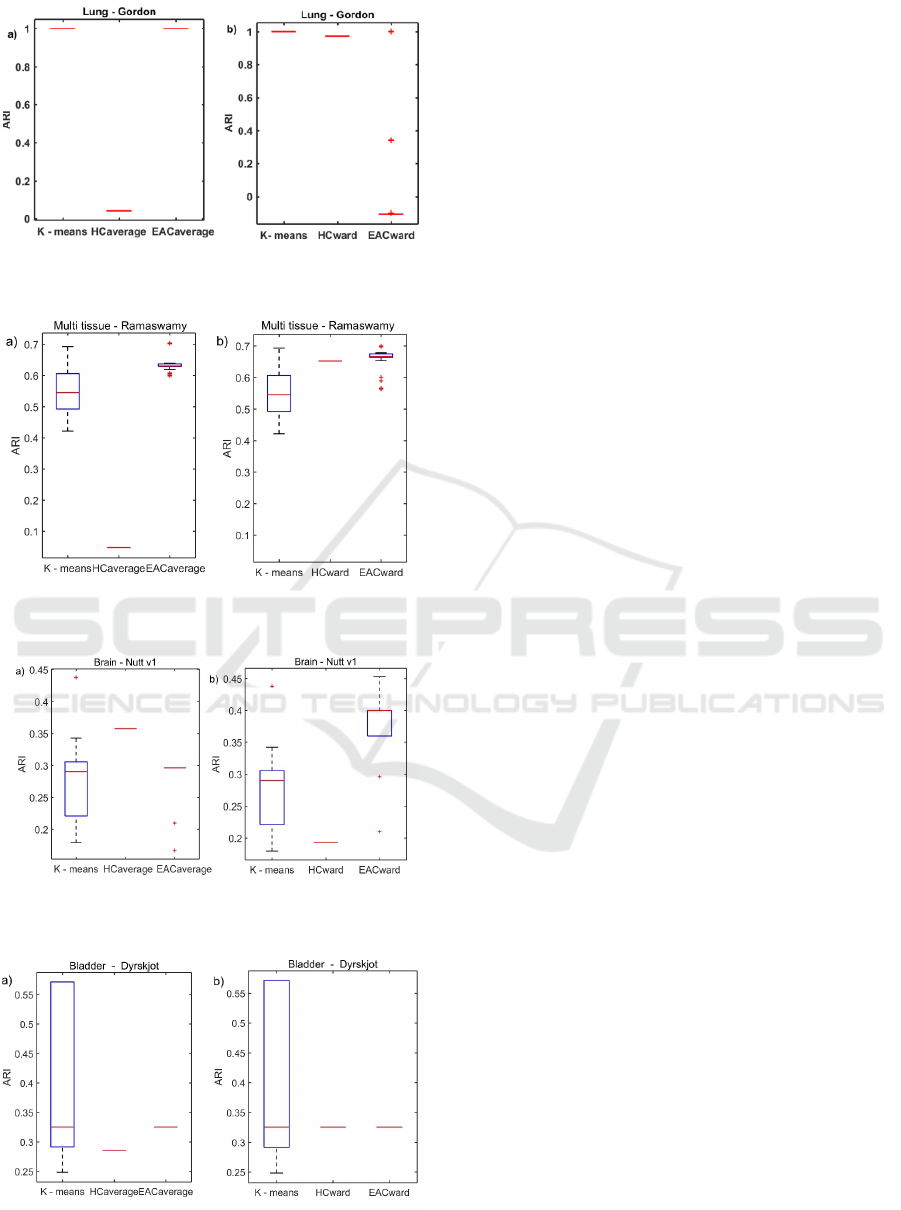
Figure 6: Comparison of ARI scores produced by different
clustering algorithms on Gordon data set.
Figure 7: Comparison of ARI scores produced by different
clustering algorithms on Ramaswamy data set.
Figure 8: Comparison of ARI scores produced by different
clustering algorithms on Nutt v1 data set.
Figure 9: Comparison of ARI scores produced by different
clustering algorithms on Dyrskjot data set.
4 CONCLUSIONS
The study presented here systematically evaluates the
performance of EAC and compares it to the most
common individual clustering approaches in the
cancer genomics domain. As expected for the study
that encompasses a larger collection of data sets, the
absolute winner among examined method was not
detected, but useful conclusions can be made. EAC
strongly depends on the variability of K-means, i.e.
when there is a moderate diversity among K-means
partitions, we can expect that EAC will improve
results. On data sets that are intrinsically difficult to
cluster, EAC tends to converge to the median
partition. While other studies on this collection of
cancer genomic data did selective reporting on results
highlighting only benefits, we critically evaluated
methods and raised several important issues. In this
light, our study improves objectivity in the
assessment of clustering in cancer genomics.
Further work will focus on evaluating different
metrics, ensemble construction techniques, feature
subset selection and the identification of data set
properties informative on selection of the most
appropriate clustering approach.
ACKNOWLEDGEMENTS
The work was in part financed by: the COST Action
TD1405 ENJECT grant awarded to Tatjana Lončar-
Turukalo for short term scientific mission hosted by
prof. Ana Fred at Institute for Telecommunications,
Instituto Superior Technico, Portugal, by Serbian
Ministry of Education and Science (Project III 43002,
TR32040), and by the Portuguese Foundation for
Science and Technology, scholarship number
SFRH/BPD/103127/2014 and grant PTDC/EEI-
SII/7092/2014.
REFERENCES
Alizadeh, A. et al., 2000. Distinct types of diffuse large B-
cell lymphoma identified by gene expression profiling.
Nature, 403(6769), pp.503-511.
Ayad, H. and Kame, M., 2008., Cumulative Voting
Consensus Method for Partitions with Variable Number
of Clusters, IEEE Transactions on Pattern Analysis and
Machine Intelligence, 30(1),160-173.
Bredel,M. et al., 2005. Functional network analysis reveals
extended gliomagenesis pathway maps and three novel
MYC-interacting genes in human gliomas. Cancer
Research, 65, 8679–8689.
BIOINFORMATICS 2017 - 8th International Conference on Bioinformatics Models, Methods and Algorithms
182

de Souto,M. et al., 2008. Clustering cancer gene expression
data: a comparative study. BMC Bioinformatics, 9, 497.
D'haeseleer, P., 2005. How does gene expression clustering
work?. Nature Biotechnology, 23(12), pp.1499-1501.
Fred,A.L.N., and Jain,A.K., 2005. Combining multiple
clusterings using evidence accumulation. IEEE Trans.
Pattern Analysis and Machine Intelligence., 27, 835–
850.
Golub, T. et al, 1999. Molecular Classification of Cancer:
Class Discovery and Class Prediction by Gene
Expression Monitoring. Science, 286(5439), pp.531-
537.
Hadjitodorov, S. T., Kuncheva, L. I., Todorova, L. P. 2006.
Moderate diversity for better cluster ensembles.
Information Fusion, 7(3), pp. 264-275
Hastie, T., Tibshirani, R. and Friedman, J. (2009). The
elements of statistical learning. New York: Springer.
Hubert, L., & Arabie, P., 1985. Comparing partitions.
Journal of classification, 2(1), 193-218. Springer.
Iam-on, N., Tossapon, B., and Garrett, S., 2010, LCE: a
link-based cluster ensemble method for improved gene
expression data analysis, Bioinformatics, 26(12), pp.
1513-1519
Jain, A.K., 2010. Data clustering: 50 years beyond k-means,
Pattern Recognition Letters, 14 (4), pp. 327-344.
Kuo et al., 2002. Analysis of matched mRNA
measurements from two different microarray
technologies, Bioinformatics, 18(3), pp. 405-412.
Lloyd, S., 1982. Least squares quantization in PCM. IEEE
Transactions on Information Theory, 28, 129–137.
Originally as an unpublished Bell laboratories
Technical Note (1957).
Mimaroglu, S., Aksehirli, E., 2012. Diclens: Divisive
clustering ensemble with automatic cluster number.
IEEE/ACM Transactions on Computational Biology
and Bioinformatics (TCBB), 9(2), 408-420.
Sorlie,T. et al., 2003. Repeated observation of breast tumor
subtypes in independent gene expression data sets.
Proceedings of the National Academy of Sciences,
100(14), pp.8418-8423.
Steinhaus, H., 1956. Sur la division des corp materiels en
parties. Bulletin of Acad. Polon. Sci., IV(C1. III), 801–
804.
Strehl, A., and Ghosh, J., 2002., Cluster Ensembles - A
Knowledge Reuse Framework for Combining Multiple
Partitions, Journal of Machine Learning Research,3,
583-617.
Rand, W. M., 1971. Objective criteria for the evaluation of
clustering methods. Journal of the American Statistical
association, 66(336), 846-850.
Rung, J., Brazma, A., 2013. Reuse of public genome-wide
gene expression data," Nature Reviews Genetics, vol.
14(2), pp. 89-99.
Ward, H., 1963. Hierarchical Grouping to Optimize an
Objective Function. Journal of the American Statistical
Association. 58 (301): 236–244.
Consensus Clustering for Cancer Gene Expression Data - Large-Scale Analysis using Evidence Accumulation Approach
183
