
Automatic Separation of Basal Cell Carcinoma from Benign Lesions
in Dermoscopy Images with Border Thresholding Techniques
Nabin K. Mishra
1
, Ravneet Kaur
2
, Reda Kasmi
3
, Serkan Kefel
2
, Pelin Guvenc
2
, Justin G. Cole
1
,
Jason R. Hagerty
1,4
, Hemanth Y. Aradhyula
4
, Robert LeAnder
2
, R. Joe Stanley
4
, Randy H. Moss
4
and William V. Stoecker
1
1
Stoecker and Associates, Rolla, MO, U.S.A.
2
Southern Illinois University Edwardsville, Department of Electrical and Computer Engineering, Edwardsville, IL, U.S.A.
3
University of Begaia, Department of Electrical Engineering, Bejaia, Algeria
4
Missouri University of Science and
Technology,
Department of Electrical and Computer Engineering, Rolla, MO,
U.S.A.
{nkmhd3,
stanleyj, hamcb, rhm, wvs, jrh55c}@mst.edu, {reet4ever, rdkasmi, serkankefel, bobleande1}@gmail.com,
pelin.kefel@bioxconsulting.com, jgcole@iu.edu
Keywords: Basal Cell Carcinoma (BCC), Image Processing.
Abstract: Basal cell carcinoma (BCC), with an incidence in the US exceeding 2.7 million cases/year, exacts a
significant toll in morbidity and financial costs. Earlier BCC detection via automatic analysis of dermoscopy
images could reduce the need for advanced surgery. In this paper, automatic diagnostic algorithms are
applied to images segmented by five thresholding segmentation routines. Experimental results for five new
thresholding routines are compared to expert-determined borders. Logistic regression analysis shows that
thresholding segmentation techniques yield diagnostic accuracy that is comparable to that obtained with
manual borders. The experimental results obtained with algorithms applied to automatically segmented
lesions demonstrate significant potential for the new machine vision techniques.
1 INTRODUCTION
The incidence of basal cell carcinoma (BCC)
continues to rise worldwide, with incidence in the
USA of all non-melanoma skin cancer exceeding 3
million cases, per year (Rogers et al., 2010).
Morbidity and costs to society associated with
advanced cases of BCC are significant. Costs of
treatment for skin cancer more than doubled from
1998 to 2006 (Rogers and Coldiron, 2013). Newer
nonsurgical treatment techniques (Zeichner et al.,
2011) applicable to earlier-appearing lesions, could
be combined with automated diagnostic methods to
diagnose small lesions and treat them earlier.
Therefore, automatic diagnosis of early lesions could
provide significant societal benefits.
Automated pre-biopsy diagnosis of BCC was
first attempted in the 1980s, using clinical images
(Moss et al., 1989). The advent of dermoscopy,
provided superior images containing far more detail
and created a proliferation of the signs that identify
melanoma and non-melanoma skin cancer
(Argenziano et al., 2003; Stolz et al., 2002; Soyer et
al., 2007, Marghoob et al., 2012). A number of
studies appeared using image analytic techniques to
detect melanoma in dermoscopy images. Relatively
few studies used image analytic techniques to
identify structures in BCC, including ulcers,
semitranslucency, telangiectasia, and pigmented
structures (Kefel et al., 2012; Guvenc et al., 2013;
Cheng et al., 2011; Cheng et al., 2012; Cheng et al.,
2013).
Pre-biopsy diagnosis of BCC has also been
attempted using multiple alternative approaches, that
incorporate various novel technologies for acquiring
images, including confocal microscopy (Castro et
al., 2015; Ahlgrimm-Siess et al., 2009; Eberhardt et
al., 2004), optical coherence tomography (OCT)
(Duan et al., 2014; Avanaki et al., 2013; Castro et
al., 2015), multispectral imaging (Zhang et al., 2000;
Tehrani et al., 2007; Ly et al., 2009), chemical
application and photodynamic methods (Won et al.,
2007; Kopriva et al., 2007; Gambichler et al., 2008).
Studies applying non-imaging techniques have
utilized impedance (Beetner et al., 2003; Dua et al.,
2004; Aberg et al., 2004) and Raman spectroscopy
(Larraona-Puy et al., 2009; Nijssen et al., 2002).
K. Mishra N., Kaur R., Kasmi R., Kefel S., Guvenc P., G. Cole J., R. Hagerty J., Y. Aradhyula H., LeAnder R., Joe Stanley R., H. Moss R. and V. Stoecker W.
Automatic Separation of Basal Cell Carcinoma from Benign Lesions in Dermoscopy Images with Border Thresholding Techniques.
DOI: 10.5220/0006173601150123
In Proceedings of the 12th International Joint Conference on Computer Vision, Imaging and Computer Graphics Theory and Applications (VISIGRAPP 2017), pages 115-123
ISBN: 978-989-758-225-7
Copyright
c
2017 by SCITEPRESS – Science and Technology Publications, Lda. All rights reserved
115
However, all of these alternative approaches have
disadvantages, including more expensive equipment,
slower acquisition time, and in some cases, a steep
learning curve before properly operating the
equipment and interpreting results. Dermoscopy
images are acquired quickly. Some approaches
require a probe that cannot be used on the earliest-
appearing BCCs which are as small as 1mm in
diameter. Many clinics already have the apparatus
needed for dermoscopy. So, digital dermoscopy
analysis performed on common, conventional, gel-
contact, non-polarized images have advantages over
alternate methods in diagnosing BCC. The purpose
of this study was to determine the feasibility of
automatic differentiating BCC from benign lesions
by combining image analytic techniques applied to
dermoscopy images with patient information and
general image information.
2 METHODS
2.1 Experimental Data Sets
This study analyzed 1023 digital, 1024x768-pixel,
gel-contact, non-polarized, dermoscopy images of
lesions acquired during the National Institutes of
Health-funded study SBIR R44 CA-101639-02A2
2007-2009. This set of images included 305 BCC
lesions of which 26 (8.5%) were infiltrative, 28
(9.2%) were superficial, and 1 (0.33%) was
metatypical, or baso-squamous. BCC size, measured
at the greatest diameter, ranged 1-45mm, with
median size = 6mm. Of these lesions, 47/305
(15.4%) were ≤ 3mm. There were 176 (57.7%) on
heads and necks, 43 (14.1%) on upper limbs, 24
(7.9%) on lower limbs, and 62 (20.3%) on patients’
trunks. Only 88 (28.9%) of patients had concern
about the lesions; and 111 (36.4%) of patients noted
a change in their lesion. Also, included in this set
were 718 benign images of which 290 (40.4%) were
nevi, 89 (12.4%) were dysplastic nevi, 5 (0.7%)
were sebaceous hyperplasia, and 124 (17.3%) were
seborrheic keratoses, with the remainder having
various benign diagnoses.
Lesion images were acquired at four clinics in
Plantation FL, Rolla MO, Columbia MO and
Stamford CT. The Phelps County Regional Medical
Center Institutional Review Board (Rolla, Missouri)
approved this research. Only two of the BCCs were
not biopsied and examined by a dermatopathologist;
these were diagnosed using confocal microscopy.
All benign lesions were either biopsied, or serially-
examined and determined to have no change.
2.2 Overall Approach
Our general approach was to apply digital image
analysis techniques previously used in melanoma
detection (Jella, 2004; Mishra, 2014; Mishra et al.,
2016; Gutman et al., 2016; Codella et al., 2016;
Kaushik et al., 2013; Stoecker et al., 2013; Stoecker
et. al., 2015) to find dermoscopy features in images
of BCC. To these features, two features specific to
BCC were added: vascular blush / semitranslucency
(Kefel et al., 2016) and vessels / telangiectasia
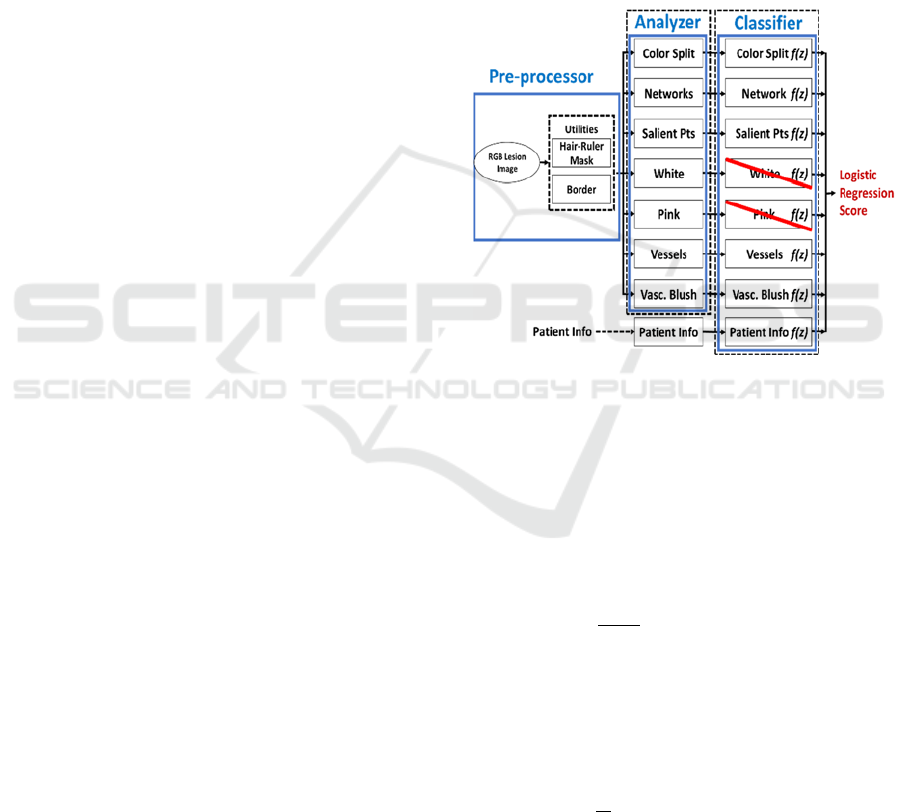
(Cheng et al., 2011). The overall approach is shown
in Figure 1.
Figure 1: Overall system for BCC classifier. The seven
image analyser modules are reduced to five modules at the
classifier stage by logistic regression. The patient
information module provides a sixth final module.
The final result is acquired with logistic
regression using a leave-one-out cross validation
technique.
The logistic regression function is defined by
equation 1.
φ
z
=
1
1+e
-z
where z=W
T
X
(1)
where X is a matrix with dimension d and W
contains the weights for X. The desired hypothesis
can be achieved by minimizing the equation 2 using
iterative gradient approach (Abu-Mostafa et al.,
2012).
E
in
=
1
N
log(1+e
-y
n
W
T
X
n
)
N
n=1
(2)
where N is the No. of samples, y
i
will be either one
or zero for positive and negative set respectively.
VISAPP 2017 - International Conference on Computer Vision Theory and Applications
116
2.3 Border Generating Methods
This research applied six different lesion border
segmentation algorithms based on five different
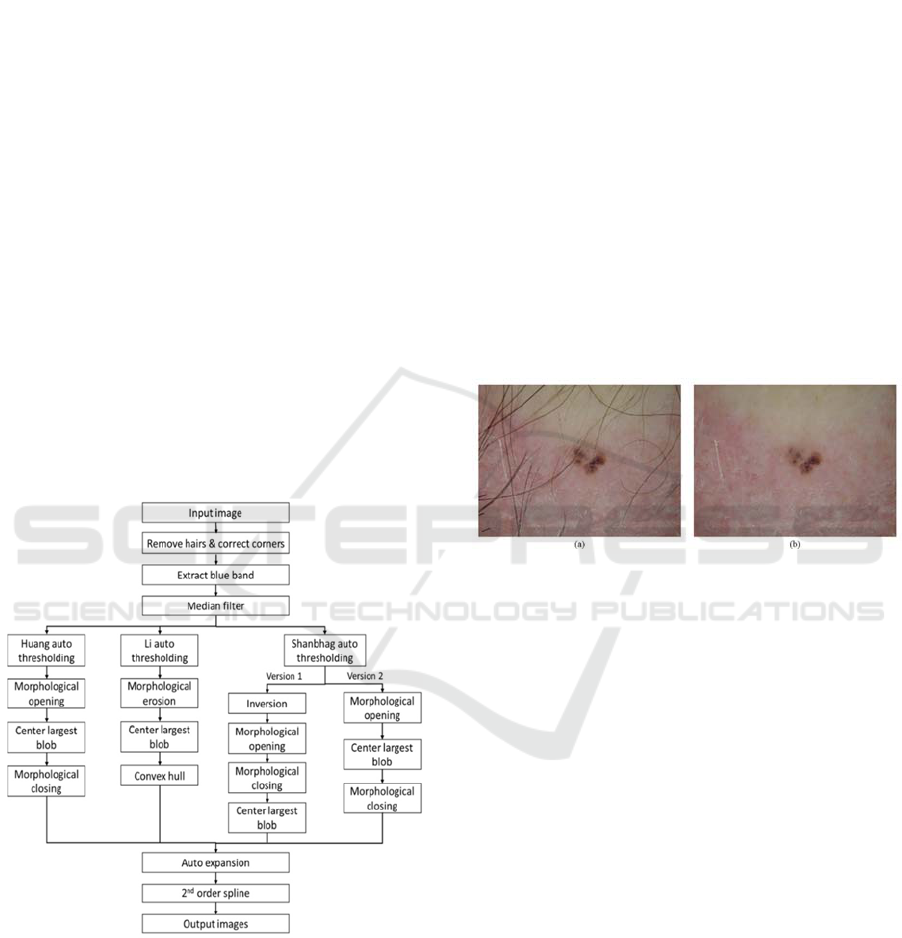
thresholding algorithms (Kaur et al., 2016). The pre-
and post-processing for these algorithms is shown in
Figure 2. The first thresholding method, based on
work by Huang and Huang, minimizes the fuzziness
measure of a dermoscopy skin lesion image
(Landini, 2013; Huang and Huang, 1995) (Huang,
Figure 2).
The next skin lesion segmentation algorithm
based on work by Li and Tam, was based on
minimum, cross-entropy thresholding, where
threshold selection was done by minimizing the
cross entropy between the dermoscopy image and its
segmented version (Landini, 2013; Li and Tam,
1998) (Li, Figure 2).
Finally, an effective image information measure
was obtained by modifying an image entropy-
measure-based thresholding method; this helped
obtain two more lesion borders using the assistance
of different pre-processing and post-processing
methods (Landini, 2013; Shanbhag, 1994)
(Shanbhag-1 and -2, Figure 2).
Figure 2: Flowchart for Huang, Li and Shanbhag
algorithms. Isodata and Otsu methods follow Shanbhag-2.
Kaur et al. also discussed that Otsu (Otsu, 1979) and
Isodata (Riddler and Calvard, 1978) methods
produced borders similar to Huang, Li and Shanbhag
borders. From the four algorithms in Figure 2,
Shanbhag-2 pre- and post-processing provided the
best results for Otsu and Isodata thresholding
methods.
Hair removal is a crucial pre-processing step
used in all the algorithms. The hair removal
technique (Kasmi, 2016) was developed by
converting an image to grayscale and then scanned
by a horizontal array of 1x7 pixels; if the difference
between the smallest and the largest pixel values
was more than 15, then the smallest pixel indicated
the presence of hair. On the identified hair segment,
three horizontally-oriented parallel masks were
centered and replaced by the average of the two
adjacent masks. This process is followed by the
same procedure using a vertical array. The final
mask is subtracted from the grayscale image
following a binary thresholding to produce the hair
mask. This mask undergoes multiple morphological
operations and the linear interpolation inpainted
technique is applied to remove the unwanted hairs
(Kasmi, 2016). An example of hair removal can be
seen in Figure 3.
Figure 3: Example for hair removal. (a) Image with hairs,
(b) Image after hair removal.
The two utilities above, hair removal and image
segmentation to determine the border, were applied
to each image prior to processing for the following
lesion structures.
2.4 General Lesion Network Structure
2.4.1 Atypical Pigment Network Detection
Benign melanocytic nevi usually contain a visible
pigment network that is either fairly symmetric and
regular, or atypical. A pigment network whose
network structure varies in size and shape is called
an “irregular” or “atypical pigment network” (APN).
Different varieties of irregular wide/or dark APN
aberrations may be appear as brown, black, gray
meshes or thick lines in dermoscopy images
(Argenziano et al., 1998). The variance detection
method for APN summarized here is described in
Mishra, 2014). Nearly all APN areas have relatively
high variance in the relative-red plane, obtained by
subtracting the average red value of surrounding
skin from the red values in the RGB image. The
relative-red plane is divided into 16x16 blocks.
Automatic Separation of Basal Cell Carcinoma from Benign Lesions in Dermoscopy Images with Border Thresholding Techniques
117
Blocks where variance falls above an adaptive
threshold calculated using the mean and standard
deviation of variance among all the 16x16 blocks of
the lesion, are candidates for APN. Because
granularity (Braun et al., 2007) can mimic APN, a
green-to-blue ratio threshold was used to remove the
false positive granular structures that were detected
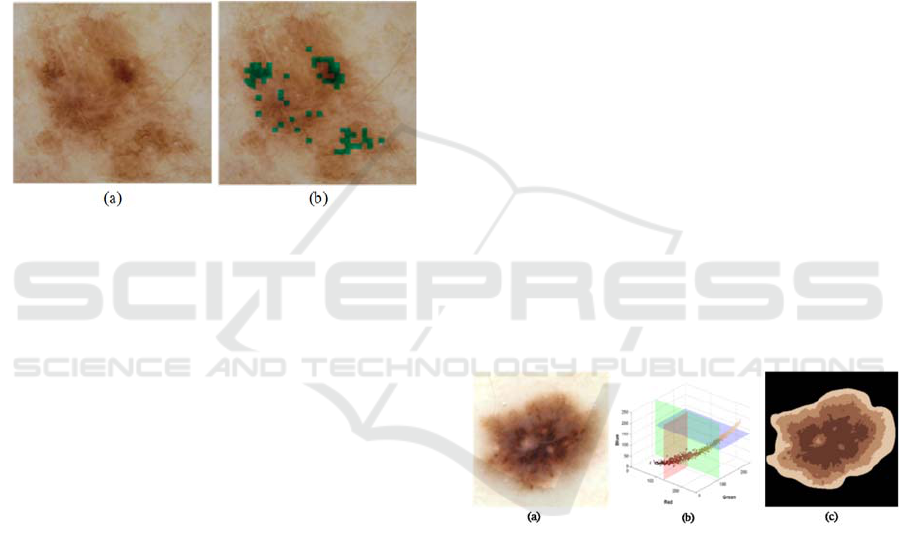
as APN. Figure 4 shows (a) an image of a benign
lesion having an APN and (b) the lesion’s APN
enhanced with an overlay. Features such as atypical
area size and asymmetry are used to measure APN.
The pigment network of the benign melanocytic
nevus in Figure 4, is reasonably symmetrical and
was correctly identified as benign.
Figure 4: Benign lesion with APN overly. (a) Original
image, (b) APN overlay.
2.4.2 Salient Point Detection
“Salient points” are those points which are detected
using Steger’s method of line detection (Steger,
1996). Dark lines in an image have a low first order
derivative in the direction of the line, and a high
second derivative in the orthogonal direction. The
best results of trials performed in discriminating
melanoma were obtained by using the intensity
plane ((R+G+B)/3) to detect salient points (Jella,
2004). The method is best implemented by first
smoothing, or blurring the intensity image with a
Gaussian filter, as a pre-processing step. The choice
of the filter sigma can significantly affect the
outcome. 1.02 was experimentally found to be
sigma’s optimal value (Jella, 2004). After finding
the salient points, they were used to calculate
various texture and color features that would help
detect melanoma. Salient points used that way tend
to favor sharp edges of dark structures.
2.5 General Lesion Structure 3: Color
Segmentation by Median Split
Technique
“Median split” is a pixel-clustering method that is
based on the characteristics of an image’s histogram
(Heckbert, 1982; Umbaugh et al., 1989; Umbaugh,
2010; Kaushik et al., 2013). The method was
originally used in the development of an image
compression technique (Heckbert, 1982). In this
present application, after the lesion border was used
to segment the lesion from the rest of the
dermoscopy image, the median split algorithm was
applied to pixels in the area of the lesion. To apply
the technique, first, all lesion-area pixels are
considered to be in a single color bin that has R, G
and B dimensions. The dimension having the largest
range is then split at the median color, such that the
two resulting bins have equal numbers of pixels.
Each iteration first considers the ranges of the colors
in each bin, and then splits the bin having the largest
range into two bins having equal pixel populations.
The bin with the highest range on any color axis is
chosen for the subsequent split. Within the chosen
bin, the split is performed along the color axis
having the highest range. In this study, three
iterations were performed, resulting in a lesion’s
segmentation into four color regions. Each region
was then represented by its average color. Figure 5
illustrates the results of a median split obtained from
the original RGB image of a benign nevus. Note that
the lesion mask was applied to the RGB image,
before applying the median split algorithm, so that
only the lesion colors were split. Note also, that the
symmetry and radial gradient of the colors were
captured using the median split algorithm.
Figure 5: Median split segmentation performed by
subsequent splitting of the plane with highest range. (a)
Original dermoscopy image, (b) Histogram, (c) Median
split image.
2.6 BCC Structure
2.6.1 Telangiectasia Detection
The small blood vessels seen in basal cell
carcinomas are called telangiectasia (Argenziano et
al., 2003). An algorithm for telangiectasia detection
was implemented in (Cheng et al., 2011). In the
most advanced case, telangiectasia takes the form of
wider vessels branching into smaller vessels like a
tree does; consequently, that process is called
“arborizing” telangiectasia. Non-arborizing
VISAPP 2017 - International Conference on Computer Vision Theory and Applications
118
telangiectasia are more common and seen in the
earlier development of BCC. The presence of
vessels alone is not significant, because wide
telangiectasia may be seen in any sun-damaged skin
(Figure 6a, on the upper right). The detection
technique uses drops at 45-degree directions from a
pixel. If drop thresholds for a given pixel distance
are met, then a candidate telangiectasia pixel is
present (Figure 6b). Because bubble and hair noise
can interfere with telangiectasia detection, a separate
hair mask was applied, first. This telangiectasia
detection method was used to remove the bubble
noise (Figure 6c) and consequently find the
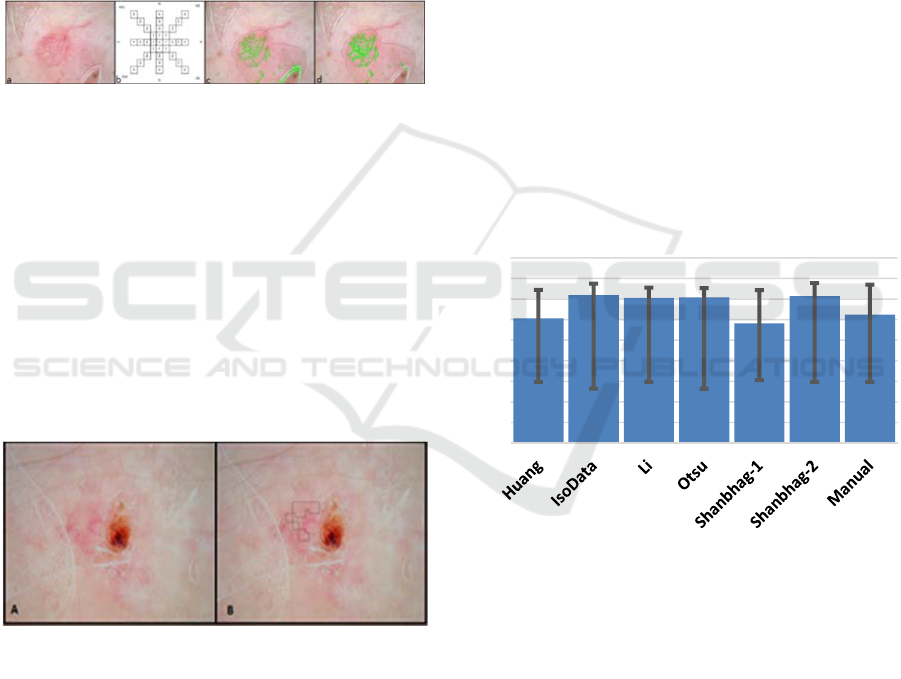
telangiectasia in Figure 6d.
Figure 6: (a) Telangiectasia, (b) Cheng drop algorithm, (c)
Bubble noise (d) Bubble noise removed.
2.6.2 Semitranslucency Detection
Smooth areas known as semitranslucencies are
useful in detecting BCC (Stoecker et al., 2009).
Distinguishing these areas from other areas depends
critically on features of color and smoothness
(Cheng et al., 2011; Cheng et al., 2012). To
implement automatic detection, smoothness- and
color-based filtering was employed with the use of
control limits by (Kefel et al., 2016). Example
images showing semitranslucency detection in BCC
are shown in Figure 7.
Figure 7: BCC with detected smooth semitranslucent areas
found automatically.
2.7 Final Stage: Demographic-feature
Data Incorporation
Data recorded for each patient included age in years,
gender, lesion size, lesion location (head/neck,
abdomen, chest, back, upper extremities, lower
extremities), changes noted in the lesion (yes/no),
concern about the lesion (yes/no), and patient
location (2 values, residing within 30 degrees of the
equator or not).
3 RESULTS
3.1 Performance of BCC Diagnostic
Model with Different Borders
The logistic regression models for each of the six
modular components in the final decision model
were constructed using a leave-one-out cross
validation technique via the Logit procedure, in the
SAS software environment (SAS Institute Inc. Cary,
NC). These models were then combined into a single
logistic regression model that would separate 305
BCC from 718 competing, benign lesions. SAS’s
Logistic regression model applies the leave-one-out
technique to separate the training set from the test
set one-by-one, to effect model construction. The
decision accuracy for the model is the maximum
obtained over the possible logistic probabilities,
which range 0-1. Results of the mean decision
accuracy are shown for the six automatic border
techniques and manual borders, Figure 8.
Figure 8: Mean diagnostic accuracy vs. border method,
with errors bars shown.
The average diagnostic performance obtained using
the dermatologist expert-determined border is
slightly exceeded by the diagnostic performance
using two of the automatic borders methods: Isodata
and Shanbhag-2.
3.2 XOR Error for Automatic Borders
There are significant differences between the
automatic borders and the manual dermatologist
borders. The XOR border difference, which counts
the total pixel error and divides by the total manual
(dermatologist) border is defined in Equation 3
0
0,1
0,2
0,3
0,4
0,5
0,6
0,7
0,8
0,9
Automatic Separation of Basal Cell Carcinoma from Benign Lesions in Dermoscopy Images with Border Thresholding Techniques
119
(Celebi et al., 2009; Celebi et al., 2015; Hance et al.,
1996).
XOR Error=
Area(AM ⊕ MM)
Area(MM)
=
FP+FN
TP+FN
(3)
where AM = Automatic border mask, MM = Manual
border mask, and ⊕ symbolizes the logical XOR
between the two masks. Respectively, FN and FP
are the lesion and non-lesion pixels falsely detected;
TP and TN are the lesion and non-lesion pixels
correctly detected, where “lesion”, indicates the
manual border (Kaur et al., 2016). The average
difference between the automatic borders measured
by XOR error is shown in Figure 9.
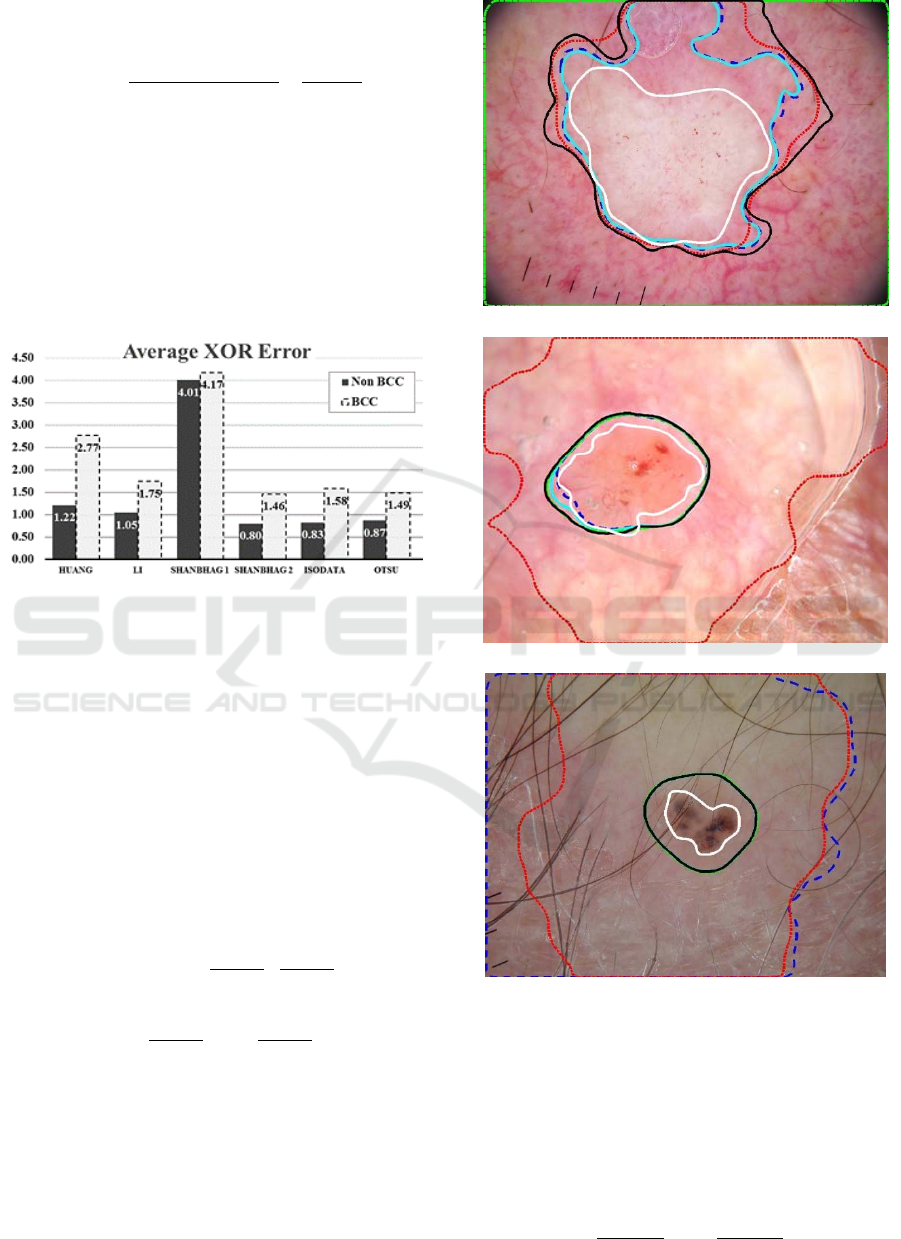
Figure 9: Average XOR error for 6 methods.
This XOR error exceeds four, i.e. quadruple the
lesion area, in the case of Shanbhag-1 borders.
Overall all XOR errors for BCC segmentation
exceed 1.46 for BCCs. This implies that the
segmentations are quite different. The average XOR
difference between automatic and manual borders is
greater than the lesion area. Examples of automatic
borders are given, Figure 10.
XOR error under-represents the FN errors and
over-represents the FP errors, Sforza et al. developed
the relative XOR error for border inaccuracy
measure using equation 4. (Sforza et al., 2012, Kaur
et al., 2016)
Relative XOR Error =
FN
TP+FN
+
FP
FP+TN
=
(4)
= 1–
TP
TP+FN
+ 1–
TN
TN+FP
where FN/(TP+FN) and FP/(FP+TN) are the FN
and FP ratios, respectively. FN and FP ratio can also
be represented as sensitivity and specificity
respectively by the two fraction terms in the right in
equation 4. Using the relative XOR error, Kaur et al.
developed lesion capture ratio using the weights ω
from the manual grading shown in equation 5. (Kaur
et al., 2016)
(10a)
(10b)
(10c)
Figure 10a-c: Examples for BCC lesion mask overlay for
all five methods: Dashed blue – Isodata, Dashed-dotted
green – Li, Solid Teal – Otsu, Dotted Red – Shanbhag-1,
Solid black – Shanbhag-2, and Solid White – manual
border. The borders vary widely. Note that the automatic
segmentation routines often include areas outside the
manual (white) border.
Weighted XOR Error =
(5)
1– ω
FN
FN + TP
+ω
FP
FP + TN
VISAPP 2017 - International Conference on Computer Vision Theory and Applications
120

4 DISCUSSION
This research gives results for automatic detection of
a large group of BCCs and benign lesions. Despite
significant differences between the manual borders
and the automatic borders, in yielding the correct
diagnosis, automatically-generated lesion borders in
some cases can perform slightly better than manual
borders.
This study is the largest known study of
automatic diagnosis performed on a set of BCCs and
benign lesions. These lesions, acquired from US
private practice clinics, were challenging for
machine vision, as some were as small as 1mm in
greatest diameter.
5 CONCLUSIONS
Sets of dermoscopy images of basal cell carcinoma
can automatically be separated from images of
benign lesions with moderate accuracy using the
leave-one-out training and testing on 1023 lesion
images and factoring in clinical data. Steps taken
during this study included automatic construction of
hair masks, automatic lesion segmentation, and the
determination of multiple logistic regression
functions: three for general dermoscopic color and
structure features, two for specific basal cell
carcinoma features, and one for demographic
variables. Experimental results show that the
automatically-determined borders perform similarly
and in some cases slightly better than manually-
determined borders. The hierarchical logistic
regression techniques demonstrated here can
perform well in separating malignant lesions from
benign lesions. No single logistic regression
classifier achieved the level of performance obtained
when factoring together the results from the
individual classifiers. This research shows that
diagnostic success with machine vision does not
always require accurate expert-determined borders.
This research highlights the potential that the
hierarchical, regression-selection process, fused with
demographic data, can serve as a model for
effectively diagnosing skin lesions.
ACKNOWLEDGEMENTS
This publication was made possible by Grant
Number SBIR R44CA-101639-02A2 of the National
Institutes of Health (NIH). The contents of this
article are solely the responsibility of the authors and
do not necessarily represent the official views of
NIH, the sponsor.
REFERENCES
Aberg, P. et al., 2004, Skin cancer identification using
multifrequency electrical impedance--a potential
screening tool, IEEE Trans Biomed Eng, 51(12),
pp.2097-2102.
Abu-Mostafa, Y.S., Magdon-Ismail, M., Lin, H.T., 2012,
Learning from Data, Vol 4, AML Book, Signapore.
Ahlgrimm-Siess, V. et al., 2009, Reflectance confocal
microscopy in the daily practice, Semin Cutan Med
Surg, 28(3), pp.180-189.
Argenziano, G. et al., 1998, Epiluminescence microscopy
for the diagnosis of doubtful melanocytic skin lesions:
comparison of the ABCD rule of dermatoscopy and a
new 7-point checklist based on pattern analysis, Arch
Dermatol, 134(12), pp.1563-1570.
Argenziano, G. et al., 2003, Dermoscopy of pigmented
skin lesions: results of a consensus meeting via the
Internet, J Amer Acad Dermatol, 48(5), pp.679-693.
Avanaki, M.R. et al., 2013, Investigation of basal cell
carcinoma using dynamic focus optical coherence
tomography, Appl Opt, 52(10), pp.2116-2124.
Beetner, D.G. et al., 2003, Differentiation among basal
cell carcinoma, benign lesions, and normal skin using
electric impedance, IEEE Trans Biomed Eng, 50(8),
pp.1020-1025.
Braun, R.P. et al., 2007, The significance of multiple blue-
grey dots (granularity) for the dermoscopic diagnosis
of melanoma, Br J Dermatol, 157(5), pp.907-913.
Castro, R.P. et al., 2015, Accuracy of in vivo confocal
microscopy for diagnosis of basal cell carcinoma: a
comparative study between handheld and wide-probe
confocal imaging, J Eur Acad Dermatol Venereol,
29(6), pp.1164-1169.
Celebi, M.E., Schaefer, G., Iyatomi, H., Stoecker, W.V.,
2009, Lesion Border Detection in Dermoscopy
Images, Comput Med Imaging Graph, 33(2), pp. 148–
153.
Celebi, M.E., Wen, Q., Iyatomi, H., Shimizu, K., Zhou,
H., Schaefer, G., 2015, A state-of-the-art survey on
lesion border detection in dermoscopy images.
Dermoscopy Image Analysis, M. E. Celebi, T.
Mendonca and J. S. Marques, Eds., Boca Raton, CRC
Press, pp. 97–129.
Codella, N.C., Gutman, D., Dusza, S., Marchetti, M.,
Marghoob, A., Helba, B., Mishra, N., Kalloo, A.,
Halpern A., 2016, Skin Lesion Analysis toward
Melanoma Detection, Proceedings of the Society for
Melanoma Research (SMR).
Cheng, B. et al., 2011, Automatic detection of basal cell
carcinoma using telangiectasia analysis in dermoscopy
skin lesion images, Skin Res Technol, 17(3), pp.278-
287.
Cheng, B. et al., 2012, Automatic telangiectasia analysis
Automatic Separation of Basal Cell Carcinoma from Benign Lesions in Dermoscopy Images with Border Thresholding Techniques
121

in dermoscopy images using adaptive critic design,
Skin Res Technol, 18(4), pp.389-396.
Cheng, B. et al., 2013, Automatic dirt trail analysis in
dermoscopy images, Skin Res Technol, 19(1), pp.e20-
26.
Dua, R. et al., 2004, Detection of basal cell carcinoma
using electrical impedance and neural networks, IEEE
Trans Biomed Eng, 51(1), pp.66-71.
Duan, L. et al., 2014, Automated identification of basal
cell carcinoma by polarization-sensitive optical
coherence tomography, Biomed Opt Express, 5(10),
pp.3717-3729.
Eberhardt, C. et al., 2004, Early detection of skin cancer
(EDISCIM) through the use of non-invasive confocal
imaging, Stud Health Technol Inform, 103, pp.279-
286.
Gambichler, T., Moussa, G., Altmeyer, P., 2008, A pilot
study of fluorescence diagnosis of basal cell using a
digital flash light-based imaging system, Photo
dermatol Photoimmunol Photomed, 24(2), pp.67-71.
Gutman, D., Codella, N.C.F., Celebi, E., Helba, B.,
Marchetti, M., Mishra, N., Halpern, A., 2016, Skin
Lesion Analysis toward Melanoma Detection: A
Challenge at the International Symposium on
Biomedical Imaging (ISBI) 2016, hosted by the
International Skin Imaging Collaboration (ISIC),
arXiv preprint arXiv:1605.01397.
Guvenc, P. et al., 2013, Sector expansion and elliptical
modeling of blue-gray ovoids for basal cell carcinoma
discrimination in dermoscopy images, Skin Res
Technol, 19(1), pp.e532-536.
Hance, G.A., Umbaugh, S.E., Moss, R.H., Stoecker, W.V.,
1996, Unsupervised color image segmentation: with
application to skin tumor borders, IEEE Eng Med Biol,
15(1), pp. 104–111.
Heckbert, P., 1982, Color image quantization for frame
buffer display, SIGGRAPH Proceedings of the 9th
annual conference on Computer Graphics and
Interactive Techniques, 82, pp.297-307.
Huang, L.K., Huang, M.J., 1995, Image thresholding by
minimizing the measures of fuzziness, Pattern
Recognition, 28(1), pp.41-51.
Jella, P., 2004, Pigment network extraction and salient
point analysis. M.S. Thesis in Electrical Engineering,
University of Missouri, Rolla, MO, USA.
Kasmi, R., 2016, Biologically inspired Skin lesion
segmentation process, Ph.D. Dept. Elect. Eng., Univ.
Bejaia, Bejaia, Algeria.
Kaur, R., LeAnder, R., Mishra, N.K., Hagerty, J.R.,
Kasmi, R., Stanley, R.J., Celebi, M.E., Stoecker,
W.V., 2016, Thresholding methods for lesion
segmentation of basal cell carcinoma in dermoscopy
images, Skin Research and Technology, 2016, doi:
10.1111/srt.12352 (in press).
Kaushik, V.S.N. et al., 2013, The Median Split Algorithm
for Detection of Critical Melanoma Color Features,
VISAPP, 1, pp.492-495.
Kefel, S. et al., 2012, Discrimination of basal cell
carcinoma from benign lesions based on extraction of
ulcer features in polarized-light dermoscopy images,
Skin Res Technol, 18(4), pp.471-475.
Kefel, S., Kefel, S.P., LeAnder, R.W., Kaur, R., Kasmi,
R., Mishra, N.K., Rader, R.K., Cole, J.G., Woolsey,
Z.T., Stoecker, W.V., 2016, Adaptable texture-based
segmentation by variance and intensity for automatic
detection of semitranslucent and pink blush areas in
basal cell carcinoma, Skin Research and Technology,
22(4), pp. 412-422.
Kopriva, I. et al., 2007, Visualization of basal cell
carcinoma by fluorescence diagnosis and independent
component analysis, Photodiagnosis Photodyn Ther,
4(3), pp.190-196.
Landini, G., 2013, http://fiji.sc/Auto_Threshold#Li v1.15.
Larraona-Puy, M. et al., 2009, Development of Raman
microspectroscopy for automated detection and
imaging of basal cell carcinoma, J Biomed Opt, 14(5),
054031.
Li, C.H., Tam, P.K., 1998, An iterative algorithm for
minimum cross entropy thresholding, Pattern Recog
Lett, 19(8), pp.771-776.
Ly, E. et al., 2009, Differential diagnosis of cutaneous
carcinomas by infrared spectral micro-imaging
combined with pattern recognition, Analyst, 134(6),
pp.1208-1214.
Marghoob, A.A., Malvehy, J., Braun, F.P., 2012, An Atlas
of Dermoscopy, 2nd Edition, Boca Raton FL
:CRC
Press.
Mishra, N., 2014, Automated classification of malignant
melanoma based on detection of atypical pigment
network in dermoscopy images of skin lesions. Ph.D.
Thesis, Department of Electrical and Computer
Engineering, Missouri University of Science and
Technology, Rolla, MO.
Mishra, N.K., Celebi, M.E., 2016, An overview of
melanoma detection in dermoscopy images using
image processing and machine learning, arXiv
preprint arXiv:1601.07843.
Moss, R.H. et al., 1989, Skin cancer recognition by
computer vision, Comput Med Imaging Graph, 13(1),
pp.31-36.
Nijssen, A. et al., 2002, Discriminating basal cell
carcinoma from its surrounding tissue by Raman
spectroscopy, J Invest Dermatol, 119(1), pp.64-69.
Otsu, N., 1979, A threshold selection method from grey
level histograms, IEEE Trans Systems, Man, Cybern,
9(1), pp.62-66.
Riddler, T.W., Calvard, S., 1978, Picture thresholding
using an iterative selection method, IEEE Trans
Systems, Man, Cybern, 8, pp. 630-632.
Rogers, H.W. et al., 2010, Incidence estimate of
nonmelanoma skin cancer in the United States, 2006.
Arch Dermatol, 146(3), pp.283–287.
Rogers, H.W., Coldiron, B.M., 2013, Analysis of skin
cancer treatment and costs in the United States
Medicare population, 1996-2008, Dermatol Surg, 39(1
Pt 1), pp.35-42.
Sforza, G., Castellano, G., Arika, S.K., Leander, R.W.,
Stanley, R.J., Stoecker, W.V., Hagerty, J.R., 2012,
Using adaptive thresholding and skewness correction
to detect gray areas in melanoma in situ images, IEEE
VISAPP 2017 - International Conference on Computer Vision Theory and Applications
122

Trans Instrum Meas, 61(7), pp. 1839–1847.
Shanbhag, A.G., 1994, Utilization of information measure
as a means of image thresholding, CVGIP: Graph
Models Image Proc, 56(5), pp.414-419.
Soyer, H.P., Argenziano, G., Hofmann-Wellenhof, R.,
Johr, R. (eds), 2007, Color Atlas of Melanocytic
Lesions of the Skin, Berlin, Germany: Springer Berlin
Heidelberg.
Steger, C., 1996, Extracting lines using differential
geometry and Gaussian smoothing, Int Arch
Photogrammetry Remote Sensing, 31, pp.821-826.
Stoecker, W.V., et al., 2009, Semitranslucency in
dermoscopic images of basal cell carcinoma, Arch
Dermatol, 145(2), pp.224.
Stoecker, W.V., Mishra, N., LeAnder, R., Rader, R.,
Stanley, R., 2013, Automatic Detection of Skin Cancer
– Current Status, Path for the Future, In: Proceedings
of the International Conference on Computer Vision
Theory and Applications, pp. 504-508. Available:
https://goo.gl/7o5JfY.
Stoecker, W.V., Mishra, N.K., Kaur, R., Kasmi, R., Cole,
J.G., Safron, A., Moss, R.H., Leander, B., Stanley,
R.J., Rabinovitz, H., Oliviero M., 2015, Automatic
Diagnosis of Basal Cell Carcinoma: Fusion of
Dermoscopic and Clinical Features, American
Academy of Dermatology Symposium, At Nob Hill
ABC, Marriott Marquis San Francisco San Francisco,
CA, USA.
Stolz, W. et al., 2002, Color Atlas of Dermatoscopy, 2nd
Edition, Berlin: Blackwell Science.
Tehrani, H. et al., 2007, Spectrophotometric
intracutaneous analysis in the diagnosis of basal cell
carcinoma: a pilot study, Int J Dermatol, 46(4),
pp.371-375.
Umbaugh, S.E., Moss, R.H., Stoecker, W.V., 1989,
Automatic color segmentation of images with
application to detection of variegated coloring in skin
tumors, Eng Med Biology Magazine IEEE, 8(4),
pp.43-50.
Umbaugh, S.E., 2010, Digital Image Processing and
Analysis: Human and Computer Vision Applications
with CVIPtools, Boca Raton FL, CRC press.
Won, Y. et al., 2007, Photodetection of basal cell
carcinoma using methyl 5-aminolaevulinate-induced
protoporphyrin IX based on fluorescence image
analysis, Clin Exp Dermatol, 32(4), pp.423-429.
Zeichner, J.A., Patel, R.V., Birge, M.B., 2011, Treatment
of Basal cell carcinoma with curettage followed by
imiquimod 3.75% cream, J Clin Aesthet Dermatol,
4(5), pp.39-43.
Zhang, J. et al., 2000, A feasibility study of multispectral
image analysis of skin tumors, Biomed Instrum
Technol, 34(4), pp.275-282.
Automatic Separation of Basal Cell Carcinoma from Benign Lesions in Dermoscopy Images with Border Thresholding Techniques
123
