
Understanding Jump Landing as an Oscillating System: A Model-based
Approach of Balance and Strength Analyses
Sandra Hellmers
1
, Sebastian Fudickar
1
, Lena Dasenbrock
2
, Andrea Heinks
2
, J
¨
urgen M. Bauer
3
and Andreas Hein
1
1
Assistive Systems and Medical Technologies, Carl von Ossietzky University Oldenburg, Oldenburg, Germany
2
Department of Geriatric Medicine, Carl von Ossietzky University Oldenburg, Oldenburg, Germany
3
Chair of Geriatric Medicine, Heidelberg University, Agaplesion Bethanien Hospital Heidelberg, Heidelberg, Germany
Keywords:
Force Platform, Counter Movement Jump, Vertical Jump, Balance, Strength, Geriatric Assessment, Jump
Landing, DPSI.
Abstract:
Counter movement jumps (CMJ) are well-suited to measure the muscle power and balance. Since it has been
clarified that well accepted CMJ amplification-based balance measures (such as TTS or CoP) are significantly
influenced by algorithmic, and measurement settings and thus, measurement results have limited meaning-
fulness among force platforms, we introduce a new model-based approach measuring the postural stability.
In this, during the landing and recovery phases after vertical jumps, the lower extremities can be represented
by an oscillating system and the corresponding transfer function is described by a second-order delay (PT2)
element.
In an initial prospective study with 20 subjects aged over 70 years, we observed an inverse relationship be-
tween the calculated parameter w and the jump height and could also identify an influence of sex, and body
weight on the jump height. Furthermore, we also found a relation between the parameter w and the dynamic
postural stability index (DPSI), even though these results must be ensured statistically using a larger cohort,
due to the current limited number of subjects.
Nevertheless, we could confirm the general applicability of the Systems and Control Technology perspective
on describing human movements in a potentially more robust manner than current amplification based ap-
proaches. Further investigations on our model and the oscillating behavior in the phase of landing are needed
to improve our system and to interpret the calculated parameters in a technical and physiological point of view.
1 INTRODUCTION
Geriatric assessments are well-established instru-
ments to identify early changes associated with func-
tional and cognitive decline, as they can occur in com-
mon geriatric syndromes, such as frailty or sarcopenia
(Clegg et al., 2013; Cruz-Jentoft et al., 2010; Elsawy
and Higgins, 2011). Thus, the assessments gain in-
creasing relevance with the ongoing age-related de-
mographic shift. Therefore, it exists a strong research
interest to identify degrading abilities very early in
geriatric assessments or with technical monitoring
systems (Hein et al., 2010; Fudickar et al., 2012), like
for example with systems in domestic environments
to identify changes in the user behavior (Steen et al.,
2013), to trigger preventive measures.
Nevertheless, for a self-determined healthy life
and low fall risk, functional abilities and physical fit-
ness are fundamental for healthy aging. Muscular
strength of the lower extremities, balance, and en-
durance are essential factors (Granacher et al., 2013)
for the fall risk, frailty, and sarcopenia.
Due to the relevance of muscular strength of the
lower extremities, postural stability, and endurance,
these factors are covered by various standardized as-
sessments and tests (see Table 1). Most of these
assessments and tests consist of several assessment
items. For example, the Short Physical Performance
Battery (SPPB) consists of a walk test, a static balance
test, and the chair rising test and can cover strength
and balance only in the combination of the assessment
items. Consequently, among the common assess-
ments, only the Counter Movement Jump (CMJ) is
well-suited to test both components, strength, and bal-
ance within a single item. In detail, the CMJ allows to
measure postural stability (balance) (Granacher et al.,
Hellmers S., Fudickar S., Dasenbrock L., Heinks A., Bauer J. and Hein A.
Understanding Jump Landing as an Oscillating System: A Model-based Approach of Balance and Strength Analyses.
DOI: 10.5220/0006171101590168
In Proceedings of the 10th International Joint Conference on Biomedical Engineering Systems and Technologies (BIOSTEC 2017), pages 159-168
ISBN: 978-989-758-213-4
Copyright
c
2017 by SCITEPRESS – Science and Technology Publications, Lda. All rights reserved
159

Table 1: Selection of assessment items in our geriatric study (Hellmers et al., 2016), their test duration, and classification
regarding the components of physical fitness (- none, + to +++ increasing significance). The test durations are based on
literature and estimated on own experiences (*) in a study with 250 participants. The values in brackets are the durations with
introduction and instructions or a test jump.
Geriatric Assessments Balance Strength Endurance Test Duration
de Morton Mobility Index ++ - - 9 min
-static balance ++ - -
-dynamic balance ++ - -
Short Physical Performance Battery ++ ++ - 15 min
-static balance ++ - -
-chair rise test - ++ -
Frailty Index - ++ - 10-17 min
∗
-grip strength - ++ - 3-5 min
Stair Climb Power Test - ++ - 2-(5) min
∗
6 Minute Walk Test - + ++ 6 min
Counter Movement Jump ++ ++ - 5-(6) min
∗
2013) via the time to stability (TTS) during the land-
ing and stabilization phase and muscle performance
of the lower extremities (strength) via muscle power
ahead of jumps (Buehring et al., 2015; Rittweger
et al., 2004; Dietzel et al., 2015; Kalyani et al., 2014).
The assessment of patients’ functional status for
balance and muscle strength through a single test
item instead of several tests lowers costs and personal
efforts (supporting an increased assessment density)
and can reduce stress and potential fatigue for pa-
tients, which hold the risk that assessments results
lose significance (Siglinsky et al., 2015). Conse-
quently, the CMJ is a well-suited assessment item to
cover both muscle strength of the lower extremities
and postural stability.
However, since relying just on the force ampli-
fication, current CMJ-based balance measures (such
as COP and TTS) have been shown to be signifi-
cantly prone to algorithmic and technical variations
thus have limited viability regarding the generaliza-
tion of classification and measurements.
Thus, we propose a robust approach to measure
postural stability based on the natural frequencies dur-
ing the landing and recovery phase of CMJs and eval-
uate its practicability for 20 subjects with an age of 71
to 82 years.
2 COUNTER MOVEMENT JUMP
Within this section, the characteristics of CMJs are
discussed and are followed by a description of the
technically supported measurement of ground reac-
tion forces.
2.1 Biomechanical Characteristics
Counter movement jumps (CMJs) are vertical jumps
that are performed from standing, and according to
(Palma et al., 2008) consist of the following phases
(as shown in Figure 1): In the first phase (a) the par-
ticipant is standing. Phase (b) is characterized by the
preparation (b) with a downward movement by the
flexion of the knees and hips, followed by an imme-
diate and impulsive extension of the knees and hips
again to jump vertically up and take-off (c) and flight
(d). At the end of the jump, a stage of landing (e) with
the absorption of the forces of the impact, and a stage
of recovery (f) of the balance can be identified, fol-
lowed by a standing phase after compensation of the
forces (a).
Figure 1: Counter movement jump and its separate phases:
standing (a), preparation (b), take-off (c), flight (d), landing
(e), and recovery (f). The marks indicate the participant’s
center of mass in each jump phase.
2.2 Common Technical Measurements
via Force Platforms
Since pure observational evaluations are difficult, due
to the fast progress of a jump, analyses are typi-
HEALTHINF 2017 - 10th International Conference on Health Informatics
160
cally technology supported via force platforms, con-
tact mats or optical systems (Bui et al., 2015). Force
platforms measure the ground reaction force intensity
and distribution.
Due to the specific force distribution characteris-
tics, the phases of a CMJ can be identified by varia-
tions of the ground force (if measured by ground force
reaction platforms or similar devices), as shown ex-
emplarily in Figure 2 and discussed in the following:
The transition from standing or rest (a) to preparation
(b) can be clearly recognized by changes in the ampli-
tudes of the force, which was nearly constant during
the standing phase. Take-off (c) is characterized by
the decrease of force affecting on the platform. Dur-
ing the flight phase (d), the force amounts to zero. In
the moment of landing (e), the force increases to a
maximum. In the phase of recovery (f), the subject
tries to compensate the forces, in order to enter the
phase of standing or resting (a) again.
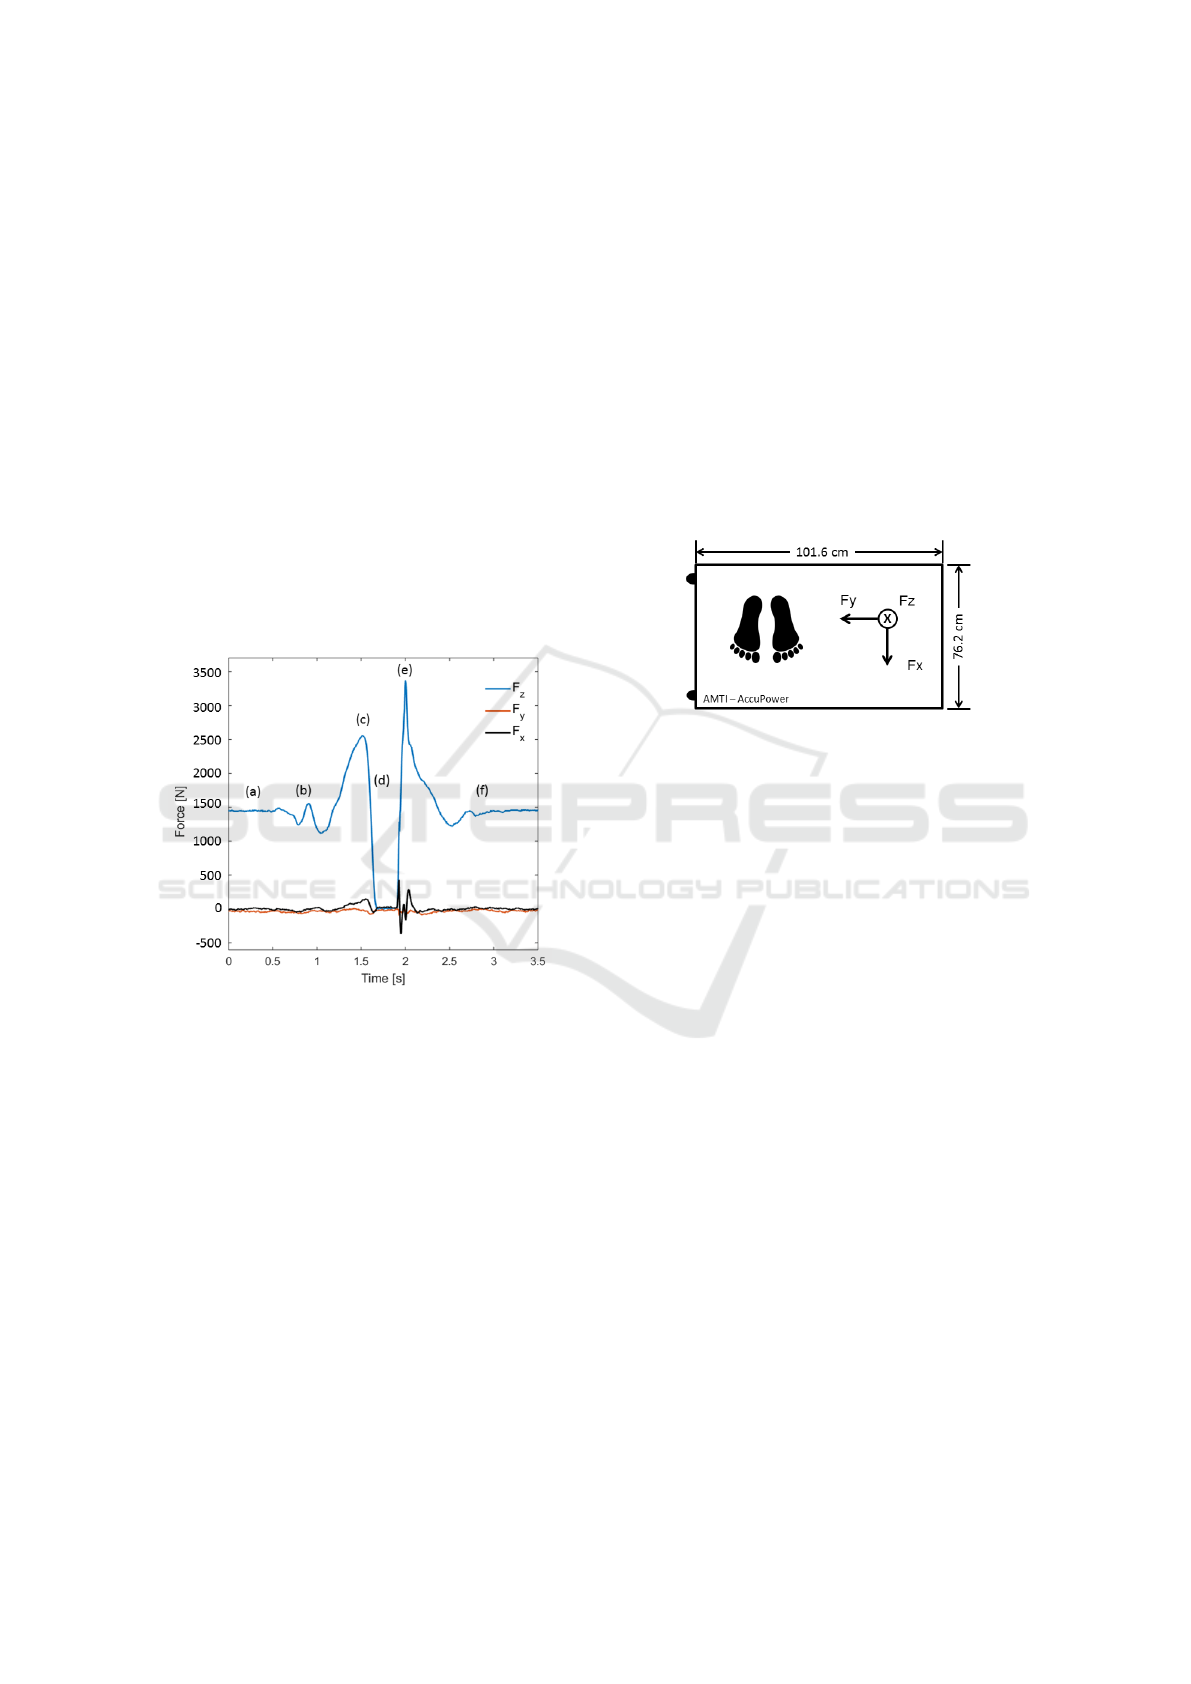
Figure 2: Variations over time of force intensities per axis
during a counter movement jump. The force was measured
by a force platform. The phases of the counter movement
jump are marked in the graph: standing (a), preparation (b),
take-off (c), flight (d), landing (e), and recovery (f).
Figure 3 shows the coordinate orientation of the
force platform. It is clear that the mean force acts per-
pendicular to the force plate in the vertical (z) direc-
tion. But there are also reaction forces in the medio-
lateral (y) and especially in the anteroposterior (x) di-
rection. In the anteroposterior direction is a peak dur-
ing the take-off phase pushing the feet off the ground,
and during the landing while the toes and heels strike
the ground and compensate the movements.
Force platforms can estimate power, velocity and
the related jump height (Samozino et al., 2008). The
physical relationships between the measured force
and the power, as well as the jump height, is shown
in Section 3. The peak force measurements during
the preparation and take-off phases e.g. of CMJs are,
as long as being considered relative to the body mass,
significantly related to muscle strength (Nuzzo et al.,
2008; Markovic et al., 2014). The strength can be an-
alyzed by the take-off phase of the jump, and the bal-
ance was shown to be estimated based on the force-
intensities and distributions during the landing and
recovery phase of jumps. For example, the time to
stabilization (TTS) is the time it takes for an individ-
ual to return to a stable state following a jump or hop
landing, and it is a used factor for balance analyses.
Thereby, a longer TTS indicates more difficulty con-
trolling the posture of landing and might indicate im-
paired neuromuscular control (Fransz et al., 2015).
Figure 3: The dimensions of the used AccuPower ground
reaction force platform of AMTI with its coordinate orien-
tation. The footprint symbolizes the orientation of the sub-
jects during the jumps.
3 STATE OF THE ART
The jump power, as an indicator of muscle strength,
can be identified by the force measurements during
the vertical jump, especially in the phase of the take-
off.
Force plates measure the force acting on the plate.
According to Newton’s second law, the force F is
equal to the mass m of an object times its accelera-
tion a.
F = m ·a (1)
In the example of Figure 2, we can clearly see the in-
fluence of the mass of the jumper on the force F
z
act-
ing perpendicular to the surface of the plate. The off-
set at rest amounts about 1500 N, which corresponds
approximately to a mass of 150kg.
The power P is defined by the force F times the
velocity v:
P = F · v (2)
In many studies, the maximum jump power is ob-
served and seems to be a sensitive indicator of the
muscle performance and the strength (Dietzel et al.,
2015; Kalyani et al., 2014).
Understanding Jump Landing as an Oscillating System: A Model-based Approach of Balance and Strength Analyses
161

A further important parameter for jump analyses
is the jump height. The jump height h can be esti-
mated by the following equation:
h = (v
t
·t)−
1
2
· g ·t
2
, (3)
where v
t
is the vertical velocity of the center of mass
of the jumper at take-off, t is the time to peak flight
and g the gravity.
Besides measuring muscle strength, force plat-
forms can be utilized to measure dynamic postu-
ral stability, which has been shown as related to
balance and ankle stabilities. Therefore, functional
deficits such as chronic functional ankle instability
(FAI) (Hertel, 2002), can be indicated based on the
recorded vertical, anteroposterior or mediolateral re-
action forces, which enable the calculation of time
to stabilization (TTS) and variations over time of the
center of pressure (COP), range of motion (ROM),
and the dynamic postural stability index (DPSI) as ac-
cepted measures for postural stability and FAI. The
DPSI is at least as accurate and precise as TTS but
provides a comprehensive measurement of dynamic
postural stability that is sensitive to change in 3 direc-
tions.
DPSI provides a comprehensive measurement of
dynamic postural stability that is sensitive to change
in all directions since combining three (vertical, an-
teroposterior and mediolateral) stability indexes and
considers as well the subject’s weight for the vertical
stability and thus has been shown to be a reliable mea-
sure (Wikstrom et al., 2005b; Meardon et al., 2016).
While COP and ROM have shown mixed correlations
to FAI stabilities, TTS is a well-accepted measure to
quantify performance. Typically, the force is con-
sidered in order to measure the TTS, as a measure
of the ability to stabilize posture (which is applied
within numerous studies). TTS typically ranges from
0 to 7s. By investigating 20 TTS calculation meth-
ods (as identified via a structured literature review),
Fransz et al. (Fransz et al., 2015) have shown that all
use threshold-based approaches based on the ground
force and 90% can be described based on four aspects:
(1) the input signal, (2) signal processing, (3) the sta-
ble state (threshold), and (4) the definition of when
the (processed) signal is considered stable.
Wikstrom et al. identified a significant variabil-
ity among TTS measurements due to differences be-
tween the TTS calculation methods used in various
studies (Wikstrom et al., 2005a). By evaluating the in-
fluences of parameter variations, Fransz et al. (Fransz
et al., 2015) have indicated that the TTS measure does
produce non-standardized parameters if estimated via
ground forces reaction parameter. They indicated
variations of the TTS of up to 56% for sample rate
(100 to 1000 Hz), 37% for filter settings (no filter, 40,
15 or 10 Hz), 28-282% for trial lengths (20, 14, 10, 7,
5 and 3 s), as well as calculation methods. Thereby
they clarified the difficulties to compare TTS results
recorded among different systems based on the power
measure.
While these analyses are performed based on sin-
gle jump measurements for 25 healthy younger adults
(20-53 years), its insights will generally apply due to
the indicated computational differences and the dras-
tic effect sizes.
Consequently, alternative measures are desired,
which are more robust regarding measurement-
variations such as sample rates.
Ideally, these measures should be equally appli-
cable to rather mobile measurement devices such as
inertial measurement units (IMU), which will be in-
creasingly applied due to their lower price and the
higher grade of mobility (Choukou et al., 2014; Elvin
et al., 2007; Milosevic and Farella, 2015).
4 SYSTEMS AND CONTROL
TECHNOLOGY
Considering the situation, that a system is stimulated
by an action (input signal). Usually, the system re-
acts on this stimulation in any manner (output signal).
Now we want to describe this system to predict the
reaction of the system to an action. In the systems
and control technology the relation of an input and
an output function, and therefore, the system can be
described by a transfer function (see Figure 4).
Figure 4: Relation between the output function Y (s), the
transfer function H(s) and F(s) the input function.
The mathematical relation is given by:
Y (s) = H(s)F(s), (4)
where Y (s) is the output function, H(s) the transfer
function and F(s) the input function. If assuming,
that the landing and recovery phase of a vertical jump
(Figure 2 (e)) is an oscillating system, the transfer
function is described by a second-order delay element
(PT2-element).
H(s) =
Y (s)
F(s)
=
a
cs
2
+ bs + 1
(5)
HEALTHINF 2017 - 10th International Conference on Health Informatics
162

Considering the general second-order system of an
oscillator H(s) can be described by
H(s) =
Kω
0
s
2
+ 2Dω
0
s + ω
2
0
, (6)
where ω
0
is the natural frequency, K the DC gain
of the system and D the damping ratio. It is as-
sumed, that the error resulting from the use of the
time-continuous model is small, because of a rela-
tively high sampling ratio of 200 Hz. The natural
frequency determines how fast the system oscillates
during the response. The damping ratio determines
how much the system oscillates as the response de-
cays toward a steady state. These parameters can be
deduced from equation 6, after transferring it in the
form of equation 5:
H(s) =
k
(
s
2
ω
2
0
+
2Ds
ω
0
+ 1)
(7)
ω
0
=
r
1
c
and D =
bω
0
2
(8)
Therefore, the natural frequency and the damping ra-
tio can characterize the landing phase, the absorption
of the impact, and the restoring of the balance and
stability. As we will see in the next section, these
parameters might be an alternative possibility to char-
acterize the balance ability, the muscle strength, and
allow conclusions to postural stabilization and neuro-
muscular control.
5 MODEL-BASED APPROACH
We propose the use of the oscillation behavior
as an alternative approach to drawing conclusions
about muscle strength, balance ability, postural sta-
bility, and neuromuscular control instead of using
the DPSI, TTS, COP or ROM. The advantage of
the model-based approach of the oscillation behav-
ior (during landing and recovery phase) over existing
amplification-based methods might be its potentially
lower dependability on sample rates, and trial lengths.
In detail, we aim to model (as schematically illus-
trated in Figure 5) the human’s lower extremities as a
spring that oscillates during the landing and recovery
phase. During free fall the spring is slack and will be
compressed at the impact on the floor and the landing
phase and depresses during the recovery phase to the
steady state in one or more oscillations.
From a physical point of view, this system can be
described by
F = −kx, (9)
Figure 5: Comparing of the human’s lower extremities with
a spring during the landing and the recovery phase of a
jump. The spring will be compressed during the landing
(e-e1) and depresses during the recovery phase (f-f1) to the
steady state in one or more oscillations.
with the force F, the displacement x and the spring
constant k. The frequency can be estimated with
ω
0
=
p
k/m. (10)
This equation shows that the frequency correlates to
the spring constant k.
In our model, the spring is characterized by the
spring constant. Consequently, if comparing the
spring with the muscles of the humans’ lower extrem-
ities, the spring constant characterizes the stiffness of
the muscles in a first approximation. Therefore, the
natural frequency ω
0
of our system describes the abil-
ity to absorb the impact at the landing and character-
izes the muscles of the lower extremities.
The damping ratio D indicates the influence
within or upon an oscillatory system that has the ef-
fect of reducing its oscillations and might also be a
relevant parameter for the characterization of the bal-
ance ability and the postural stability.
6 EVALUATION
6.1 Study Design
Each of the 20 considered healthy older adults of
our study (12 subjects are female (60%) and 8 male
(40%)) has performed three sequential CMJs with a
rest of 1 min between the jumps to avoid signs of fa-
tigue. Further characteristics of the subjects are listed
in Table 2. The group covers a typical range of age,
weight, and height for the group of pre-frail elderlies.
The test procedures were approved by the local ethics
committee (ethical vote: Hannover Medical School
No. 6948) and conducted in accordance with the Dec-
laration of Helsinki.
Understanding Jump Landing as an Oscillating System: A Model-based Approach of Balance and Strength Analyses
163

Table 2: Population characteristics of our study with the
minimum (min.), maximum (max.), mean values and stan-
dard deviation (SD).
n=20 min. max. mean SD
age [years] 71 82 75.1 3.02
weight [kg] 51.6 97.25 74.87 12.49
height [cm] 154.1 189.1 167.25 9.92
The jumps have been performed on an AMTI Ac-
cuPower ground reaction force plate, which is spec-
ified for jumping and power analyses and is an ac-
cepted gold standard. Figure 3 shows the coordinate
orientation and the dimensions of the plate. The sam-
pling rate amounts 200Hz. The AccuPower sensitiv-
ity is based on a 8900 N full-scale F
z
capacity and a
12 bit internal AD (±2048 bit) or about 4.3 N/bit.
The transfer functions and FPE (as describing the
transfer functions fit) have been estimated for each (of
the 3x20) performed CMJs with Mathworks’ MAT-
LAB (version R2015a) using the System Identifica-
tion Toolbox (version 9.2).
Per subject, the jump with the best fit estimation
was taken into account in our analyses, whereby fits
below 70% are rejected. Thereby, the function for the
fit corresponds to the form of equation 5. An impulse
function with the height of the impact force at landing
will be assumed for the input signal. Figure 6 shows
a typical input function.
Figure 7 shows a characteristic phase of landing
and recovery and is assumed as an output function.
To take the force in all directions into account, the
absolute values for each axis are summed up. In the
step of reprocessing the means are removed. In accor-
dance with the theoretical considerations of Section 4,
the number of poles is set to 2 and the number of zeros
to 0 for the model of the transfer function, to describe
an oscillating system (see equation 6). A discrete-
time spectrum with T=0.005 s is chosen, because of
the sampling rate of 200 Hz of the force plate.
6.2 Natural Frequency and Damping
Ratio
The natural frequency ω
0
and damping ratio D were
determined as described in section 4. The results
for the natural frequency are in the range of about
1Hz. Due to the literature, we expected higher fre-
quencies (Wakeling et al., 2001). The analyze of the
poles of the poles of the determined transfer functions
show that there are only two real poles, which indicate
a non-oscillating function instead of complex pole
pairs, which lead to exponentially modulated oscilla-
tions. Consequently, the calculated parameter (called
Figure 6: Typical impulse function as an input function.
Figure 7: Typical phase of landing and recovery as an output
function. The dashed line indicates the previous progress of
the force during the flight phase.
w) is not equivalent to the natural frequency ω
0
and
describes rather a damping factor. Nevertheless, the
parameter w seems to be significant: Figure 8 shows
the parameter w in relation to the jump height h. A
linear regression results in
d = −0.0013 · h + 1 (11)
The relation shows an inverse relationship between
these parameters. Therefore, the parameter w de-
creases with an increasing jump height.
Figure 9 shows the relation between jumping
height and the calculated parameter d for the damp-
ing ratio D. Within the study group, the parameter
d’s effect size is small, since varying only in a small
range. As an approximative assumption, the damping
is linearized. Hence, an inverse relationship between
the jumping height and the damping ratio was also
recognized. The relation is not significant, due to the
small effect size. It needs further investigations via
data of both larger cohorts and heterogeneous groups,
and additionally if the parameter d is equivalent to the
damping ratio D.
HEALTHINF 2017 - 10th International Conference on Health Informatics
164
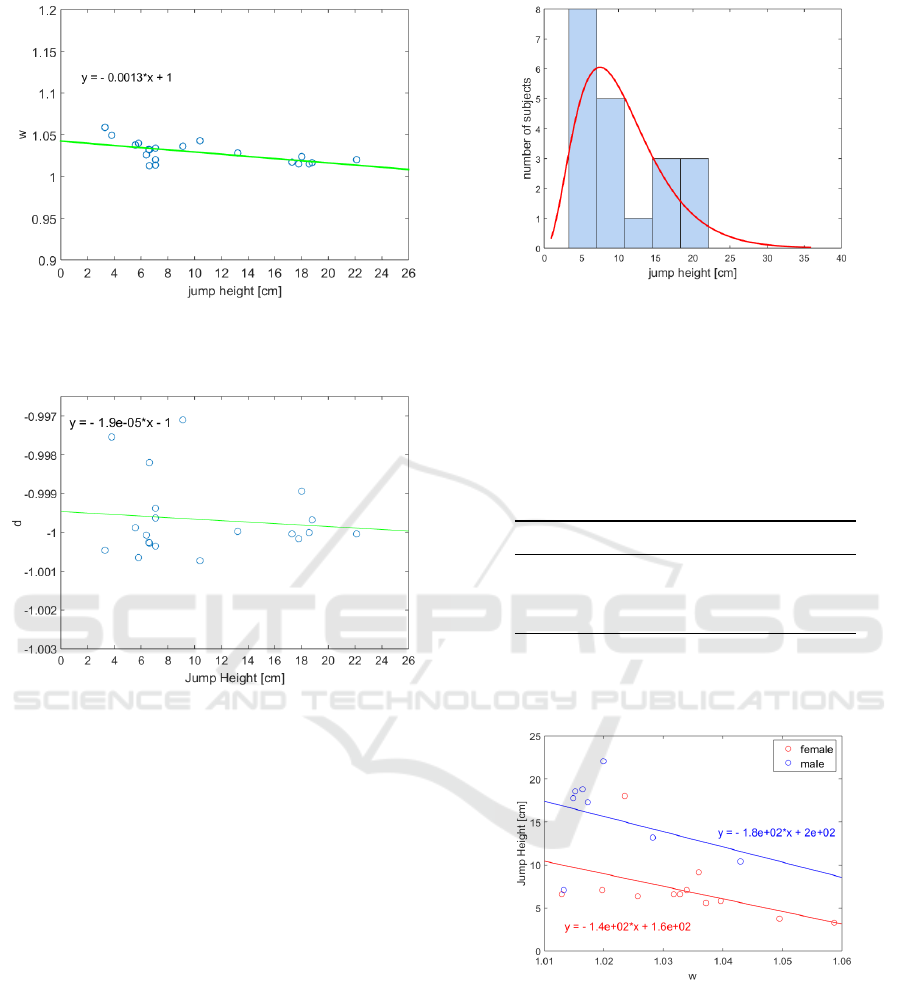
Figure 8: The parameter w is shown in relation to the jump
height h. There is an inverse relationship between this pa-
rameter and the jump height.
Figure 9: The estimated parameter d is shown in relation to
the jump height h. The variation of this parameter lies only
in a small range.
6.3 Major Factors of Influence
Due to the fact, that several factors can influence the
parameters w and d, we analyzed the influence of the
age, the sex, the body weight, the body height, w and
d as a function of the jump height.
Therefore we used a generalized regression
model. Due to the left skewed distribution of jump
height (see Figure (10)) we estimated a gamma-
distribution. Considering the jump height as clearly
observable element, we performed a stepwise model
selection by the Akaike information criterion (AIC).
The results of the regression analyses are listed in
Table 3. As mentioned in Section 6.2 the parameter
d varies only in a small range and is not significant.
Also, the body height has no influence on the jumping
height. But we can see a small influence of the body
weight and an influence of the sex and the parameter
w.
Table 3 shows the changes of the jump height for a
Figure 10: Distribution of the jump height and the estimated
gamma-distribution (red line).
one unit change of the listed parameters. For example,
the sex has an influence of about 7cm. The change of
0.01 unit of w results in a mean change of 1.5 cm of
jump height.
Table 3: Influence of weight, sex, and w depending on the
jump height.
Estimation SD p(> |t|)
w -152.20 43.02 <0.01
weight -0.073 0.04 0.08
sex -7.34 1.95 <0.01
Figure 11 illustrates the differences between male
and female subjects in jump height as a function of w.
Figure 11: Comparison of the jump height as a function of
w of male and female subjects.
Considering equation 10 in Section 5 and the sim-
plified comparison of a human as a spring, the natural
frequency increases with increasing spring constant
and therefore increasing stiffness. On the assumption
that the jump height h corresponds with the muscle
strength S, there seems to be a relationship between
jump height, the paramter w, muscle strength, and
spring constant k:
Understanding Jump Landing as an Oscillating System: A Model-based Approach of Balance and Strength Analyses
165
h ∼ S ∼
1
w
∼
1
ω
0
∼
1
k
. (12)
Thus, our model explains the inverse relation between
jump height and the parameter w.
In order to analyze the postural stability, the dy-
namic postural stability index (DPSI) was determined
in accordance with the approach of (Wikstrom et al.,
2005b) by equation 13.
DPSI =
r
∑
(0 − F
x
)
2
+
∑
(0 − F
y
)
2
+
∑
(m − F
z
)
2
n
,
(13)
where F
x
, F
y
, F
z
are the forces in anteroposterior
(x), mediolateral (y) and vertical(z) direction, m the
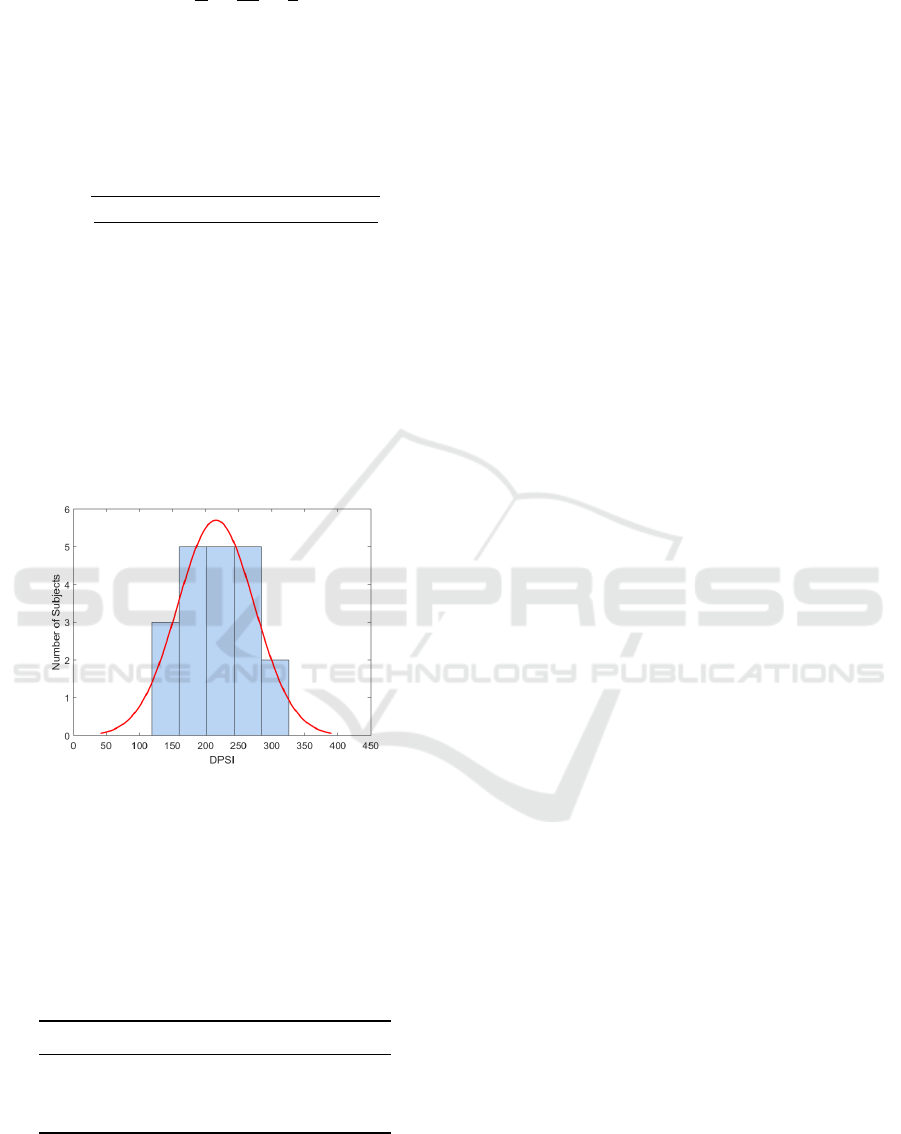
body weight, and n the number of data points. Fig-
ure 12 shows the resulting distribution of the DPSI
over the considered CMJs of our study population.
Next to the normal distribution of the DPSI values and
the distribution-range (in relation to other age-related
groups such as in (Wikstrom et al., 2005b; Meardon
et al., 2016)) confirms the suitability of the DPSI for
the considered group.
Figure 12: Distribution of the DPSI over our study popula-
tion with a normal distribution fit.
In order to investigate the relation between w
and postural stability (represented by the DPSI), we
also analyzed the influence of the factors age, body
weight, and w as a function of the DPSI. Table 4 lists
the results.
Table 4: Influence of weight, sex and w depending on the
DPSI.
Estimation SD p(> |t|)
w -1244.73 791.75 0.14
weight 2.25 0.816 0.01
age 7.71 3.37 0.04
We found an influence of these factors on the
DPSI: For example, a change of 0.01 units in w re-
sults in a change of 12 of the DPSI-value. A change in
the age of 10 years causes a change of 77 of the value
of DPSI. While a significant correlation of the weight
and age with the DPSI was found, the strong influ-
ence of w (indicated by an estimate of 1244.73, which
is 161 times stronger than for age, the next strongest
estimate) could not yet be statistically ensured due to
the low number of subjects (n=20). Consequently, we
are looking forward to confirming the expected signif-
icant correlation in an upcoming analysis with a larger
study group.
7 CONCLUSION
While the CMJ is well-suited to measure muscle
power and strength within a single assessment item,
common traditional amplification-based balance mea-
sures for CMJ (such as TTS or CoP) have been shown
to be significantly influenced by measurement set-
tings including trial length, sample rate, and filter set-
tings. Thus, a reliable alternative approach to detect
balance ability for vertical jumps is required.
As an alternative approach, we propose to model
the human body during the landing after a jump
from a Systems and Control Technology perspective.
Therefore, we used an impulse function of the maxi-
mum force at the impact on the ground as input func-
tion and the landing and recovery phase of a jump as
output function. This phase is characterized by the
balance and muscle strength of a subject.
Since the landing and recovery phase of vertical
jumps can be represented by an oscillating system,
the transfer function is described by a second-order
delay element (PT2-element), where the natural fre-
quency determines the systems oscillation frequency,
and the damping ratio determines the system oscilla-
tion intensity as the response decays towards a steady
state.
In an initial prospective study with 20 elderly
probands, we could not observe the expected oscillat-
ing behavior in the phase of landing. Nevertheless, an
inverse relationship between the calculated parameter
w and the jump height and an inverse relation to the
muscle strength could be determined. We could iden-
tify an influence of sex, weight, and w on the jump
height.
Furthermore, a potential correlation between
DPSI (as a common standard-index for balance) and
w was seen but could not be clearly clarified due to
the limited group size. Thus, we will investigate these
effects in a further larger study.
Moreover, we considered in our model only
one dynamic mode (one modal mass and one fre-
quency). Using two-dimensional models of the mus-
HEALTHINF 2017 - 10th International Conference on Health Informatics
166

culoskeletal system (Blache and Monteil, 2013) or
even an anatomically realistic three-dimensional mus-
culoskeletal model (Farahani et al., 2016) could open
perspectives for more robust models.
ACKNOWLEDGEMENTS
The study is funded by the German Federal
Ministry of Education and Research (Project No.
01EL1422D). We would also like to thank Dr. Fabian
Sobotka for his support.
REFERENCES
Blache, Y. and Monteil, K. (2013). Effect of arm swing
on effective energy during vertical jumping: experi-
mental and simulation study. Scandinavian Journal of
Medicine & Science in Sports, 23(2):e121–e129.
Buehring, B., Krueger, D., Fidler, E., Gangnon, R., Heider-
scheit, B., and Binkley, N. (2015). Reproducibility of
jumping mechanography and traditional measures of
physical and muscle function in older adults. Osteo-
porosis International, 26(2):819–825.
Bui, H. T., Farinas, M.-I., Fortin, A.-M., Comtois, A.-
S., and Leone, M. (2015). Comparison and analysis
of three different methods to evaluate vertical jump
height. Clinical Physiology and Functional Imaging,
35(3):203–209.
Choukou, M.-A., Laffaye, G., and Taiar, R. (2014). Re-
liability and validity of an accelerometric system for
assessing vertical jumping performance. Biology of
Sport, 31(1):55.
Clegg, A., Young, J., Iliffe, S., Rikkert, M. O., and Rock-
wood, K. (2013). Frailty in elderly people. The
Lancet, 381(9868):752–762.
Cruz-Jentoft, A. J., Baeyens, J. P., Bauer, J. M., Boirie, Y.,
Cederholm, T., Landi, F., Martin, F. C., Michel, J.-P.,
Rolland, Y., Schneider, S. M., et al. (2010). Sarcope-
nia: European consensus on definition and diagnosis
report of the european working group on sarcopenia
in older people. Age and Ageing, 39:412423.
Dietzel, R., Felsenberg, D., and Armbrecht, G. (2015).
Mechanography performance tests and their associa-
tion with sarcopenia, falls and impairment in the ac-
tivities of daily living-a pilot cross-sectional study in
293 older adults. Journal of Musculoskeletal and Neu-
ronal Interactions, 15(3):249–256.
Elsawy, B. and Higgins, K. E. (2011). The geriatric assess-
ment. American Family Physician, 83(1):48–56.
Elvin, N. G., Elvin, A. A., and Arnoczky, S. P. (2007).
Correlation between ground reaction force and tibial
acceleration in vertical jumping. Journal of Applied
Biomechanics, 23(3):180.
Farahani, S. D., Andersen, M. S., de Zee, M., and Ras-
mussen, J. (2016). Optimization-based dynamic pre-
diction of kinematic and kinetic patterns for a human
vertical jump from a squatting position. Multibody
System Dynamics, 36(1):37–65.
Fransz, D. P., Huurnink, A., de Boode, V. A., Kingma, I.,
and van Die
¨
en, J. H. (2015). Time to stabilization
in single leg drop jump landings: An examination of
calculation methods and assessment of differences in
sample rate, filter settings and trial length on outcome
values. Gait & Posture, 41(1):63–69.
Fudickar, S., Karth, C., Mahr, P., and Schnor, B. (2012).
Fall-detection simulator for accelerometers with in-
hardware preprocessing. In Proceedings of the 5th
International Conference on Pervasive Technologies
Related to Assistive Environments, page 41. ACM.
Granacher, U., Gollhofer, A., Hortob
´
agyi, T., Kressig,
R. W., and Muehlbauer, T. (2013). The importance
of trunk muscle strength for balance, functional per-
formance, and fall prevention in seniors: A systematic
review. Sports Medicine, 43(7):627–641.
Hein, A., Winkelbach, S., Martens, B., Wilken, O., Eichel-
berg, M., Spehr, J., Gietzelt, M., Wolf, K.-H.,
B
¨
usching, F., H
¨
ulsken-Giesler, M., et al. (2010). Mon-
itoring systems for the support of home care. Infor-
matics for Health and Social Care, 35(3-4):157–176.
Hellmers, S., Fudickar, S., B
¨
use, C., Dasenbrock, L.,
Heinks, A., Bauer, J. M., and Hein, A. (2016). Tech-
nology supported geriatric assessment. In Ambient As-
sisted Living. Springer. (in press).
Hertel, J. (2002). Functional anatomy, pathomechanics, and
pathophysiology of lateral ankle instability. Journal of
Athletic Training, 37(4):364.
Kalyani, R. R., Corriere, M., and Ferrucci, L. (2014). Age-
related and disease-related muscle loss: the effect of
diabetes, obesity, and other diseases. The Lancet Dia-
betes & Endocrinology, 2(10):819–829.
Markovic, S., Mirkov, D. M., Nedeljkovic, A., and Jaric,
S. (2014). Body size and countermovement depth
confound relationship between muscle power output
and jumping performance. Human Movement Science,
33:203–210.
Meardon, S., Klusendorf, A., and Kernozek, T. (2016). In-
fluence of injury on dynamic postural control in run-
ners. International Journal of Sports Physical Ther-
apy, 11(3):366.
Milosevic, B. and Farella, E. (2015). Wearable inertial sen-
sor for jump performance analysis. In Proceedings of
the 2015 Workshop on Wearable Systems and Appli-
cations, pages 15–20.
Nuzzo, J. L., McBride, J. M., Cormie, P., and McCaulley,
G. O. (2008). Relationship between countermovement
jump performance and multijoint isometric and dy-
namic tests of strength. The Journal of Strength &
Conditioning Research, 22(3):699–707.
Palma, S., Silva, H., Gamboa, H., and Mil-Homens, P.
(2008). Standing jump loft time measurement-an ac-
celeration based method. In Biosignals (2), pages
393–396.
Rittweger, J., Schiessl, H., Felsenberg, D., and Runge, M.
(2004). Reproducibility of the jumping mechanogra-
phy as a test of mechanical power output in physically
competent adult and elderly subjects. Journal of the
American Geriatrics Society, 52(1):128–131.
Understanding Jump Landing as an Oscillating System: A Model-based Approach of Balance and Strength Analyses
167

Samozino, P., Morin, J.-B., Hintzy, F., and Belli, A. (2008).
A simple method for measuring force, velocity and
power output during squat jump. Journal of Biome-
chanics, 41(14):2940–2945.
Siglinsky, E., Krueger, D., Ward, R. E., Caserotti, P.,
Strotmeyer, E. S., Harris, T. B., Binkley, N., and
Buehring, B. (2015). Effect of age and sex on jumping
mechanography and other measures of muscle mass
and function. Journal of Musculoskeletal & Neuronal
Interactions, 15(4):301.
Steen, E.-E., Frenken, T., Eichelberg, M., Frenken, M., and
Hein, A. (2013). Modeling individual healthy behav-
ior using home automation sensor data: Results from a
field trial. Journal of Ambient Intelligence and Smart
Environments, 5(5):503–523.
Wakeling, J. M., Von Tscharner, V., Nigg, B. M., and Ster-
giou, P. (2001). Muscle activity in the leg is tuned in
response to ground reaction forces. Journal of Applied
Physiology, 91(3):1307–1317.
Wikstrom, E., Tillman, M., and Borsa, P. (2005a). Detec-
tion of dynamic stability deficits in subjects with func-
tional ankle instability. Medicine & Science in Sports
& Exercise, 37(2):169–175.
Wikstrom, E., Tillman, M., Smith, A., and Borsa, P.
(2005b). A new force-plate technology measure of
dynamic postural stability: the dynamic postural sta-
bility index. Journal of Athletic Training, 40(4):305–
309.
HEALTHINF 2017 - 10th International Conference on Health Informatics
168
