
Evaluation of a Dental Caries Clinical Decision Support System
Michel Bessani
1
, Daniel Rodrigues de Lima
1
, Emery Cleiton Cabral Correia Lins
2
and Carlos Dias Maciel
1
1
Department of Electrical and Computer Engineering, University of S
˜
ao Paulo, S
˜
ao Carlos, S
˜
ao Paulo, Brazil
2
Department of Biomedical Engineering, Federal University of Pernambuco, Recife, Brazil
Keywords:
Clinical Decision Support System, Dental Caries Management, Bayesian Networks, Decision Support System
Evaluation.
Abstract:
Decision Support Systems (DSSs) aims to support professionals decision process. A specific area of ap-
plication is the Clinical one, resulting in Clinical Decision Support Systems (CDSSs), focusing on Clinical
Decision problems, like oncology, geriatrics, and dentistry. DSSs integrate expert knowledge through pattern-
based approaches. Bayesian Networks are probabilistic graph models that allow representation and inference
on complex scenarios. BNs are used in different decision-making fields, e.g., Clinical Decision Support Sys-
tems. Traditionally, such models are learned using established databases. However, in situations where such
data set is unavailable, the BN can be manually constructed converting expert knowledge in conditional prob-
abilities. In this paper, we evaluate a Dental Caries Clinical Decision Support System which uses a BN to
provide suggestions and represent clinical patterns. The evaluation methodology uses forward sampling to
generated data from the BN. The generated data are separated into three groups, and each one is analyzed.
The results show the certainty of the Bayesian Network for some scenarios. The analysis of the CDSS BN
indicates that the system efficiently infers according to the pattern presented in the literature.
1 INTRODUCTION
Decision Support Systems (DSSs) are a set of com-
putational tools to provide information for support-
ing decision-making (Power et al., 2015). Ex-
pert knowledge-driven systems, are a type of DSSs,
that derive solutions for stated problems (Desh-
pande et al., 2016) by integrating “expert knowl-
edge through pattern-based approaches” (Hogen-
boom et al., 2016).
Among the DSSs, exists the specific area of Clin-
ical DSSs (CDSSs) (Berner, 2007), which aims to
assist health professionals in diagnosis and the over-
all clinical process (Castaneda et al., 2015). Exam-
ples are present in different health areas, as oncology
(Lambin et al., 2013; Sesen et al., 2013), geriatrics
(Genes et al., 2016) and dentistry (Goh et al., 2016).
A CDSS usually displays a rank or probability for
each suggestion (Berner, 2007), which helps the clin-
ician decision-making process. A previous study de-
veloped a CDSS with Bayesian Networks (BNs) for
dental caries management (Bessani et al., 2014), The
CDSS is based on the modern caries management
(Selwitz et al., 2007; Zero et al., 2011a). It uses in-
dividual caries risk factors and scientific evidence on
treatment outcomes.
BNs are probabilistic graph-based models that
offer a formal, natural and intuitive theory to deal
with uncertainties and represent specific knowledge
of complex scenarios (Kjaerulff and Madsen, 2010).
BNs have many applications, for example genet-
ics (Villanueva and Maciel, 2010), social-behavioral
models (Walsh et al., 2010) and lung cancer care
CDSSs (Sesen et al., 2013).
Traditionally, BN models are learned using estab-
lished databases, such as the Asia (Lepar and Shenoy,
1998) network. However, in some scenarios, there is
no data set available, and in these cases, the BN model
can be manually constructed by converting certainty
expressions into probability distributions (Kjaerulff
and Madsen, 2010). For dental caries management,
there is also no data set describing all the variables,
in the (Bessani et al., 2014) study the BN model for a
dental caries CDDS was manually assembled.
In this paper, we evaluate the Bayesian network
of a previously developed Clinical Decision Sup-
port System for Dental Caries management (Bessani
et al., 2014) using the forward sampling methodology
198
Bessani M., de Lima D., Cleiton Cabral Correia Lins E. and Maciel C.
Evaluation of a Dental Caries Clinical Decision Support System.
DOI: 10.5220/0006168301980204
In Proceedings of the 10th International Joint Conference on Biomedical Engineering Systems and Technologies (BIOSTEC 2017), pages 198-204
ISBN: 978-989-758-212-7
Copyright
c
2017 by SCITEPRESS – Science and Technology Publications, Lda. All rights reserved

(Koller and Friedman, 2009). Sampled data are used
to analyze the pattern embedded in the probabilistic
model to validate the CDSS for dental caries manage-
ment. Such analysis is performed by evaluating the
uncertainty in different clinical scenarios.
In the next section, we present the background in-
formation regarding Bayes nets and the Dental Caries
CDSS. Section 3 presents the methodology of both,
the forward sampling process and the used analy-
sis to evaluate the probabilistic model embedding the
CDSS. Further, Section 4 shows the results, analysis
and discussions leading to the conclusions and next
steps presented in Section 5.
2 BACKGROUND
This section presents the background information
necessary to build the CDSS for dental caries man-
agement. It is organized as follows by the theory re-
garding Bayesian networks, and the construction of
Bessani’s CDSS.
2.1 Bayesian Networks
Bayesian Networks represent the interaction between
random variables (Holmes and Jain, 2008). It is
composed of nodes that represent random variables
and edges that represent dependence (Hayduk et al.,
2003). Each node is named according to its function
in the network: the one exercising influence is called
a parent, and the one receiving that affect is known as
a child (Salini and Kenett, 2009).
Formally, a BN can be defined as a set of variables
(nodes) and a set of directed edges between variables
that form a Directed Acyclic Graph (DAG) (Jensen
and Nielsen, 2007). The variables have a finite set
of mutually exclusive states, and the edges link par-
ent nodes (Pr) to child nodes (C) representing a di-
rect dependency between variables (Pearl, 1988). The
dependencies can represent causal relations between
connected nodes.
In a BN, two distinct variables are called D-
Separated (Hayduk et al., 2003) if, for all paths be-
tween them, there is one variable that can be instanti-
ated. The D-separated variables become independent
if the intermediate variable assumes some fixed state.
It is useful to reduce the dimension of the joint prob-
ability over the BN (Jensen and Nielsen, 2007).
Each BN node has a probability table, and
in the case of child nodes, they have a condi-
tional probability table (CPT) (Pearl, 1988). The
CPT contains the conditional probability distributions
P(C
1
|Pr
1
, ..., Pr
n
) of each child node state consider-
ing the possible states of it parents.
The CPT represents the interaction between nodes
(Peebles, 1993). It gives the probability for a to
variable assume one of its states, given that it par-
ents variables assumed some specific configuration
state. If the parent’s nodes are independent of each
other, we can use the chain rule (Jensen and Nielsen,
2007) to decompose P(C
1
|Pr
1
, ..., Pr
n
) as (1), which
is also called the Noisy-OR assumption (Zagorecki
and Druzdzel, 2004):
P(C
1
|Pr
1
, ..., Pr
n
) =
n
∏
k=1
P(C
1
|Pr
k
) (1)
The BN model is used to infer about the probabilities
of some interest node given some evidence, or prob-
abilities, of others nodes in the network. It is well
known that the exact inference for BN has an expo-
nential complexity based on the number of nodes and
edges presents in the network (Guo and Hsu, 2002)
2.2 Dental Caries CDDS
The BN evaluated in this paper are a Dental Caries
CDSS. Dental Caries (Marcenes et al., 2013) are the
most common oral conditions and still an important
health problem. It is a chronic transmissible dis-
ease of multifactorial etiology (Limeback, 2012; Pitts,
2004). The knowledge of such factors, like risk, treat-
ment outcomes and incidence of caries is necessary
for the caries management reasoning (Selwitz et al.,
2007) and their judgment is open to each professional
(Baelum, 2008).
Such a scenario stimulated the previous study
(Bessani et al., 2014), which developed a Dental
Caries CDSS. Unfortunately, there is no database re-
lating all the variables necessary to caries manage-
ment reasoning. In (Bessani et al., 2014) the CDSS
BN was constructed based on the scientific litera-
ture outcomes. The network was created and mod-
eled using the software package GeNIe Modeler from
BayesFusion, LLC.
The BN construction was performed in two parts:
the structure (qualitative), and the probabilities (quan-
titative), as proposed by (Kjaerulff and Madsen,
2010). The BN was modeled using the causal reason-
ing present in the cariology scientific literature. The
resulting BN model is shown in the Figure 1.
In summary, it comprises the risk factors (Zero,
2004; Limeback, 2012; S
¨
oderstr
¨
om, 2014), treat-
ment and return aspects (Nyvad et al., 2003; Fer-
reira Zandon
´
a et al., 2012; Zero et al., 2011b) neces-
sary to caries clinical decision. The risk factors cover
causal and predictive aspects to infer risk classifica-
tion. Treatment assumes clinical evidence together
Evaluation of a Dental Caries Clinical Decision Support System
199
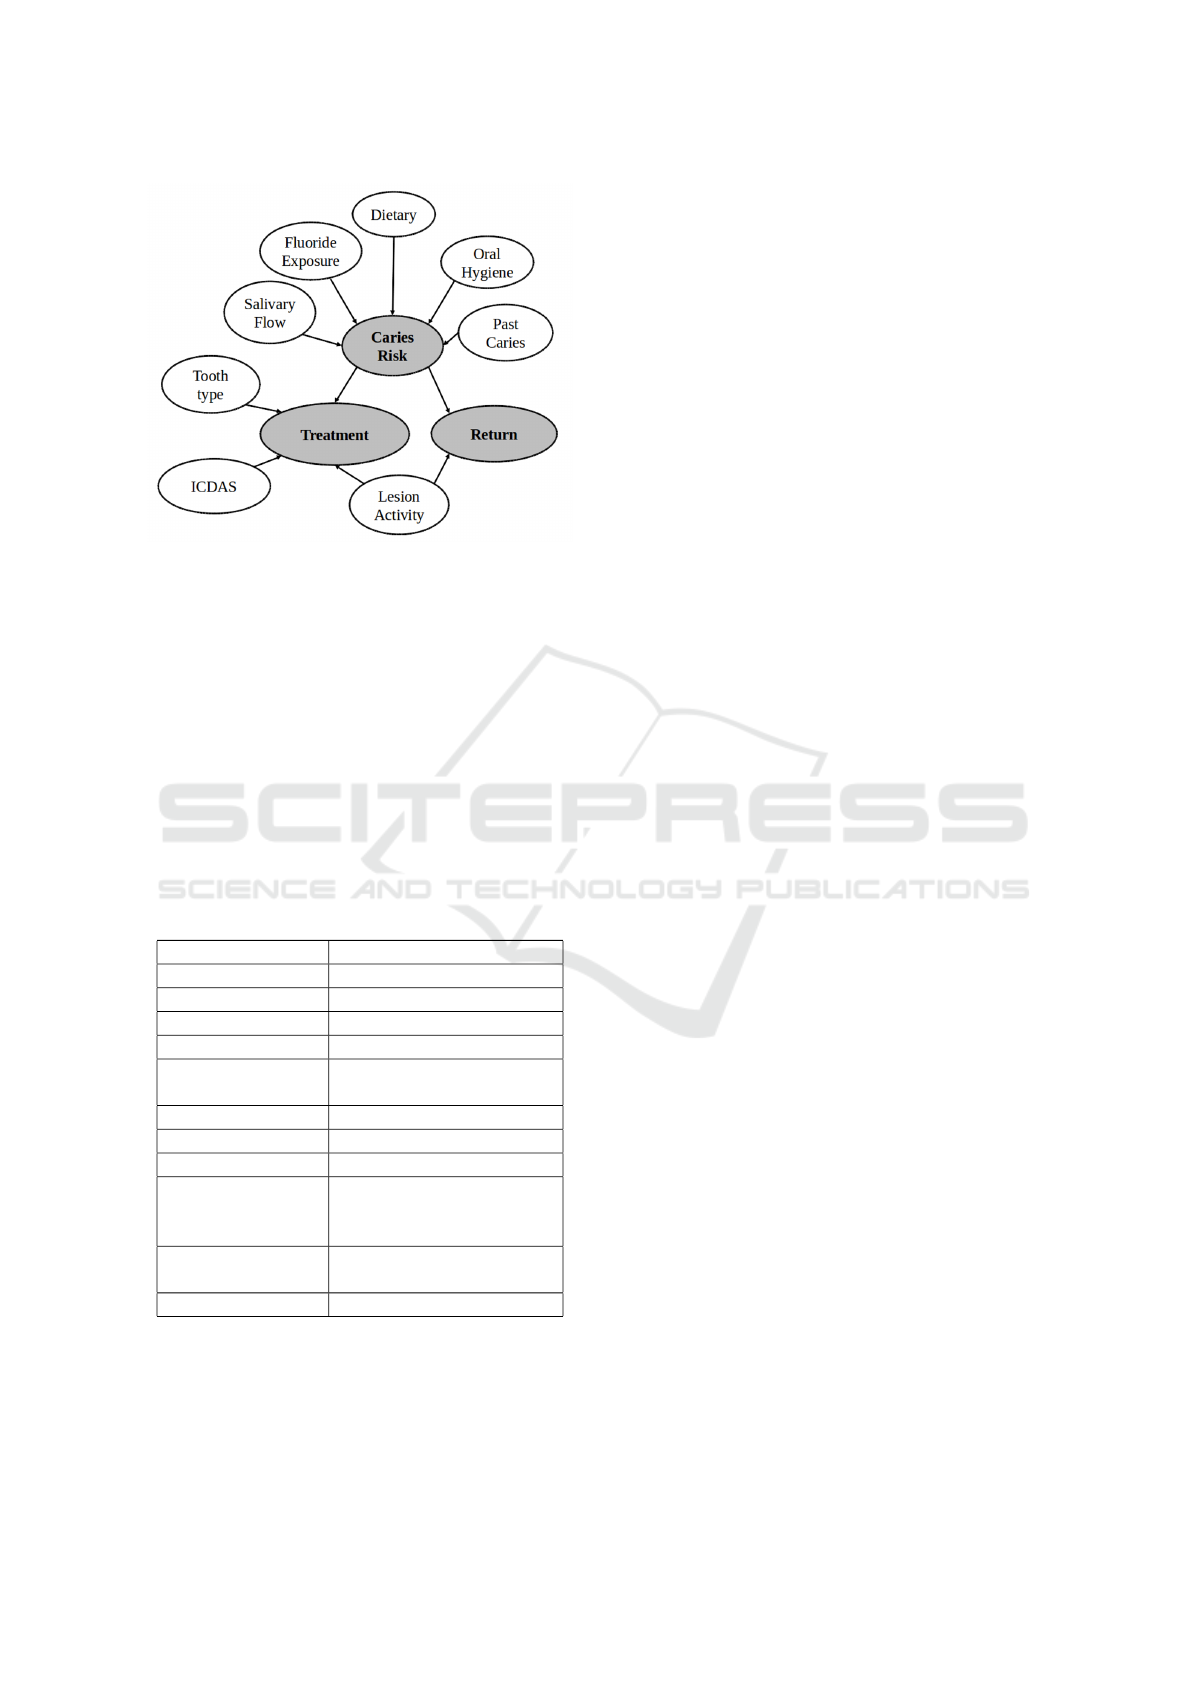
Figure 1: Bayesian Network modeled in a previous study
for a Dental Caries Clinical Decision Support System. The
white nodes are the system inputs, and the gray nodes are
the system suggestions.
with patient risk to infer the most indicate treatment.
The return is inferred considering lesion activity and
the patient risk.
Caries risk, treatment, and return are the sugges-
tions provided by the CDSS. The clinician needs to
supply the input variables states to the system, which
can be obtained by clinical examination, to get the
suggestions. The discrete states of each BN variable
are presented in Table 1.
Table 1: Bayesian Network variables and they respective
states.
Variable States
Dietary Good; Regular; Poor
Fluoride Exposure Yes; No
Salivary Flow Normal; Low
Oral Hygiene Good; Regular; Poor
Past Caries
Zero; Between 1 and 2;
3 or more
Teeth Type Molar; Premolar; Anterior
ICDAS 1&2; 3; 4; 5&6
Lesion Activity Yes; No
Treatment
Fluoride &/OR Sealants;
Restoration;
Endodontic treatment
Return
1 Year; 6 Months;
Before 6 Months
Caries Risk Low; Medium; High
3 METHODOLOGY
Due to lack of a database describing all the necessary
variables the BN evaluated here was manually con-
structed in a previous study. As a consequence, our
methodology consists of generating synthetic data by
forward sampling the CDSS BN (Koller and Fried-
man, 2009; Guo and Hsu, 2002).
In summary, a set of random samples is produced
according to the network CPTs. We also use the d-
separation property to divide the BN into three parts
named- Caries Risk, Treatment, and Return.
The forward sampling is done respecting the par-
tial order of the BN, first sampling the nodes with-
out parents, and then sampling the child of such sam-
pled nodes. As a consequence, when sampling a child
node, the state of it parents are already sampled, and
the child sample is obtained from the CPT.
The random sampling of each variable uses
pseudo-random number generator. It gives a value
between 0 and 1 that is used to define the state of
the discrete variable, e.g., if the pseudo-random num-
ber generator return 0.6, the sampled variable have
P(X = 0) = 0.3 and P(X = 1) = 0.7, since 0.6 > 0.3
we set X = 1.
We divided the BN into three different parts,
Caries Risk, Treatment, and Return according to Sub-
section 2.2, and generated 20.000 random samples
from the CDDS BN. The data obtained are grouped
in the three mentioned parts.
All the possible states of the input variables were
considered allowing to evaluate how each one of their
states contributes to the CDSS suggestions. It will be
done considering the probabilities of the CDSS inputs
given the status of the system’ outputs, allowing an
assessment of how the uncertainties are handled by
the system and its capability of inferring on specific
scenarios.
4 RESULTS & DISCUSSION
4.1 Caries Risk
The Caries Risk part of the BN is presented in Figure
2. The variables that were grouped from the random
samples are Past Caries, Salivary Flow, Fluoride Ex-
posure, Dietary and Oral Hygiene as input variables,
and Caries Risk.
Table 2 presents the samples grouped in a contin-
gency table and shows the relative frequencies of each
input variable state given the state of Caries Risk vari-
able.
BIOSIGNALS 2017 - 10th International Conference on Bio-inspired Systems and Signal Processing
200
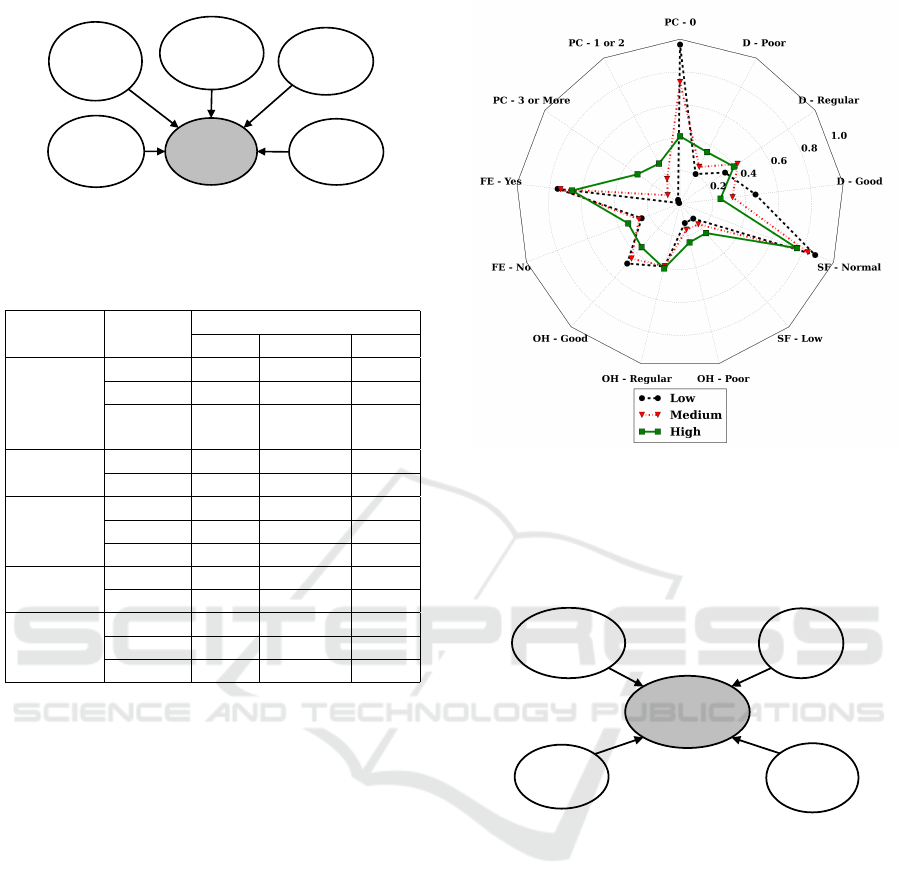
Salivary
Flow
Past
Caries
Caries
Risk
Oral
Hygiene
Dietary
Fluoride
Exposure
Figure 2: BN part referent to Caries Risk suggestions.
Table 2: Conditional Probability Table for the variable
Caries Risk measured from the synthetic data generated.
Input State
Caries Risk
Low Medium High
Past
Caries
0 0,967 0,740 0,410
1 or 2 0,026 0,169 0,275
3 or
more
0,007 0,091 0,315
Fluoride
Exposure
Yes 0,751 0,733 0,662
No 0,249 0,267 0,338
Oral
Hygiene
Good 0,486 0,446 0,353
Regular 0,393 0,391 0,405
Poor 0,121 0,163 0,242
Salivary
Flow
Low 0,121 0,168 0,239
Normal 0,879 0,832 0,761
Dietary
Good 0,463 0,322 0,248
Regular 0,333 0,426 0,398
Poor 0,204 0,252 0,354
Figure 3 presents the relative frequencies of Table
2 as a radar chart. The three plots represent the rela-
tive frequency of each input state for the three states
of Caries Risk. It is possible to note that the frequen-
cies of the input variables states are different for each
state of Caries Risk.
Figure 3 also shows the relative frequencies of
each input state depending on the Caries Risk state.
For example, the state Past aries equal to zero is
present in 96,7% of the samples for Low Caries Risk,
reflecting how such input state is decisive to suggest
a Low Caries Risk.
In contrast, for high Caries Risk as shown in Fig-
ure 3, the input states that presented low frequencies
for Low Caries Risk have higher relative frequencies
for High Caries Risk, and the states with high fre-
quencies for Low Caries Risk have lower frequencies
for High Caries Risk.
4.2 Treatment
Treatment results refer to the sampling of the follow-
ing input variables: ICDAS, Tooth Type, Caries Risk
and Lesion Activity. The Treatment part of the BN is
Figure 3: Radar chart for the relative frequencies of Table 2
for the three states of the Caries Risk variable. PC refers to
Past Caries, SF to Salivary Flow, FE to Fluoride Exposure,
D to Dietary and OH to Oral Hygiene.
presented in Figure 4.
Caries
Risk
Tooth type
Treatment
Lesion
Activity
ICDAS
Figure 4: BN part referent to Treatment Suggestions.
Table 3 contains the samples grouped as a contin-
gency table showing the relative frequencies of each
input variable given the state of Treatment variable.
Figure 5 presents such same relative frequencies as a
radar chart. The three plots represents the three treat-
ment variable states.
We can note that ICDAS classification is decisive
for endodontic treatment, with ICDAS 5 or 6 the en-
dodontic treatment is almost sure. ICDAS is the In-
ternational Caries Detection and Assessment System
and is defined as a workflow for caries visual de-
tection and measurement, for more information see
(Zero et al., 2011b). On the other hand, for the other
Treatment suggestions, others variables become im-
portant.
Evaluation of a Dental Caries Clinical Decision Support System
201
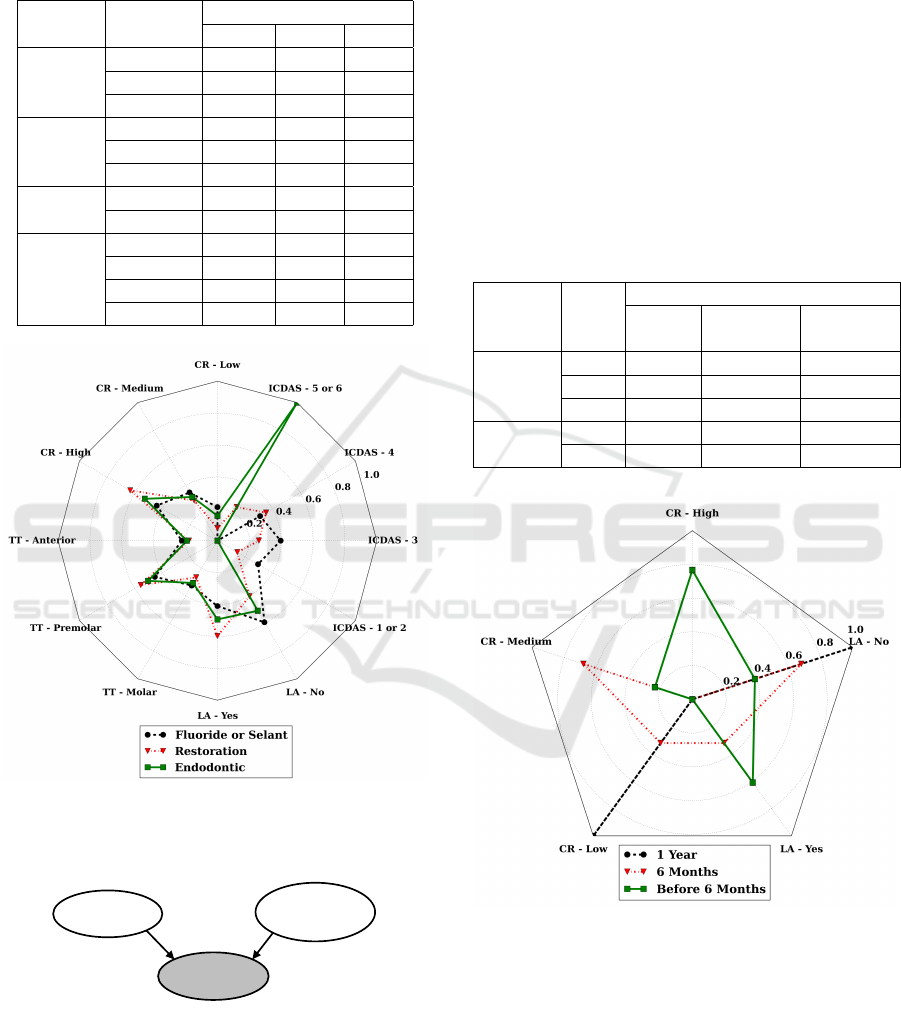
Table 3: Conditional Probability Table for the variable
Treatment measured from the synthetic data generated. F
or S is Fluoride or Sealant, R is Restoration, and E is En-
dodontic Treatments
Input State
Treatment
F or S R E
Caries
Risk
Low 0,211 0,078 0,157
Medium 0,350 0,290 0,317
High 0,439 0,631 0,526
Type
of
Thooth
Molar 0,223 0,179 0,192
Premolar 0,453 0,556 0,503
Anterior 0,324 0,266 0,306
Lesion
Activity
Yes 0,410 0,598 0,493
No 0,590 0,402 0,507
ICDAS
1 or 2 0,294 0,144 0,000
3 0,396 0,260 0,000
4 0,309 0,353 0,000
5 or 6 0,000 0,243 1,000
Figure 5: Radar chart for the relative frequencies of Table 3
for the three states of the Treatment variable. TT refers to
Tooth Type, CR to Caries Risk and LA to Lesion Activity.
Caries
Risk
Lesion
Activity
Return
Figure 6: BN part referent to Return suggestions.
4.3 Return
The Return part of the BN is shown in Figure 6. The
variables grouped to analyze this part of the network
are Caries Risk and Lesion Activity. Table 4 presents
the data as a contingency table.
We performed the same analysis for the Return
variable and Table 4 summarizes the random sam-
pling result. Likewise, Figure 7 displays the radar
chart for each Return state. We can see the importance
of each variable for the system return suggestion. For
a 1-year return, only a low Caries Risk and no Lesion
Activity is necessary. In contrast, other variables sta-
tus become important for a faster patient return. Such
graphical results are in agreement with the literature
used to model the BN (Bessani et al., 2014).
Table 4: Conditional Probability Table for the variable Re-
turn measured from the synthetic data generated. H is High,
M is Medium and L is Low Caries Risk
Input State
Return
1 Year 6 Months
Before
6 Months
Caries
Risk
H 0,00 0,00 0,77
M 0,00 0.68 0,23
L 1,00 0,32 0,00
Lesion
Activity
Yes 0,00 0,32 0,61
No 1,00 0,68 0,39
Figure 7: Radar chart for the relative frequencies of Table
4 for the three states of the Return variable. CR refers to
Caries Risk and LA to Lesion Activity.
5 CONCLUSION
In this paper, we evaluated a BN using forwarding
sampling. The generated data were used to analyze
the network. The BN evaluated is associated with a
CDDS for caries management and was developed in
BIOSIGNALS 2017 - 10th International Conference on Bio-inspired Systems and Signal Processing
202

a previous study. Due to the lack of data correlat-
ing all the necessary variables It was modeled using
a manual construction methodology, certainty expres-
sions from the scientific literature were converted into
probabilities.
The analysis was divided into three parts: Caries
Risk, Treatment, and Return. The sampled data were
presented in contingency tables and in radar charts,
allowing a visual analysis of the dependence of the
CDSS suggestions and input variables states.
Results showed the behavior of CDDS model in
different scenarios. The certainty about suggestions
is present in some scenarios, e.g., the patient return
is equal to 1 year if Caries Risk is low, and Lesion
Activity is no. For return before 6 moths, Lesion Ac-
tivity variable needs to be true, and Caries Risk needs
to be high. In contrast, uncertainty is present in oth-
ers suggestions states, e.g., in scenarios with a Low
Caries Risk.
The analysis shows the system deals with the un-
certainty inherent in the clinical processes. Further-
more, its infers according to the clinical standards pre-
sented in the literature of cariology. It can be helpful
as a second opinion during dental caries clinical man-
agement. The next steps are to quantify the different
levels of uncertainty present in the model and evalu-
ate the performance of the system by comparison with
experts decisions.
ACKNOWLEDGMENTS
The authors would like to thank CAPES - Brazil-
ian Federal Agency for Support and Evaluation of
Graduate Education within the Ministry of Educa-
tion of Brazil; and to CNPq - National Counsel of
Technological and Scientific Development - Project
475064/2013-5.
REFERENCES
Baelum, V. (2008). Caries management: technical solutions
to biological problems or evidence-based care? Jour-
nal of oral rehabilitation, 35(2):135–51.
Berner, E. S. (2007). Clinical decision support systems:
theory and practice. Springer Science & Business
Media.
Bessani, M., Lins, E. C. C. C., Delbem, A. C. B., and Ma-
ciel, C. D. (2014). Construction of a Clinical Decision
Support System for Dental Caries Management using
Bayesian Networks. In XXIV Brazilian Congress on
Biomedical Engineering - CBEB 2014, pages 517–
520.
Castaneda, C., Nalley, K., Mannion, C., Bhattacharyya, P.,
Blake, P., Pecora, A., Goy, A., and Suh, K. S. (2015).
Clinical decision support systems for improving di-
agnostic accuracy and achieving precision medicine.
Journal of clinical bioinformatics, 5(1):1.
Deshpande, R. R., DeMarco, J., Sayre, J. W., and Liu, B. J.
(2016). Knowledge-driven decision support for as-
sessing dose distributions in radiation therapy of head
and neck cancer. International journal of computer
assisted radiology and surgery, pages 1–13.
Ferreira Zandon
´
a, A., Santiago, E., Eckert, G. J., Katz, B. P.,
Pereira de Oliveira, S., Capin, O. R., Mau, M., and
Zero, D. T. (2012). The natural history of dental caries
lesions: a 4-year observational study. Journal of den-
tal research, 91(9):841–6.
Genes, N., Kim, M. S., Thum, F. L., Rivera, L., Beato, R.,
Song, C., Soriano, J., Kannry, J., Baumlin, K., Hwang,
U., et al. (2016). Usability evaluation of a clinical de-
cision support system for geriatric ed pain treatment.
Applied clinical informatics, 7(1):128–142.
Goh, W. P., Tao, X., Zhang, J., and Yong, J. (2016). Deci-
sion support systems for adoption in dental clinics: a
survey. Knowledge-Based Systems, 104:195–206.
Guo, H. and Hsu, W. (2002). A survey of algo-
rithms for real-time bayesian network inference. In
AAAI/KDD/UAI02 Joint Workshop on Real-Time De-
cision Support and Diagnosis Systems. Edmonton,
Canada.
Hayduk, L., Cummings, G., Stratkotter, R., Nimmo, M.,
Grygoryev, K., Dosman, D., Gillespie, M., Pazderka-
Robinson, H., and Boadu, K. (2003). Pearl’s d-
separation: One more step into causal thinking. Struc-
tural Equation Modeling: A Multidisciplinary Jour-
nal, 10(2):289–311.
Hogenboom, F., Frasincar, F., Kaymak, U., de Jong, F., and
Caron, E. (2016). A survey of event extraction meth-
ods from text for decision support systems. Decision
Support Systems, 85:12–22.
Holmes, D. and Jain, L. (2008). Introduction to bayesian
networks. In Holmes, D. and Jain, L., editors, Inno-
vations in Bayesian Networks, volume 156 of Stud-
ies in Computational Intelligence, pages 1–5. Springer
Berlin Heidelberg.
Jensen, F. and Nielsen, T. (2007). Bayesian networks and
decision graphs. Springer Science+Business Media,
New York, 2nd ed edition.
Kjaerulff, U. B. and Madsen, A. L. (2010). Bayesian Net-
works and Influence Diagrams: A Guide to Construc-
tion and Analysis. Springer Publishing Company, In-
corporated, 1st edition.
Koller, D. and Friedman, N. (2009). Probabilistic graphical
models: principles and techniques. MIT press.
Lambin, P., van Stiphout, R. G., Starmans, M. H., Rios-
Velazquez, E., Nalbantov, G., Aerts, H. J., Roelofs,
E., van Elmpt, W., Boutros, P. C., Granone, P., et al.
(2013). Predicting outcomes in radiation oncology-
multifactorial decision support systems. Nature Re-
views Clinical Oncology, 10(1):27–40.
Lepar, V. and Shenoy, P. P. (1998). A comparison of
lauritzen-spiegelhalter, hugin, and shenoy-shafer ar-
chitectures for computing marginals of probability
Evaluation of a Dental Caries Clinical Decision Support System
203

distributions. In Proceedings of the 14th Confer-
ence on Uncertainty in Artificial Intelligence (UAI-98,
pages 328–337. Morgan Kaufmann.
Limeback, H. (2012). Comprehensive Preventive Dentistry.
John Wiley & Sons, Ltd.,, West Sussex, UK.
Marcenes, W., Kassebaum, N. J., Bernab
´
e, E., Flaxman,
A., Naghavi, M., Lopez, A., and Murray, C. J. L.
(2013). Global burden of oral conditions in 1990-
2010: a systematic analysis. Journal of dental re-
search, 92(7):592–7.
Nyvad, B., Machiulskiene, V., and Baelum, V. (2003). Con-
struct and Predictive Validity of Clinical Caries Diag-
nostic Criteria Assessing Lesion Activity. Journal of
Dental Research, 82(2):117–122.
Pearl, J. (1988). Probabilistic reasoning in intelligent sys-
tems: networks of plausible inference. Morgan Kauf-
mann, San Maeto, 1 edition.
Peebles, P. Z. (1993). Probability, Random Variables, and
Rabdom Signal Principles. McGraw-Hill Inc., 3rd
edition edition.
Pitts, N. B. (2004). Are we ready to move from operative to
non-operative/preventive treatment of dental caries in
clinical practice? Caries research, 38(3):294–304.
Power, D. J., Sharda, R., and Burstein, F. (2015). Decision
support systems. Wiley Online Library.
Salini, S. and Kenett, R. S. (2009). Bayesian networks of
customer satisfaction survey data. Journal of Applied
Statistics, 36(11):1177–1189.
Selwitz, R. H., Ismail, A. I., and Pitts, N. B. (2007). Dental
caries. Lancet, 369(9555):51–9.
Sesen, M. B., Nicholson, A. E., Banares-Alcantara, R.,
Kadir, T., and Brady, M. (2013). Bayesian networks
for clinical decision support in lung cancer care. PloS
one, 8(12):e82349.
S
¨
oderstr
¨
om, U. (2014). A retrospective analysis of caries
treatment and development in relation to assessed
caries risk in an adult population in Sweden. BMC
Oral Health, 14(1):126.
Villanueva, E. and Maciel, C. D. (2010). Modeling asso-
ciations between genetic markers using Bayesian net-
works. Bioinformatics, 26(18):i632–i637.
Walsh, S., Dalton, A., Whitney, P., and White, A. (2010).
Parameterizing Bayesian Network Representations of
Social-Behavioral Models by Expert Elicitation A
Novel Application of Conjoint Analysis. In Artificial
intelligence in medicine, pages 227–232.
Zagorecki, A. and Druzdzel, M. J. (2004). An empirical
study of probability elicitation under noisy-or assump-
tion. In FLAIRS Conference, pages 880–886.
Zero, D. T. (2004). Sugars - the arch criminal? Caries
research, 38(3):277–85.
Zero, D. T., Zandona, A. F., Vail, M. M., and Spolnik, K. J.
(2011a). Dental caries and pulpal disease. Dental
Clinics of North America, 55(1):29–46.
Zero, D. T., Zandona, A. F., Vail, M. M., and Spolnik, K. J.
(2011b). Dental caries and pulpal disease. Dental
clinics of North America, 55(1):29–46.
BIOSIGNALS 2017 - 10th International Conference on Bio-inspired Systems and Signal Processing
204
