
A Classification of Healthcare Social Network Analysis Applications
Lamia Benhiba, Asmae Loutfi and Mohammed Abdou Janati Idrissi
TIME team, ENSIAS, Mohamed V University, Rabat, Morocco
Keywords: Network Dynamics, Structural Analysis, Social Network Analysis, Healthcare Organization, E-health,
Healthcare SNA Applications.
Abstract: As the web, social networks and the internet of things permeated our daily life; a new perspective for
understanding the complexity of our interconnectedness has become necessary. One approach that has
predominantly proven useful in discovering hidden relationships, connections and trends of complex
systems through mathematical and graphical techniques is Social Network Analysis (SNA). This approach
has become increasingly appeling for Healthcare in particular as many of this domain’s problems examine
systems with dynamic actors that interact with each other and exhibit emergent complex behaviors.
However, due to their multiplicity, the application of SNA methodologies proves to be a complex and
confusing endeavor. In an attempt to support the effort of applying SNA methodologies on Healthcare
research problems, this paper offers firstly a categorization of SNA methodologies (structural and dynamic
analysis), then inventories Healthcare SNA applications and classifies them into organizational and e-health
related problems. The resulting categorization helps identify the Healthcare research problems most
auspicious for SNA methodologies and should thus provide a guiding material of adequate SNA
methodologies for a given Healthcare research problem.
1 INTRODUCTION
With the emergence of the web, online social
networks, the internet of things etc., we are
increasingly aware of our interconnectedness and its
quantifiability. There is thus a growing realization
that the behavior of a system is shaped by the
interactions among its discrete components
(Bullmore, 2009). Thereby, the study of the
underlying network has become a stepping stone
into understanding complex systems.
Social network analysis (SNA) has gained a lot
of attention from both academia and practitioners of
various domains (from social science (Lewis, 2008),
economics (Krempel, 2002), politics (Klofstad,
2003), fight against crime and terrorism (Paulo,
2013), to neuroscience (Rubinov, 2010) and
epidemiology (Chen, 2007)). SNA offers a new
perspective for analysis and prediction as it focuses
on the interconnectedness between the various
constituents of the system and not on their inherent
characteristics. It relies on Graph theory to express
complex systems as a set of nodes (e.g. persons,
organizations etc.) interconnected through social
relationships (e.g. friendship, collaboration, transfer
of funds, co-occurrence etc.). SNA aims to model,
map, characterize and quantify topological
properties of the network, identify patterns of
relations and recognize the roles of sub-groups and
nodes within it.
With the increasing availability of data and the
advent and development of methods used to (a)
collect, store and (b) visualize network data
(Abraham, 2010), the interest in SNA has grown
massively. Healthcare is among the chief domains
where this particular approach is increasingly
appealing. Many healthcare research problems
examine systems with dynamic actors that interact
with each other and exhibit emergent complex
behavior. This makes these problems an auspicious
application of SNA’s methodologies and techniques.
The rest of the paper is organized as follows:
Section II will introduce SNA and its underlying
principles. It will also present the classification of
the different SNA methodologies used throughout
the literature into two main categories: structural and
dynamics analysis. Section III will particularly focus
on organizational healthcare and e-health SNA
applications and then match them with the two SNA
categories of section II. Section IV will summarize
the results and enumerate different opportunities and
challenges of the application of SNA in the
Benhiba L., Loutfi A. and Janati Idrissi M.
A Classification of Healthcare Social Network Analysis Applications.
DOI: 10.5220/0006168001470158
In Proceedings of the 10th International Joint Conference on Biomedical Engineering Systems and Technologies (BIOSTEC 2017), pages 147-158
ISBN: 978-989-758-213-4
Copyright
c
2017 by SCITEPRESS – Science and Technology Publications, Lda. All rights reserved
147

healthcare domains. The last section will conclude
the paper with providing hints on future work.
2 SOCIAL NETWORK ANALYSIS
METHODOLOGIES
SNA is an interdisciplinary descriptive, empirical
discipline that studies networks as a mathematical
representation of complex systems by expressing
them in terms of relationships among actors. SNA
has four features: 1) It is motivated by a structural
intuition based on ties linking social actors, 2) It is
grounded in systematic empirical data, 3) It draws
heavily on graphic imagery, and 4) It relies on the
use of mathematical and/or computational models
(Freeman, 2004). The body of research has used
SNA methodologies in various domains to help
validate theories made about the structure or the
behavior of a social construct or complex system.
These methodologies can be categorized in several
ways. No matter how limited and flawed the effort,
doing so is useful because it guides the first steps
when attempting to answer a specific research
question.
We propose a categorization based on the
purpose of the SNA analysis. A review of seminal
works on SNA {(Wasserman, 1994), (Albert, 2002),
(Barabási, 2002), (Newman, 2003), (Watts, 2004),
(Christakis, 2011), (Scott, 2012), (Blonder, 2012),
(Barabási, 2016)} has rendered two distinct purposes
of network analysis:
▪ Structural Analysis: describes in discrete time
snapshots the topology of the network, the roles
of particular nodes, communities and subgroups
within the network etc.
▪ Dynamics Analysis: studies the changes of the
network’s topology through time (its evolution
and growth, the removal and adding of nodes and
edges, the change in link weight etc.) and
examines the diffusion of processes within the
network.
2.1 Structural Analysis
Structural analysis aims to examine the topology of
the network in order to uncover the overall
properties of the network and its constituents’
characteristics. It offers two perspectives: a micro-
view and a macro-view. The micro or Ego-centric
view focuses on a select actor (ego) and examines its
neighbors (nodes that are connected to it), their
neighbors and so forth. It studies the features of
personal networks. The macro or Socio-centric view,
on the other hand, provides a bird's eye perspective
of the network and helps examine the structural
patterns of the interactions among nodes with the
aim to explain and potentially generalize an
outcome. Studying the structure of a network relies
on a number of measures. Because of their ability to
give an indication on the topology of the network
(random, small world or scale free), the most studied
concepts in contemporary network research are:
degree distribution, clustering and Assortativity.
The degree of a node is the number of links it
has in the network and thus reflects the size of a
node's neighborhood. The average degree has been
used to gauge the cohesion (Kratzer, 2005) or
connectedness on the network level (Shrader, 1989).
The degree distribution is often plotted, using
histograms, to obtain insight into the overall
structure of the network and detect potential heavy-
tailed distributions.
The clustering coefficient represents the
tendency of nodes to form tightly knit groups within
the network. It is measured on the node level and on
the network level (Watts, 1998). The local
Clustering coefficient of a node is used to quantify
the level of transitivity within the network, i.e. the
chance that a node u is connected to w, when u is
connected to v and v is connected to w (uvw form a
triangle). The Network Clustering coefficient on the
other hand is defined as the average of the local
clustering coefficients of all the nodes.
Assortativity detects the level of homophily in a
network and measures the similarity of connections
in the graph with respect to the node degree
(McPherson, 2001). Assortativity can hint to the
existence of a core-periphery structure where a set of
closely knit nodes constitute the core of a network
and low degree nodes are left on the periphery.
Along these core concepts, many studies have
focused on community detection where algorithms
are applied to uncover locally dense connected
subgraphs (barabasi, 2016). Community detection
allows a deeper understanding of the network’s
structure and hidden connectivity patterns.
2.2 Dynamics Analysis
The study of network dynamics refers to two distinct
phenomena. We borrow the classification given by
(Blonder, 2012) in which they distinguish the
dynamics of the network from the dynamics on the
network. The first examines the growth of the
network, the factors behind the creation or
dissolution of new nodes and edges and the
HEALTHINF 2017 - 10th International Conference on Health Informatics
148

evolution of link strength through time. The second
studies propagation phenomena and the transfer,
throughout the network, of cascades such as
information, trust, opinion, behavior, money, goods
or pathogens etc.
2.2.1 Dynamics of the Network
The study of the dynamics of networks stems from
the need to understand the rules of networks’ growth
in order to predict their evolution. Networks evolve
by adding or removing nodes or links over time.
Research on the evolution of networks focuses on
the various dynamical processes that affect the
change of the network’s structure. The most popular
evolving networks’ models are Barabàsi and
Albert’s Preferential attachment (Barabàsi, 1999)
and (McPherson, 2001)’s homophily model.
▪ In the preferential attachment model, nodes
present a bias to connect to popular nodes that
have a large number of connections. These hubs
gain more connectivity as the network grows,
following a rich-gets-richer model (Bollobás,
2003).
▪ Homophily represents the likeliness of nodes to
connect to nodes that resemble them and which
are generally the neighbors in the network.
Nodes' connections are thus based on a conscious
action with embedded bias (It's more likely for
example to connect to a friend of a friend or an
individual with common interests than it is to a
random person).
While the main goal of these models is to predict the
probability of link formation, enabling thus Link
recommendations, nodes and links dissolution is
another aspect of network evolution that is
increasingly drawing interest. The goal here is to
predict links that are more likely to be dropped from
the network and to understand how it would affect
the structure of the network.
2.2.2 Dynamics on the Network
In an attempt to understand the dynamic effect of
network properties on diffusion, various studies
relied on mathematical models originally used in
fields such as epidemiology, sociology and
economics. Louni et al. (Louni, 2014) classified the
most popular information diffusion models into
three categories:
▪ Contagion Models: these models build on the
idea that a cascade flows in a network in the
same way a contagious disease spreads through a
population. The most widely used models for
studying contagion are usceptible-infected (SI),
susceptible-infected-susceptible (SIS) and
susceptible-infected-recovered (SIR). The
models consider cascades to spread from
adopters (infected) to susceptible nodes and
consider the possibility of retracting the cascade
for recovered nodes.
▪ Social Influence Models: These models assume
that the social influence between nodes affects
the diffusion of cascades (opinions or behaviors
for instance). The most widely studied and used
social influence models are the Linear Threshold
(LT) (Granovetter, 1978) and the Independent
Cascade (IC) (Goldenberg, 2001).
▪ Social Learning Models: In contrast with
previous models which ignore the actions and
decision making of actors, the nodes in social
learning models are considered rational agents
who observe outcomes of prior behaviors and
decide accordingly. The decision of a user to
forward information is modeled using game
theory concepts where the user maximizes some
utility for himself (Jackson, 2008).
Studying the spread of cascades within a network
offers theoretical and empirical tools to not only
quantify the propagation process, but to forecast it as
well.
3 A CATEGORIZATION OF
HEALTHCARE SNA
APPLICATIONS
Healthcare’s purpose is to ensure the well-being of
people by taking both proactive and active actions.
Healthcare organizations take preventive actions like
sharing information about healthy life styles, the
vaccines in the market etc., providing psychological
council, or conducting research for improving health
services and the health life of people. They also take
reactive actions by administrating drugs, doing
surgery helping people with chronic illness etc.
Healthcare research covers a lot of areas such as
clinical, biomedical, health systems and services and
social, cultural, environmental and population health
research. Healthcare research is undertaken to
establish the foundation for developing effective
therapeutic interventions to expose to individuals
and communities, to support enhancing and
understanding illness and health and safeguard and
enhance the health of persons and populations
(Steinwachs, 2008). Due to the complexity of the
healthcare system, a methodological approach is
needed to analyze, monitor and ensure the
A Classification of Healthcare Social Network Analysis Applications
149

effectiveness of its endeavors. SNA is thus
introduced as a powerful new way to discover
valuable hidden connections, relationships, trends
and insights.
3.1 Methods and Materials
The purpose of this work is to establish a matching
between SNA methodologies, described in section
II, and healthcare application domains in order to
uncover trends of SNA applications in the healthcare
field. To accomplish this, we classified SNA
applications in healthcare according to their
functional domain and finally assigned SNA
methodologies to each healthcare domain.
To identify the SNA applications in healthcare,
we scanned three databases (Scopus, Science Direct
and IEEExplore Digital Library) for the last 10
years, using various research terms related to: (social
network analysis OR graph analytics) AND
(healthcare, e-health, health organization, behavioral
OR epidemiology) in Title, keywords and abstract.
The search was restricted to English scientific
literatures that are in peer-reviewed venues and
duplicated works were eliminated. A paper is
selected when the algorithm and methodology of
social network analysis in e-health or healthcare
organizations. In this paper, the 16 works listed in
Table 1 will be considered. During the data
extraction process, we included information about
the title of the article, the year of publication, the
authors, the country, the application of healthcare
research, the data sources, the applied methodology
and the type of the modeled graphs.
3.2 Categories of Healthcare SNA
Applications
There are many areas of healthcare that can apply
SNA. In this paper, we focus on the areas that drew
the most attention: healthcare organization and e-
health.
3.2.1 Healthcare Organization
A report of the Institute of Medicine suggested six
aspects for improvement of the healthcare system. It
needs to be: Safe (healthcare services to patients
should be secure and not cause any injuries),
Effective (care services based on scientific evidence
for increasing healthy outcomes), Patient-centered
(present to the patient the care service that respect
their needs, values and preferences), Timely
(provide care assistance early on before any
complications occur), Efficient (make healthcare
services available with minimum costs and without
waste), Equitable (people should have the same
access to healthcare services).
To achieve these purposes, healthcare
organizations need to collaborate to share
information about their operational and research
works, establish policies for more effective and safe
treatments and manage their waste by detecting
fraud of healthcare providers.
i. Health policy
The World Health Organization (WHO) defined
health policy as “the decisions, plans, and actions
that are undertaken to achieve specific health care
goals within a society”. The specification of rules
that healthcare stakeholders should follow in terms
of defining characters for differing groups, making a
reference for treatments and actions undertaken by
healthcare practitioners and sharing this information
with people, are the various things attained by a
health policy institution.
The study proposed by (Millard, 2015) adresses
WHO's Essential Medicine List (EML). EML is a
list of medicines that assists countries on selecting
the treatments of each priority requirement. In this
article, SNA is used to inspect the social, political
and economic areas for adding the encouragement
for Misoprostol’s use for preventing and treating a
postpartum hemorrhage, especially in low income
countries, according to the WHO's EML in 2011. A
study the chronology of WHO misoprostol
applications and evolution of related social networks
are applied to evaluate the relation of health policy
and this social area.
In (Takahashi, 2016), a descriptive analysis of
duplicative prescription practices is performed.
When patients take orders for the same state from
two or more sources, we talk about duplicative
prescription practices. This practice is the origin of
medical waste. Some patients resell drugs for extra
cash and can also cause adverse effects. The
descriptive analysis was conducted by using the
measurement of SNA and describing the prevalence
(the rate of persons with an illness or characteristic)
of duplicative prescription through ages. The study
also calculated the density of the medical facilities
and patients network for each class of drugs defined
by their prevalence.
In (Bramhachari, 2016), the authors conducted a
qualitative ego-network analysis to understand
dominance of Rural Medical Practitioners (RMPs) in
West Bengal, India. They inspected the genesis of
RPMs’ social links with various actors in the health
HEALTHINF 2017 - 10th International Conference on Health Informatics
150

system and showed the operators donating their
subsistence over the years, by using SNA. By
identifying the ties in RMPs’ network that are
formal healthcare providers, the healthcare market
and the community, we can comprehend the
dynamics of the healthcare market.
Guo et al. use healthcare claims data of the
Medical Insurance Association of Anhui Province to
look into details of referrals social network. They
design a referral social network where the nodes are
hospitals and ties are patient-transferred between
hospitals. The authors conduct a structural analysis
to measure the degree and centrality to describe the
relationship between this variable and other patients
and hospital variables. Finally, they explore rules
between the variables of the referral social network
and variables of quality of the healthcare to help
healthcare providers minimize cost and length of
stay in the hospital and increase the efficiency of
medical resources (Guo, 2015).
ii. Healthcare organizational collaboration
Healthcare organizations need to collaborate with
each other in order to improve the quality of care to
the patients, in term of efficient research, cost
decrease, good management of resources etc.
- Intra-organizational Collaboration (actors)
Soulakis et al. made use of patients’ Electronic
Health Records (EHR) with heart failure to explore
the collaboration between healthcare providers and
patients in The Northwestern Memorial Hospital
(NMH). The access to EHR provides a large amount
of data about interactions between providers and
patients (Soulakis, 2015). A structural SNA
methodology is used to describe the collaboration
between patients and providers through a bipartite
network (the source node was a provider, the target
node was a patient and the edge represented the
patient record accessed by this provider), and a
provider collaboration network which is a network
of the common access of patient records by
providers (the node represent providers and the
edges are established when two providers have
access to more than 10 common patient records).
Data is extracted from the Enterprise Data
Warehouse (EDW) of NMH. The network is
afterwards visualized and clique formation is
analyzed. A graph database is used to process
queries and answer questions about care and
provider-patient collaboration.
- Inter-organizational Collaboration (institutions)
Caniato et al. conducted a case study on
management of healthcare waste in a region with
specific characteristics: Gaza Strip (Caniato, 2015).
They employ an SNA and stakeholder analysis to
explore and comprehend the effects of a range of
logistical and socio-economic factors on the
effectiveness of stakeholder networks in the region.
Caniato et al. applied a structural analysis of
interaction frequency and information exchanged
among stakeholders that are public authorities,
health providers, supporting actors and others.
The study performed by (Schoen, 2014) used
SNA to confirm the suggestion that when we take
funding to concentrate on multi-sector collaboration
in Social Innovation for Missouri (SIM) program, a
public health program interventions to prevent
obesity and stop tobacco, develop various
partnership structures than other grantees. The
authors explore different variables as the level of
collaboration and frequency of contact by applying
SNA. They measure the network descriptors such as
average degree, density, betweeness centralization
and degree centralization to evaluate the network of
contacts and the collaboration of different
stakeholders.
Dianas et al. studied an excellence program in
low and middle-income countries provided by the
National Heart, Lung, and Blood Institute-
UnitedHealth to fund 11 centers of excellence
(Dianis, 2016). In order to prove the effect of
collaboration with a federal support, they used SNA.
They created a network of the program’s
stakeholders by considering links as collaborations
on administrative support and research projects.
They later compared the resulting network before
the development of the Centers of Excellence
Program and after.
Kawonga et al. presented a case study of HIV
monitoring and evaluation to examine and
understand the way that Disease Control
Program(DCP) and General Health Services(GHS)
managers communicate when they make a health
reform to make an administrative integration in
South Africa (Kawonga, 2015). For this purpose,
they described the entire network by using density,
degree and betweenness centrality. They also used
density and a measure of homophily to analyze sub-
groups networks. A block-model analysis was used
to identify the connections between management
committees and manager groups.
The paper presented by Khosla et al. introduced
a study of collaboration between HIV agencies in
Baltimore (Khosla, 2016). SNA and relation
coordination were used to analyze the quality of
coordination between HIV agencies when they
accessed resources like information, around seven
A Classification of Healthcare Social Network Analysis Applications
151

dimensions such as accuracy of communication,
knowledge of agencies’ work, frequency, problem-
solving communication, timeliness, shared goals and
mutual respect. Density and centrality of the
network of agencies collaboration were calculated as
part of an SNA structural analysis. For the study of
relation coordination, a questionnaire was used
among these seven dimensions about
communication and relationships between HIV
agencies. SNA measures were used to describe the
whole network: density and degree centralization
and to describe a position of an actor in the network:
degree, indegree, centrality, degree centrality,
weighted degree centrality, betweenness centrality
and closeness centrality.
Wang et al. apply SNA to explore the
collaboration between surgeons, assistants and
anesthetist working at different hospitals by using
data from Private Health Insurance (PHI) claims in
Australia. They also studied their impact on quality
and cost of care (Wang, 2014). SNA is used to
analyze the collaboration among the three healthcare
providers, study the topologies of the network to see
how doctors work while treating patients and
examine the effect of these topologies on quality and
cost of care for patients. The effect of network
structure on quality and cost is analyzed around
efficiency metrics that are Length of Stay (LoS),
Medical costs and Complication rate. They
thereafter designed two kind of networks: one for
collaboration between surgeons, assistant surgeons
and anesthetists; and the second centered on a
surgeon collaboration network to study the
connections of each surgeon. The measures of SNA
used in this paper are: the size of node (charged
number of this provider), tie strength (total of
common admission between two providers),
centrality to have an idea on the influence of a
vertex in the network) and density.
- Research collaboration
Collaboration research is important to enhance the
quality of research by determining the leaders in a
subject and affording reasonable proposals and
scientific evidence to make a finance of specific area
of research policy (Wu, 2015).
Bien et al. presented a case study of the use of
SNA in the context of biomedical research grants
collaboration at the University of Arkansas for
Medical Sciences (UAMS) (Bian, 2013). The
objective of this study was to evaluate the research
collaboration networks (RCNs) for both level inter-
and intra-institution in the community of the Clinical
Translational Science Award (CTSA) and examine
the effectiveness of CTSA funded at UAMS and
their influence on environment of research
collaboration in an institution. For categorizing the
network, the authors calculated the network’s path
length and its clustering coefficient. They also
measured the structural characteristics such as
centrality to identify the important (the influencer or
contributor) node in the research community. They
examined the structural characteristics and the
network dynamics of the RCNs.
Wu et al. (Wu, 2015) performed a study on the
scientific research collaboration in the specialty of
psychiatry. This work applied SNA to analyze the
structure of scientific collaboration in psychiatry by
using the notion of co-authorship, which can
determine the authors, institutions and countries
involved in the scientific collaboration network. In
each level of authors, institutions and countries, the
author characterized psychiatry research
collaborative behaviors, K-plex analysis and Core-
periphery are the methods used in this paper to
describe the collaborative connections. The authors
measure centrality to detect the central, the core
position and actor with control and possession of
valuable research resources in each collaboration
network.
3.2.2 E-health
WHO defines e-Health as “the use of information and
communication technologies (ICT) for health”(WHO,
2016). By using ICT in this area, we can assist
patients for treatments; share information about
healthy life styles, follow people with diseases etc.
The study presented by Chomutare et al. adresses
weight loss performance by monitoring online
interaction behaviors for forcast them (Chomutare,
2014). The authors captured data from a sub-forum
of two online communities concerned with obesity.
The first was for people older than 50 years and the
second was for people that needed surgical
interventions as they interacted before and after the
intervention for weight loss performance. Structural
SNA is used to create a classification of people who
lose significant weight (performers) and the others
(non-performers) to predict weight loss. Authors
remarked that the top performers were connected at
different sub-community and were more active
online.
Pachucki et al. measure objectively the social
interaction between 6th-grade students at a private
K-8 School in the State of California by using
accelometers and RFID technology. The purpose of
this paper is to study the relations between social
interaction and mental health behaviors such as self-
HEALTHINF 2017 - 10th International Conference on Health Informatics
152

esteem and depressive symptoms of early
adolescences. Due the focus on health behaviors,
health status and changes in network structure; the
authors measure the characteristics of social
environment, health behavior, social interaction
network and mental health to analyze them using
bivariate associations. They use a stochastic actor-
based modeling (SABM) framework to join the
dynamic co-evolution of social ties and self-esteem
or depressive symptoms (Pachucki, 2015).
Goodall et al. explored the importance of ICT for
searching information behavior by older migrants
with Culturally And Linguistically Diversity
(CALD) (Goodall, 2014). They determined factors
that leverage the use of ICT to locate information.
These factors can be education, migration, socio-
economic status, ethnicity and English proficiency
of older migrants. The study undertook by Goodall
et al. focused on the search of cancer-related
information by the group. The authors used SNA
and a constructivist grounded theory method to
analyze the data captured in the interviews, and then
they studied the preferences and uses of traditional
information sources compared to modern ones (PC,
Internet and mobiles).
Table 1: A methodological classification of each healthcare application represented in this paper.
Reference of
paper and the
country
The SNA application
Healthcare
categorization
Methodological
categorization
Dataset/Size of
the network
Algorithms/Metrics
(Millard,
2015), UK
They establish a
chronology of WHO
misoprostol applications
and they examine the
evolution of related
social networks and the
nested subset network of
the WHO EML
misoprostol applications
Healthcare
organization:
Health policy
Dynamics of the
network
238
organizations
and individuals
Chronological approach
combined with SNA
(evolution of social
network) : density,
geodesic distance,
diameter, centrality,
nesting, clique formation
(Takahashi,
2016), Japan
They conduct a
descriptive analysis of
medical waste by
studying duplicative
prescription practices
Healthcare
organization:
Health policy
Structural
Data are from
health insurance
claims database
1,243,058
insured people
and their
dependents
Statistical analyses:
correlation by using
scatter plots
and the Pearson
correlation coefficient
SNA: bipartite networks,
density
(Bramhachari,
2016), India
They use a qualitative
ego-network method to
understand the RMP
network
Healthcare
organization:
Health policy
Structural 35 participants
Qualitative Ego-network
method
(Guo, 2015),
China
They analyze the
healthcare claims data of
the Medical Insurance
Association of Anhui
Province to design a
referral social network.
Healthcare
organization:
Health policy
Structural
72 hospitals and
8856 patients in
the claim data
from Medical
Insurance
Bureau
Community detection:
spinglass, edge
betweenneess, label
propagation, optimal,
walktrap.
Simple linear regression:
Los, Medical cost,
Degree, closeness
centrality, betweenness
centrality, eigenvector
centrality, rank of
Hospital.
Rules exploration:
Decision tree.
A Classification of Healthcare Social Network Analysis Applications
153

Table 1: A methodological classification of each healthcare application represented in this paper (cont.).
(Soulakis,
2015), USA
They make a bipartite
network of providers
accessing patients’
records and a provider
collaboration network to
describe collaboration
between patients and
providers.
Healthcare
collaboration
intra-
organization
Structural
Collaborative
electronic health
record (HER)
1504 nodes and
83 998 edges
Bipartite network
Module and clique
identification: heuristic
community detection
algorithm, kCliques
algorithm
(Caniato,
2015), Italy
They conduct a
Stakeholder analysis and
structural SNA of
interaction frequency
and information
exchanged between
stakeholders
Healthcare
collaboration
inter-
organization
Structural
Dataset
constructed
from 16
structured and
two semi-
structured
interviews
SNA and stakeholder
analysis
(Schoen,
2014), USA
They apply structural
SNA to both contact and
collaboration networks
Healthcare
collaboration
inter-
organization
Structural
23 Missouri
communities
in early 2012
SNA: average degree,
density, degree
centralization, and
betweenness
centralization
(Dianis,
2016),USA
They conduct structural
SNA on the network of
all stakeholders in an
excellence program
Healthcare
collaboration
inter-
organization
Structural
11 contracts in
10 countries
128 nodes
SNA: density, average
distance
(Kawonga,
2015), South
Africa
They apply structural
and dynamic
methodologies on the
communication network
of GHS and DCP
managers
Healthcare
collaboration
inter-
organization
Dynamics of the
network
51 managers in
two provinces
during 2010-
2011
Dataset: HIV
data collation
and HIV data
use
SNA: density, degree,
betweenness centrality
and E-Index (measure of
homophily)
Block modelling
(Khosla,
2016), USA
They combine SNA and
relational coordination
to measure the quality of
coordination among
HIV agencies
Healthcare
collaboration
inter-
organization
Structural 57 agencies
SNA: density, degree
centralization, weighted
degree centralization,
closeness centrality,
betweenness centrality
Relational coordination:
frequency, timeliness and
accuracy of
communication, problem-
solving communication,
knowledge of agencies'
work, mutual respect and
shared goals
(Wang, 2014),
Australia
They use SNA to
explore the collaborative
network and surgeon
centric collaboration
network to analyze the
impact of collaboration
on the quality and cost
of care
Healthcare
collaboration
inter-
organization
Structural
Health insurance
claims: 59256
admissions
performed by
870 surgeons
SNA: degree centrality,
closeness centrality,
betweenness centrality ,
density, clustering
coefficient, number of
triangles
HEALTHINF 2017 - 10th International Conference on Health Informatics
154

Table 1: A methodological classification of each healthcare application represented in this paper (cont.).
(Bian, 2013),
Arkansas,
United States
They apply structural
and dynamic
methodologies on the
network to identify
leaders and influencers
in a research
collaboration network
Healthcare
research
collaboration
Dynamics of the
network
The
Automated
Research
Information
Administrator
(ARIA) and the
Translational
Research
Institute (TRI)
SNA: measures of
centrality, mean path
length, clustering
coefficient, characteristic
path length, diversity
Temporal evolution:
average number of new
edges, centrality leaders
(Wu, 2015),
China
They use the measure of
centrality to conduct an
SNA on authors,
institutions and
countries collaborating
on psychiatric research
Healthcare
research
collaboration
Structural 36557 papers
about psychiatry
from Science
Ciation Index
Expanded (SCI-
Expanded) in
web of
science
SNA: centrality, K-plex
analysis, Core periphery
Hierarchical clustering
(Goodall,
2014),
Australia
They use Grounded
theory and a
qualitative SNA on the
egocentric network of
individuals and their
sources of information,
and compare the
resulting networks
E-health:
Information
technology
access
Structural Interview with
54 participants
aged 63–94
years
Constructivist grounded
theory method (CGTM)
SNA: egocentric network
(Chomutare,
2014),
Norway
They use structural SNA
to classify people
according to their ability
to lose weight
significantly
E-health:
Social
influence and
behavior
analysis
Structural Binomial classification:
Bayes and decision tree
method
SNA: bipartite graph ,
degree centrality,
betweenness centrality
Expansion-reduction
method
Community detection:
hierarchical clustering
(Pachucki,
2015) USA
They measure the
association between
social interactions and
depressive symptoms
and self-esteem of early
adolescences at a private
K-8 School in the State
of California
E-health:
Behavioral
analysis
Dynamics on the
network
40 students of
sixth-graders at
a private K-8
school
Measures of Social
environment, Health
behaviors ( physical
activity and food choice),
Social interaction
networks, dependent
variables ( self-esteem
and depressive symptoms)
to make bivariate
associations and SNA (
size of personal networks,
transitivity and closeness
centrality)
4 SYNTHESIS AND DISCUSSION
The following table represents the matching between
the categorization of healthcare SNA applications
and the SNA methodologies.
Figure 1 shows that the highest number of the
A Classification of Healthcare Social Network Analysis Applications
155
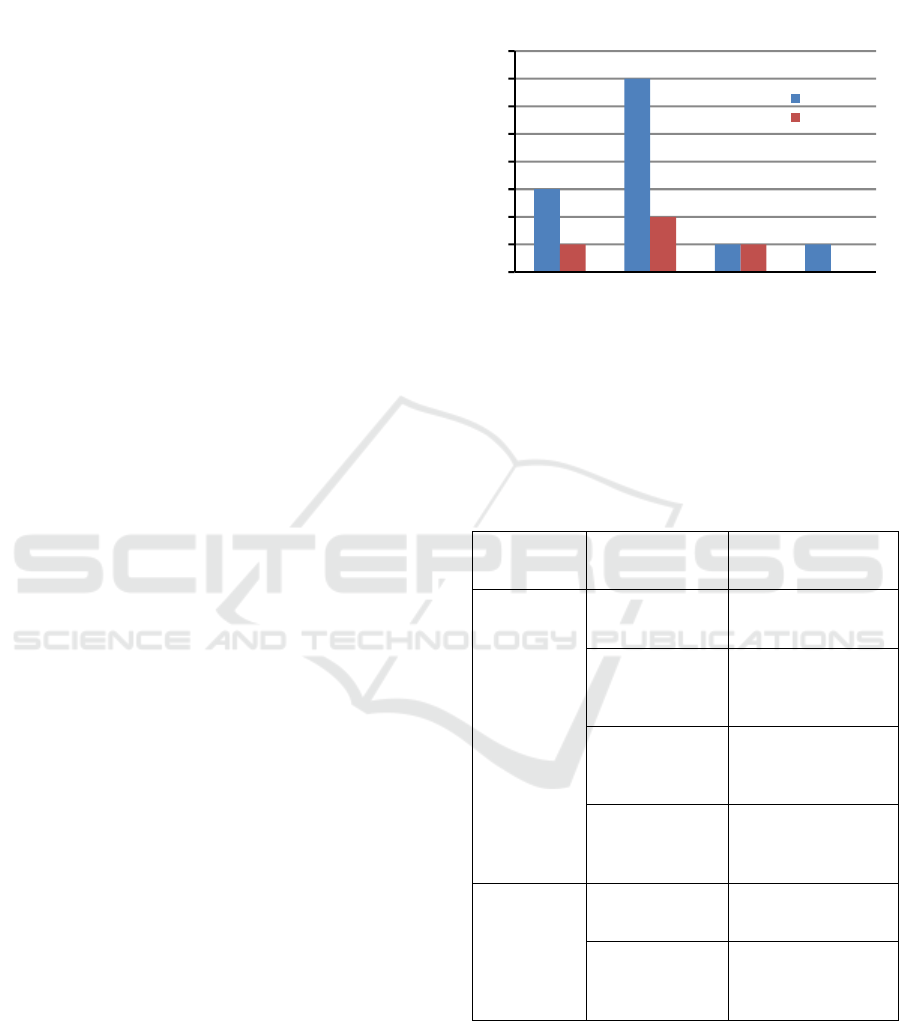
included research works studied healthcare
collaboration and focused on collaboration between
institutions. This might be due to the accessibility of
inter-collaboration data compared to intra-
collaboration data (insurance claims vs. EHRs). E-
health is a new area of SNA application and can thus
present new opportunities to researchers, although
the lack of data especially in low-income countries
may be problematic.
Structural SNA methodologies are the most used,
whereas dynamic methodologies are mainly used in
problems related to healthcare organization (cf.
Table 2). The prevalence of structural analyses could
be due to the complexity of dynamic methodologies
compared to structural ones. Associations between
SNA structural metrics and domain-specific metrics
are however rarely examined; which constitutes a
research question that deserves further attention.
There is also a pressing need to move beyond the
static view of the network, visualized in snapshots,
to a visualization that captures more accurately the
dynamic processes that reshape the network (a
movie-like visualization for instance). Another
research opportunity relates to the application of
dynamics on the network methodologies such as
propagation and diffusion models. While these
methodologies have been exclusively used in
behavioral analysis, they have the potential to
examine the propagation of information in social
networks and uncover hidden processes shaping
collaboration or policy making endeavors.
With respect to data collection, a third of the
included studies gathers data from questionnaires.
This raises data completion issues and inaccuracies
arising from informant bias and stresses the
pertinence of alternative data collection methods
relying on RFID technologies, accelerometers or
EHRs etc. Online social networks (OSN) such as
Facebook, Twitter etc. are widely used nowadays
and can help perform social behavioral analyses. We
can comprehend e-health tools and design future IPC
to promote effective interaction behaviors in OSNs
by correlating interaction behaviors and a specific
disease (Chomutare, 2014). However, many
challenges could face such studies. When SNA
methodologies are used on OSNs’ social data, it is
difficult to distinguish between the effects of
Homophily and those of peer influence. Questions
relating to the sufficiency of collected data and its
representativeness of a given behavior to infer
conclusions remain unanswered. There are also the
pressing issues of privacy and ethics regarding data
collection and which are consequences of the
inherent processes of the social graph's construction
and design. Anonymization, consent and privacy are
among the issues that need further attention.
Figure 1: Number of papers of each healthcare application
and methodological classification (Dynamic, Structural).
Table 2: The SNA methodology used in each healthcare
domain.
Healthcare
categorization
Functional
Sub-categorizing
Methodological
categorization
Healthcare
organization
Health policy
Dynamics of the
network, Structural
Healthcare
collaboration
intra-organization
Structural
Healthcare
collaboration
inter-organization
Structural, Dynamics
of the network
Healthcare
research
collaboration
Dynamics of the
network, Structural
E-heath
Information
technology access
Structural
Social influence
and behavior
analysis
Structural, Dynamics
on the network
Furthermore, social media provides a large
amount of data. The resulting networks are thus very
large and new tools are needed to process them. Big
data network analysis is increasingly drawing the
attention of researchers. However, due to the
complexity of healthcare research problems, further
0
1
2
3
4
5
6
7
8
Health policy
Healthcare
collaboration
Behavior
analysis
Information
technology
Number
of papers
Structural
Dynamic
HEALTHINF 2017 - 10th International Conference on Health Informatics
156

research is needed in order to produce domain-
specific tools.
5 CONCLUSIONS
The purpose of this paper was to propose a
classification of healthcare SNA applications based
on a review of papers that used structural and
dynamic SNA methodologies to answer healthcare-
related research problems. We classified these
research works into two categories: One concerning
healthcare organizations and pertaining to policy
making, communication, and collaboration and a
patient-oriented category which concerns patients’
behaviors, social influence and healthcare
information access.
The proposed classification of healthcare SNA
applications is preliminary and requires further
enrichment through the inclusion of other research
works. The level of adequacy of a chosen SNA
methodology to a given Healthcare research problem
is yet to be examined. Experimental studies will
have to be conducted to establish comparative
analyses between variations of a given methodology
for a particular problem. For instance, different
subsets of metrics can be used and compared for
structural SNA methodologies, various propagation
models can be simultaneously tried for dynamic
SNA methodologies.
REFERENCES
Bullmore, E., & Sporns, O., 2009. Complex brain
networks: graph theoretical analysis of structural and
functional systems. Nature Reviews
Neuroscience,10(3), 186-198.
Lewis, K., Kaufman, J., Gonzalez, M., Wimmer, A., &
Christakis, N., 2008. Tastes, ties, and time: A new
social network dataset using Facebook. com.Social
networks, 30(4), 330-342.
Krempel, L., & Plümper, T., 2003. Exploring the
dynamics of international trade by combining the
comparative advantages of multivariate statistics and
network visualizations. Journal of social structure,
4(1), 1-22.
Klofstad, C. A., Sokhey, A. E., & McClurg, S. D., 2013.
Disagreeing about disagreement: How conflict in
social networks affects political behavior.American
Journal of Political Science, 57(1), 120-134.
Paulo, D., Fischl, B., Markow, T., Martin, M., &
Shakarian, P., 2013. Social network intelligence
analysis to combat street gang violence. arXiv preprint
arXiv:1306.6834.
Rubinov, M., & Sporns, O., 2010. Complex network
measures of brain connectivity: uses and
interpretations. Neuroimage, 52(3), 1059-1069.
Chen, Y. D., Tseng, C., King, C. C., Wu, T. S. J., & Chen,
H., 2007. Incorporating geographical contacts into
social network analysis for contact tracing in
epidemiology: A study on Taiwan SARS data. In
Intelligence and Security Informatics: Biosurveillance
(pp. 23-36). Springer Berlin Heidelberg.
Abraham, A., Hassanien, A. E., & Snâaésel, V. (Eds.).,
2010. Computational social network analysis: trends,
tools and research advances. Springer.
Freeman, L. C., 2004. The development of social network
analysis. Vancouver: Empirical Press.
Wasserman, S., 1994. Social network analysis: Methods
and applications (Vol. 8). Cambridge university press.
Albert, Réka, and Albert-László Barabási, 2002.
"Statistical mechanics of complex networks." Reviews
of modern physics 74.1 : 47.
A.-L. Barabási. Linked: The New Science of Networks.
Perseus Books Group, 2002.
Newman, Mark EJ, 2003. "The structure and function of
complex networks." SIAM review 45.2 : 167-256.
D. Watts. Six Degrees: The Science of a Connected Age.
Norton, 2004.
N. Christakis and J. Fowler. Connected: The Surprising
Power of Our Social Networks and How They Shape
Our Lives. Back Bay Books, 2011. (Scott, 2012).
Scott, John. Social network analysis. Sage, 2012.
Blonder B, Wey T, Dornhaus A, James R, Sih A. 2012. Te
mporal dynamics and network analysis. Meth Ecol
Evol. doi: 10.1111/j.2041-210X.2012.00236.x.
Barabási, Albert-László. "Network science" Cambridge
University Press, Cambridge (August 5, 2016).
Kratzer, J., Leenders, R. T. A., & Van Engelen, J. M.,
2005. Informal contacts and performance in
innovation teams. International Journal of Manpower,
26(6), 513-528.
Shrader, C. B., Dellva, W. L., & McElroy, J. C., 1989.
Social networks and group performance – A partial
test of the Pearce and David hypotheses. International
Journal of Small Group Research, 5(2), 145-162.
Watts, Duncan J.; Strogatz, Steven H., June 1998.
"Collective dynamics of 'small-world' networks".
Nature 393 (6684): 440–442.
McPherson, M., Smith-Lovin, L., & Cook, J. M., 2001.
Birds of a feather: Homophily in social networks.
Annual review of sociology, 415-444.
Barabási, A. L., & Albert, R., 1999. Emergence of scaling
in random networks.science, 286(5439), 509-512.
Bollobás, B., & Riordan, O., 2003. Mathematical results
on scale-free random graphs. Handbook of graphs and
networks, 1, 34.
Louni, Alireza, and K. P. Subbalakshmi, 2014. "Diffusion
of information in social networks." Social Networking.
Springer International Publishing. 1-22.
Bollobás, B., & Riordan, O., 2003. Mathematical results
on scale-free random graphs. Handbook of graphs and
networks, 1, 34.
A Classification of Healthcare Social Network Analysis Applications
157

Louni, Alireza, and K. P. Subbalakshmi, 2014. "Diffusion
of information in social networks." Social Networking.
Springer International Publishing. 1-22.
Granovetter, Mark, 1978. "Threshold models of collective
behavior." American journal of sociology: 1420-1443.
Goldenberg, J., Libai, B., Muller, E, 2001.: Talk of the
network: a complex systems look at the underlying process
of word-of-mouth. Mark. Lett. 12(3), 211–223.
Jackson,M.O, 2008.: Social and Economic Networks.
Princeton University Press.
Steinwachs DM, Hughes RG, 2008. Patient Safety and
Quality: An Evidence-Based Handbook for Nurses,
Hughes RG, editor.
Millard, Colin, Petra Brhlikova, and Allyson Pollock.
2015. 'Social networks and health policy: The case of
misoprostol and the WHO model essential medicine
list', Social Science & Medicine, 132: 190-96.
Takahashi, Yoshimitsu, Tatsuro Ishizaki, Takeo
Nakayama, and Ichiro Kawachi. 2016. 'Social network
analysis of duplicative prescriptions: One-month
analysis of medical facilities in Japan', Health Policy,
120: 334-41.
Bramhachari, Rittika, and Sabyasachi Mandal. 2016. 'a
social network analysis of rural medical practitioners
in the sundarbans, west bengal', BMJ Global Health,
1: A41-A42.
Guo H., Wei F., Cheng S., Jiang F., 2015. Find Referral
Social Networks, International Symposium on Security
and Privacy in Social Networks and Big Data, 58-63.
Soulakis, Nicholas D., Matthew B. Carson, Young Ji Lee,
Daniel H. Schneider, Connor T. Skeehan, and Denise
M. Scholtens. 2015. 'Visualizing collaborative
electronic health record usage for hospitalized patients
with heart failure', Journal of the American Medical
Informatics Association : JAMIA, 22: 299-311.
Caniato, M., T. Tudor, and M. Vaccari. 2015.
'Understanding the perceptions, roles and interactions
of stakeholder networks managing health-care waste:
A case study of the Gaza Strip', Waste Management,
35: 255-64.
Schoen, Martin W., Sarah Moreland-Russell, Kim Prewitt,
and Bobbi J. Carothers. 2014. 'Social network analysis
of public health programs to measure partnership',
Social Science & Medicine, 123: 90-95.
Dianis, Nancy L., Tracy L. Wolbach, and Maura
Spiegelman. 2016. 'The NHLBI–UnitedHealth Global
Health Centers of Excellence Program: Assessment of
Impact of Federal Funding Through a Social Network
Analysis', Global Heart, 11: 145-48.e1.
Kawonga, Mary, Duane Blaauw, and Sharon Fonn. 2015.
'Exploring the use of social network analysis to
measure communication between disease programme
and district managers at sub-national level in South
Africa', Social Science & Medicine, 135: 1-14.
Khosla, Nidhi, Jill Ann Marsteller, Yea Jen Hsu, and
David L. Elliott. 2016. 'Analysing collaboration
among HIV agencies through combining network
theory and relational coordination', Social Science &
Medicine, 150: 85-94.
Wang, F., U. Srinivasan, S. Uddin, and S. Chawla. 2014.
"Application of network analysis on healthcare." In
Advances in Social Networks Analysis and Mining
(ASONAM), 596-603.
Wu, Y., and Z. Duan, 2015. 'Social network analysis of
international scientific collaboration on psychiatry
research', International Journal of Mental Health
Systems.
Bian, J., M. Xie, U. Topaloglu, T. Hudson, and W. Hogan.
2013. "Understanding biomedicai research
collaborations through social network analysis: A case
study." In Bioinformatics and Biomedicine (BIBM),
2013 IEEE International Conference, 9-16.
World health organization 2016. Health topics, e-health,
url: http://www.who.int/topics/ehealth/en/
Chomutare, T., A. Xu, and M. S. Iyengar. 2014. "Social
Network Analysis to Delineate Interaction Patterns
That Predict Weight Loss Performance." In 2014 IEEE
27th International Symposium on Computer-Based
Medical Systems, 271-76.
Pachucki M. C., Ozer E. J., Barrat A., Cattuto C., 2015.
Mental health and social networks in early
adolescence: A dynamic study of objectively-
measured social interaction behaviors. Social Science
and Medecine 125, 40-50.
Goodall, K. T., L. A. Newman, and P. R. Ward. 2014.
'Improving access to health information for older
migrants by using grounded theory and social network
analysis to understand their information behaviour and
digital technology use', European Journal of Cancer
Care, 23: 728-38.
HEALTHINF 2017 - 10th International Conference on Health Informatics
158
