
Determination of Directional Influences of Kinematic Data in the Stance
Period During Running
Giovana Yuko Nakashima
1,4
, Theresa Helissa Nakagawa
2
, Ana Fl´avia dos Santos
3
,
F´abio Viadanna Serr˜ao
3
and Carlos Dias Maciel
4
1
Federal Institute of Education, Science and Technology of S˜ao Paulo, Campus Salto, Rua Rio Branco,
1780, Salto, SP, 13321-271, Brazil
2
Uninorte Laureate International Universities, Avenida Joaquim Nabuco, 1232, Manaus, AM, 69020-031, Brazil
3
Laboratory of Assessment and Intervation in Orthopaedics and Traumatology (LAIOT), Physiotherapy Department,
Federal University of S˜ao Carlos, Rodovia Washington Luiz, km 235, S˜ao Carlos, SP, 13565-905, Brazil
4
Laboratory of Signal Processing (LPS), Electrical and Computer Engineering Department, University of S˜ao Paulo,
Avenida Trabalhador S˜ao-carlense, 400, S˜ao Carlos, SP, 13566-590, Brazil
Keywords:
Partial Directed Coherence, Kinematics, Knee.
Abstract:
The study of the interactions among elements of a system is decisive to understanding their behavior patterns.
The knowledge of the details of human motion allows physiotherapists to propose prevention and rehabilitation
programs, as well as to identify movements that could lead to an injury. This work examines Partial Directed
Coherence measures to determine the direction of the influences, throughout the stance phase only, among
kinematic joints data acquired during the running activity. Five channels of the ankle, knee, hip, pelvis and
trunk kinematic data were processed in each of the three anatomical planes, sagittal, frontal and transverse.
These analysis suggested that the ankle joint receives a intense proximal to distal influence, whereas the knee,
hip, pelvis and trunk joints presents a predominance of distal to proximal interaction.
1 INTRODUCTION
In many biomedical systems, the knowledge of the in-
teractions among the structural elements plays a key
role to understand their connectivity architecture. In
this way, the direction of the information flow is an as-
pect of great interest, since it could improve the inter-
pretation of the dynamics present (Blinowska, 2011).
Physical therapists deal with human motion and
are especially concerned with movement disorders
that could lead to injuries. This study focused on
running, a commom physical activity which involves
more than 38 million Americans (NSGA, 2011). This
sport presents potential risk to injury that comes with
the exponential growth. It is estimated an incidence
higher than 70% of musculoskeletal injury each year
among runners (Ferber et al., 2009). The knee is the
most affected site (Ferber et al., 2009).
The interactions of the joint kinematic during run-
ning are complex and not yet fully understood (Pandy
and Andriacchi, 2010). There is a hypothesis that
proximal segments (i.e, trunk, pelvis and hip) could
influence the distal’s ones (i.e knee) and vice-versa
(Powers, 2003); (Hewett and Myer, 2011). A better
comprehension of the interjoint movement coordina-
tion could improve knee injury treatment and preven-
tion programs.
In this study, multi-joints recordings of 3D joint
kinematics generated a huge amount of biomedical
data of thirty subjects. Although (Nakashima et al.,
2014) analyzed kinematic data with Partial Directed
Coherence (PDC) covering all the running trial, in-
cluding stance and swing phases, most running in-
juries occurs during the ground contact when the lo-
comotor system must dissipate the ground reaction
force (Cavanagh and Lafortune, 1980). The impact
peak during each step is equivalent to 2-3 times of the
body weight (Lieberman et al., 2010). So our aim was
to examine directional influences of the 3D joint kine-
matics data of the trunk, pelvis, hip, knee and ankle
acquired during a usual running, with the PDC ap-
proach considering only the stance phase events, that
is, the target of the analysis are the parts of the signal
when ground contact occurred.
PDC is a frequency domain approach of the
Granger-Geweke Causality (GGC) method (Jo-
Nakashima G., Nakagawa T., dos Santos A., SerrÃ
ˇ
co F. and Maciel C.
Determination of Directional Influences of Kinematic Data in the Stance Period During Running.
DOI: 10.5220/0006167701930197
In Proceedings of the 10th International Joint Conference on Biomedical Engineering Systems and Technologies (BIOSTEC 2017), pages 193-197
ISBN: 978-989-758-212-7
Copyright
c
2017 by SCITEPRESS – Science and Technology Publications, Lda. All rights reserved
193

vanovi´c et al., 2013). PDC determines the direct con-
nection strength between two distinct signals (Fasoula
et al., 2013). According to (Baccala et al., 2016),
PDC proposes a direct path of influence, indicating
the structures that are adjacents. Many of the PDC
studies is in neural structures, where the aim is to de-
termine the brain connectivity patterns (G¨urkan et al.,
2014); (Jovanovi´c et al., 2013); (Varotto et al., 2012).
This work follows this description. The Theory
Section introduces the framework of pairwise PDC
approach. The Material and Methods Section de-
scribes the participants of the study, 3D joint kine-
matic data acquisition process details and their pro-
cessing procedures. In Result Section, three distinct
graphs present the PDC values computed, one for
each of the three anatomical planes: sagittal, frontal
and transverse. The Discussion and Conclusion Sec-
tion compares the results with interpretations of the
literature.
2 THEORY
Granger Causality (GC) method applies the linear re-
gression model in a pairwise analysis of two station-
ary stochastic processes. The main idea of GC is that
if the prediction of a time series x
1
could be improved
by including the past terms of a time series x
2
, then
x
2
is said to cause x
1
(Blinowska, 2011). Specifically,
x
1
is estimated using only previous values of the se-
ries x
1
, and then x
1
is estimated including previous
values of the series x
2
. In both estimations, two ma-
trices are computed: the autoregressive (AR) coeffi-
cients matrix and the covariance matrix of the noise
terms. Thus, comparing the variances of the AR pre-
diction error of x
1
before and after including the series
x
2
, the improvement of the prediction is determined
by the decrease of the variance with past values of x
2
(Blinowska, 2011).
Multivariate formulation and spectral form of GC
were stated by GGC (Jovanovi´c et al., 2013), where
the multivariate autoregressive(MVAR) model is esti-
mated and the causal influence between two channels
is computed from the spectral density matrix (Fasoula
et al., 2013).
As an adaptation of GGC, Directed TransferFunc-
tion (DTF) is a causality measure in frequency do-
main (Jovanovi´c et al., 2013) that describes direct and
cascade influences (Blinowska, 2011), that is, DTF
describes the influence direction including indirect
propagation, when the interaction flows through inter-
mediate elements (Baccala et al., 2016). Thus, if there
is a propagation from 1 to 2 and from 2 to 3, DTF
presents influence from 1 to 3 (Blinowska, 2011).
PDC was introduced by (Baccal´a and Sameshima,
2001) as a normalized measure (Jovanovi´c et al.,
2013) and sets a pairwise analysis of directional inter-
actions in an n-dimensional random process X(t) =
[x
1
(t), x
2
(t), ..., x
n
(t)]
T
(T denotes matrix transposi-
tion). Assume that the Eq. 1 is the MVAR represen-
tation of the process X(t), where p is the model or-
der, A(r) are the MVAR estimative coefficient matri-
ces and E(t) = [e
1
(t), e
2
(t), ..., e
n
(t)]
T
is a zero mean
white noise vector.
X(t) =
p
∑
r=1
A(r)X(t − r) + E(t) (1)
Each A(r) matrix is formed by a
ij
(r) elements that
represent the lagged effect of the j − th on the i− th
series.
Applying Fourier transform in Eq. 1,
A
′
( f)X( f) = E( f) (2)
where A
′
( f) (Eq. 4) is calculated from A( f), the fre-
quency domain representation of A(r), given by
A( f) =
p
∑
r=1
A(r)e
−ir2π f
(3)
A
′
( f) = I − A( f) (4)
(Baccal´a and Sameshima, 2001) denotes PDC, di-
rect influence from x
j
to x
i
at frequency f as in the
Eq. 5, where a
′
k
( f) is the k
th
column of A
′
( f). In the
Eq. 4, I is the identity matrix and in Eq. 5, H denotes
Hermitian matrix.
π
ij
( f) =
A
′
ij
( f)
q
a
′
H
j
( f)a
′
j
( f)
(5)
3 MATERIAL AND METHODS
3.1 Subjects
In this study, thirty recreational runners participated
(mean (SD); age 27.67 (5.43) years, mass 72.05
(13.61) kg, height 1.73 (0.09) m, average running dis-
tance 35.70 (18.25) km/week and running experience
4.13 (4.02) years). They were familiar with treadmill
running and ran a minimum of 20km/week at least 3
months prior to study enrollment. The presence of
bone, joint, and ligament injury for at least 3 months
prior the assessment, lower limb surgery, pain in the
ankle, knee, hip or trunk while running or wearing or-
thotics that could interfere with their running pattern
BIOSIGNALS 2017 - 10th International Conference on Bio-inspired Systems and Signal Processing
194

were the exclusion criteria. The subjects were evalu-
ated by a licensed physical therapist to screen for the
inclusion and exclusion criteria. The testing protocol
was approved by the Federal University of S˜ao Car-
los Ethics Committee for Human Investigations, and
the subjects signed a written informed consent form
to participate in this study.
3.2 Data Acquisition Procedure
The session started with a 5-minute warm-up on a
treadmill (model LX 160 GIII, Movement, Manaus,
Brazil) at 1.38 m/s. Next, the subjects were instructed
to start running at a comfortable speed, determined by
the volunteer and adjusted by the assessor for 2 min-
utes. A neutral running shoe (Asics Gel-Equation 5,
ASICS, Kobe, Japan) wasprovidedfor all the runners.
The kinematic data of the dominant lower limb
and trunk were recorded at 240 Hz during running
with a six-camera Qualisys motion analysis system
(Qualisys Inc., Gothenburg, Sweden). Twenty re-
flective markers located on anatomical landmarks and
five cluster tracking markers were placed on each sub-
ject. Each running trial was performed for 1 minute
and 30-s and samplings of data were collected without
informing subjects about the exact moment of sam-
pling or the variables studied.
The Cardan angles were calculated using the joint
coordinate system definitions recommended by the
International Society of Biomechanics (Wu et al.,
2002) relative to the static standing trial using the Vi-
sual 3D software (C-Motion Inc, Rockville, MD). The
kinematic data were filtered with the Visual 3D soft-
ware using a fourth order, zero lag, low-pass Butter-
worth filter at 12 Hz. For each plane (X - sagittal, Y -
frontal and Z - transverse), five joints were collected:
ankle, knee, hip, pelvis and trunk.
3.3 Data Processing
As the first step, data from all the 30 volunteers were
processed in order to separate their stance phases,
and, from these periods, PDC values were computed.
3.3.1 Stance Phases
Stance phases of the kinematic data were defined
based on heel strike and toe-off. Heel strike was iden-
tified as the velocity inversion (positive to negative)
of heel marker in frontal plane (Y) (Zeni et al., 2008).
Toe-off was determined by the second peak knee ex-
tension (sagittal plane) (Fellin et al., 2010). Thus, for
each stance phase, there were two points identified,
one for the beginning (heel strike) and another for the
ending (toe-off) of the period.
3.3.2 PDC
The kinematic data were processed by an app de-
veloped in Python 2.7.4 (Python Software Founda-
tion, USA), running on Intel Core i5 (Intel Corpora-
tion, USA) CPU at 1.70GHz, 4 GB RAM and Ubuntu
13.04 operating system (Canonical Ltd., UK). As a
preprocessing step, each data channel was normalized
by its root mean square (RMS).
The estimation of the AR coefficients matrix used
the periods of stance already established as different
observations of the system. Thus, from the heel strike
point until the toe-offpoint of one stance event, a time
window was set. The values of the 15 channels in
that time window was included to determine the best
Bayesian Information Criterion (BIC) value and then
the AR model estimative. A visual selection by reg-
ularity in data was done to analyze the stationarity of
the signals.
The function developed to identifying the best
BIC value took into account values from 1 to the min-
imum number of points of the stance phases of the
individual running trial. Therefore the number of or-
der tests was diversified among the subjects, because
each one had different points number.
PDC values were computed taking the channels in
pairs. The highest one was used to represent the inter-
action between two channels of a subject. The influ-
ence of the thirty subjects was evaluated by the mean
value of the group. Distal to proximal and proximal to
distal influences were analyzed by anatomical plane
between each pair of joints. To determine whether the
influence was distal to proximal or proximal to distal,
the T-Test was applied with 5% of significance under
the null hypothesis that the means of that two types of
influences were equal.
At each relevant step, intermediate files were
saved, such as the stance phases, the orders analyzed
to determinate the best BIC value, the PDC values
themselves, including the resumed ones and the di-
rected graphs.
4 RESULTS
The process of dividing the entire running trial in
stance phases generated 35 periods and 73 points per
period, on average, both for the entire group. There-
fore, an average of more than 30 observations were
used to compute the PDC values.
The best BIC order accepted was between 1 and
5, depending on the number of points of the stance
phases of the subject, since the procedure tested val-
ues from 1 to the minimum of that number of points.
Determination of Directional Influences of Kinematic Data in the Stance Period During Running
195
In average, the routine for determining the best BIC
order computed the AR estimative up to order 77, the
mean of the minimum number of points.
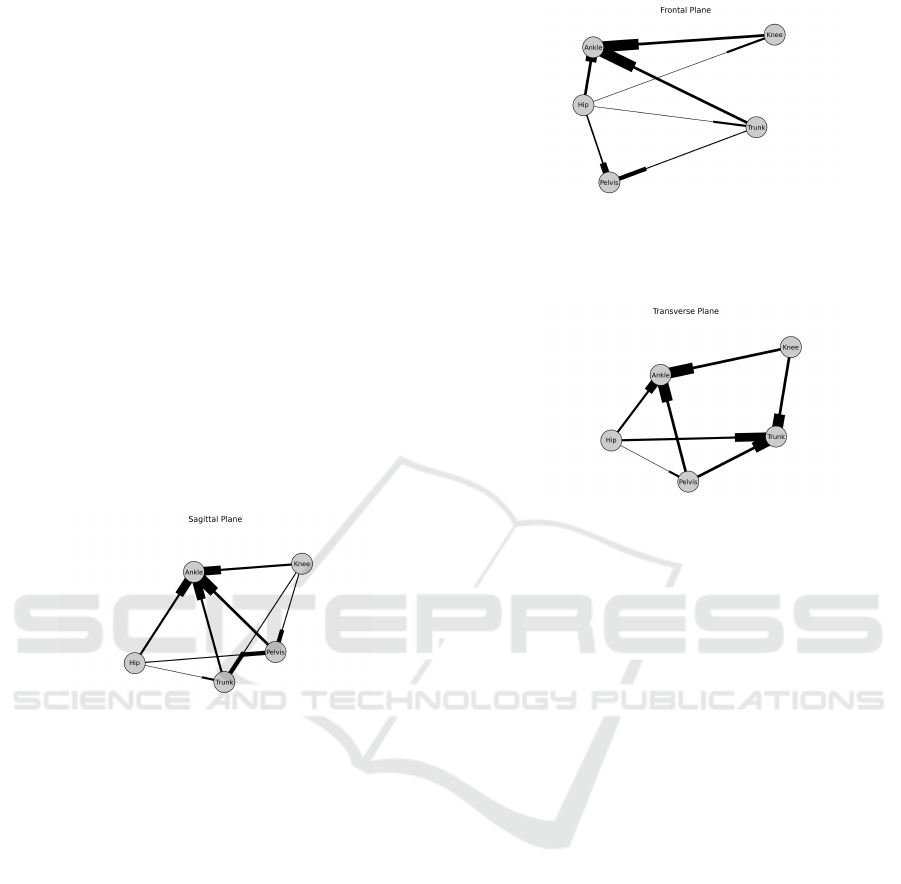
The resumed PDC values were presented in three
directed graphs, for each anatomical plane. Thus, in
one graph, there are five nodes, representing the kine-
matic joints in that plane. The interactions are be-
ing illustrated by edges where thicker stubs are the
arrows. Moreover, the thickness of the edges denotes
the strength of the influence. Therefore, in Fig. 1,
the edge between nodes ”Ankle” and ”Trunk” shows
an influence from ”Trunk” to ”Ankle”, and its PDC
value is higher than between ”Hip” to ”Pelvis”. There
is only one direction between two nodes, the higher
value chosen from the distal to proximal or proximal
to distal influences mean values, when there was a sta-
tistical difference indicated by the T-Test.
In the sagittal plane, ankle received the strongest
influences. Also, Fig. 1 shows that pelvis and trunk
are highly influenced too. Instead, knee and hip are
sources of influences.
Figure 1: Directional influences of the 3D kinematic data
during running, in sagittal plane. Nodes are the kinematic
joints (ankle, knee, hip, pelvis and trunk). Each edge rep-
resents the mean value from the thirty subjects computed
from the individual maximum PDC, and its thickness is the
strength of the influence. Thicker stubs represent arrows.
In frontal plane, ankle remains as the most influ-
enced channel. As Fig. 2 presents, pelvis still receives
a substantial influence from hip and less strong inter-
actions from knee and trunk. Hip stays as a source of
influences.
Transverse plane (Fig. 3) presents ankle and trunk
as the receivers with the highest PDC. Pelvis is des-
tination of intermediate influence, and hip persists as
an essential source of interactions.
5 DISCUSSION AND
CONCLUSION
The aim of this work was the analysis of the direc-
tion of influence of the kinematic data, considering
Figure 2: Mean values computed from individual maximum
PDC, in frontal plane, during running. As in Fig. 1, nodes
are the kinematic joints of ankle, knee, hip, pelvis and trunk.
Thicker stubs represent arrows.
Figure 3: Mean values computed from individual maximum
PDC, during running, in transverse plane. Also, nodes are
the kinematic joints of ankle, knee, hip, pelvis and trunk.
Thicker stubs represent arrows.
only the stance phase, during running, by the PDC
approach.
To the best of the authors knowledge, no study as-
sessed the direction of interaction flow of 3D kine-
matics of the ankle, knee, hip, pelvis and trunk cov-
ering stance phases during running. In (Nakashima
et al., 2014), the kinematic channels of one subject
were analyzed during the entire running cycle, with-
out any stance phase separation.
In fact, the hypothesis that there was a marked
proximal to distal influence to ankle motion indicated
in (Nakashima et al., 2014) was confirmed in this
study with a larger sample size, even analyzing specif-
ically the stance phase. Our data is also supported by
(Mackinnon and Winter, 1993) that hypothesized that
the trunk and hip motion could influence the ankle
motion during walking.
Interestingly, the hip influenced the most proxi-
mal (pelvis and trunk) and distal joints (ankle and
knee), supporting the importance of the core stabil-
ity to control de movements of the extremities (Peters
and Tyson, 2013); (Noehren et al., 2013). The trunk
joint was especially influenced in the sagittal and the
transverse planes. The pelvis joint received impor-
tant influences in sagittal and frontal planes. In frontal
plane, (Mackinnon and Winter, 1993) indicated an in-
fluence from the hip and (Powers, 2003) suggested an
effect from the knee.
BIOSIGNALS 2017 - 10th International Conference on Bio-inspired Systems and Signal Processing
196

The next step is to analyze results from general-
ized PDC (gPDC), a variation of PDC that deal with
time series with different variances (Taxidis et al.,
2010).
These analyses can expose the directional influ-
ence patterns that may help physiotherapists to dis-
tinguish normal movements from altered ones during
running and to propose treatment running techniques,
prevention and rehabilitation programs.
ACKNOWLEDGEMENTS
This work was supported by CNPq project
475064/2013-5.
REFERENCES
Baccal´a, L. A. and Sameshima, K. (2001). Partial Directed
Coherence: a new concept in neural structure determi-
nation. Biological cybernetics, 84(6):463–74.
Baccala, L. A., Takahashi, D. Y., and Sameshima, K.
(2016). Directed Transfer Function: Unified Asymp-
totic Theory and Some of its Implications. IEEE
Transactions on Biomedical Engineering, (2):1–1.
Blinowska, K. J. (2011). Review of the methods of deter-
mination of directed connectivity from multichannel
data. Medical and Biological Engineering and Com-
puting, 49(5):521–529.
Cavanagh, P. R. and Lafortune, M. A. (1980). Ground Re-
action Forces in Distance Running. J. Biomechanics,
13(5):397–406.
Fasoula, A., Attal, Y., and Schwartz, D. (2013). Compar-
ative performance evaluation of data-driven causality
measures applied to brain networks. Journal of Neu-
roscience Methods, 215(2):170–189.
Fellin, R. E., Rose, W. C., Royer, T. D., and Davis, I. S.
(2010). Comparison of methods for kinematic iden-
tification of footstrike and toe-off during overground
and treadmill running. J Sci Med Sport, 13(6):646–
650.
Ferber, R., Hreljac, a., and Kendall, K. D. (2009). Sus-
pected Mechanisms in the Cause of Overuse Running
Injuries: A Clinical Review. Sports Health: A Multi-
disciplinary Approach, 1(3):242–246.
G¨urkan, G., Akan, A., and Seyhan, T.
¨
O. (2014). Analysis
of brain connectivity changes after propofol injection
by generalized partial directed coherence. Digital Sig-
nal Processing, 25:156–163.
Hewett, T. E. and Myer, G. D. (2011). The mechanistic con-
nection between the trunk, knee, and anterior cruciate
ligament injury. Exerc Sport Sci Rev, 39(4):161–166.
Jovanovi´c, A., Perovi´c, A., and Borovˇcanin, M. (2013).
Brain connectivity measures: computation and com-
parison. EPJ Nonlinear Biomedical Physics, 1:2.
Lieberman, D. E., Venkadesan, M., Werbel, W. a., Daoud,
A. I., D’Andrea, S., Davis, I. S., Mang’eni, R. O., and
Pitsiladis, Y. (2010). Foot strike patterns and colli-
sion forces in habitually barefoot versus shod runners.
Nature, 463(7280):531–535.
Mackinnon, C. D. and Winter, D. A. (1993). Control of
whole body balance in the frontal plane during human
walking. J Biomechanics, 26(6):633–644.
Nakashima, G. Y., Nakagawa, T. H., Dos Santos, A. F.,
Serr˜ao, F. V., and Maciel, C. D. (2014). Partial Di-
rected Coherence applied in physiotherapy data. In
ISSNIP Biosignals and Biorobotics Conference, BRC,
volume 1, Salvador.
Noehren, B., Hamill, J., and Davis, I. (2013). Prospective
Evidence for a Hip Etiology in Patellofemoral Pain.
Med. Sci. Sports Exerc, 45(6):1120–1124.
NSGA, N. S. G. A. (2011). Sports participation 2008.
Sports Participation Web site.
Pandy, M. G. and Andriacchi, T. P. (2010). Muscle and
joint function in human locomotion. In Annual review
of biomedical engineering, volume 12, pages 401–33.
Peters, J. S. and Tyson, N. L. (2013). Proximal exercises are
effective in treating patellofemoral pain syndrome: a
systematic review. The International Journal of Sports
Physical Therapy, 8(5):689–700.
Powers, C. M. (2003). The influence of altered lower-
extremity kinematics on patellofemoral joint dysfunc-
tion : a theoretical perspective. Journal of Or-
thopaedic & Sports Physical Therapy, 33:639–646.
Taxidis, J., Coomber, B., Mason, R., and Owen, M. (2010).
Assessing cortico-hippocampal functional connectiv-
ity under anesthesia and kainic acid using general-
ized partial directed coherence. Biological cybernet-
ics, 102(4):327–40.
Varotto, G., Visani, E., Canafoglia, L., Franceschetti, S.,
Avanzini, G., and Panzica, F. (2012). Enhanced fron-
tocentral EEG connectivity in photosensitive general-
ized epilepsies: a Partial Directed Coherence study.
Epilepsia, 53(2):359–367.
Wu, G., Siegler, S., Allard, P., Kirtley, C., Leardini, A.,
Rosenbaum, D., Whittle, M., D’Lima, D. D., Cristo-
folini, L., Witte, H., Schmid, O., and Stokes, I. (2002).
ISB recommendation on definitions of joint coordi-
nate system of various joints for the reporting of hu-
man joint motion - part I: ankle, hip, and spine. Jour-
nal of Biomechanics, 35:543–548.
Zeni, J. A., Richards, J. G., and Higginson, J. S. (2008).
Two simple methods for determining gait events dur-
ing treadmill and overground walking using kinematic
data. Gait and Posture, 27(4):710–714.
Determination of Directional Influences of Kinematic Data in the Stance Period During Running
197
