
Randles Model of Vitreous Humor
Tjerignimin Silue, Saugandhika Minnikanti and Nathalia Peixoto
Electrical and Computer Engineering, George Mason University, Fairfax, VA, U.S.A.
Keywords: Vitreous Humor, Stainless Steel Electrodes, Electrochemistry, Characterization, Cyclic Voltammetry,
Electrochemical Impedance Spectroscopy, Randles Model.
Abstract: The vitreous is a gel-like structure found in the eyes. It is located above the retina to prevent the passage of
fluids. As aging occurs, the vitreous can liquefy and can cause retinal detachment. The literature has little
characterization of the vitreous, as it is often a less interesting structure than the retinal tissue. We
investigate the impedance properties of the stimulation electrodes such as the constant phase element (Q)
and the resistance of the solution (R
sol
). We show results on vitreous characterization through
electrochemical methods as a first step toward understanding the role of electrical stimulation in retinal
prosthetics applications as it pertains to vitreous liquefaction. Our objective is to characterize the vitreous
for a wide frequency range and to determine how charge is distributed through its conductive structure. Our
electrochemical experiments were performed using insulated stainless steel electrodes (1) in phosphate
buffered saline (PBS) and (2) in thimerosal as controls, (3) in vitreous without thimerosal, as well as (4) in
vitreous preserved with thimerosal. We also performed cyclic voltammetry to measure the cathodic charge
storage capacity for the electrodes for all experimental groups. Our results showed that the resistivity of the
vitreous increases as thimerosal is added and that the cathodic charge storage capacity of the vitreous does
not show any significant difference in the means as thimerosal is added.
1 INTRODUCTION
Retinal prostheses for the blind are in clinical trials
world-wide. Each retinal prosthesis attempts to
position the stimulus electrode array in close
proximity to the retina in order to effectively
activate the remaining retina neural circuitry (Majdi
et al., 2014). Stimulus pulses can be remarkably
attenuated by resistive and capacitive barriers in the
eye wall as well as the vitreous (Majdi et al., 2014),
which in some cases could prevent effective
activation of the retinal tissue. Poorly placed
electrode arrays can lose charge through this gel like
conductive structure called the vitreous humor.
The vitreous humor is a virtually acellular, jelly
adhesive-like, highly hydrated extracellular
substance located above the retina to prevent rapid
passage of fluid into holes which may exist in the
retina (Joseph, 1990). A network of thin unbranched
collagen fibrils that are mixed in composition,
comprising collagen types II, V/XI and IX,
maintains the gel-like structure in a rabbit model
(Bishop, 2000). The vitreous humor contains two
chemically specific proteins: mucoid and vitrein.
The mucoid fills the gap of the micelles of the
vitrein, which prevents it from diffusing away. The
chemical distribution of the vitrein in the vitreous
humor suggests that the vitreous humor is not
strictly a uniform gel and that the vitreous
membrane is composed of vitrein (Krause, 1934).
During ageing, the gel can liquefy. In about 30%
(Bishop, 2000) of the population, the residual gel
structure eventually collapses away from the
posterior retina in a process called vitreous
detachment. This process plays an important role in
a number of common blinding conditions including
rhegmatogenous retinal detachment, proliferative
diabetic retinopathy and macular hole formation
(Bishop, 2000). Thus, understanding molecular
events underlying vitreous liquefaction and vitreous
detachment may lead to new retinal prostheses to
improve retina degenerative diseases caused by
vitreous detachment.
Retinal prostheses are implants with custom
circuits that electrically stimulate retinal cells
through electrodes. Recent results point to
confounding variables that might have been
overlooked as significant in earlier designs such as
the influence of the vitreous humor (Shah et al.,
2007). For example, sticking of the vitreous to the
156
Silue T., Minnikanti S. and Peixoto N.
Randles Model of Vitreous Humor.
DOI: 10.5220/0006166001560162
In Proceedings of the 10th International Joint Conference on Biomedical Engineering Systems and Technologies (BIOSTEC 2017), pages 156-162
ISBN: 978-989-758-216-5
Copyright
c
2017 by SCITEPRESS – Science and Technology Publications, Lda. All rights reserved

retina may change the impedance seen by the
electrodes when they are positioned at the surface of
the retina. Recent studies examined the electrical
properties of the retinal-electrode interface and
showed that the tissue resistance of the retina is
greater than that of the vitreous humor in the eye but
little is known about the electrical behavior of the
vitreous humor (Shah et al., 2007). In order to
perform experiments of reasonable length in any
biological tissue, traditionally the tissue is kept in
media. For vitreous humor, previous research has
demonstrated that the use of a preservative does not
impact viscosity or other morphological
characteristics of the sample (Kawano et al, 1982).
Thimerosal is a methiolate sodium used in vaccines.
In retinal research, thimerosal in a concentration of
0.005% is added in a small quantity (1 µl) to the
vitreous for long-term observations. The addition of
thimerosal at this concentration does not affect the
viscosity of the vitreous (Kawano et al., 1982) which
will be shown through vitreous characterization
using electrochemical methods as a first step toward
understanding its role during electrical stimulation in
retinal prosthetics applications.
The objective is to investigate methods to
reliably determine the characteristics of the vitreous
from a stimulation electrode to the sample tissue
extracted from rabbit eyes. As previously stated,
characterizing the vitreous will aid in the
determination of the conductivity of the structure,
the location of the electrode within the eye, during
the implant period. Both of these variables are
critical for the long term success of implants.
Currently available technology will be used and we
hypothesized that, by measuring and analyzing
impedance and charge delivery, we can establish the
electrochemical characterization of the vitreous
humor.
We will investigate how the impedance
properties of the stimulation electrodes. In order to
determine which factors influence the impedance,
experimental data will be fitted to a Randles model
and evaluated from the physical characteristics
perspective. Solution resistance, charge transfer
resistance, and constant phase elements, when taken
together, determine the interface between the
electrode and the electrolyte. The model can, in the
future, be scaled to determine impedance models of
the human eye can be used to demonstrate the
effects of stimulation waveforms on the tissue.
In this study, we measured the electrical
properties of the vitreous of the rabbit eye with
implantable electrodes. We studied the
electrochemical impedance spectroscopy of stainless
steel electrodes of 250 µm diameter, insulated with
Teflon (10 µm). We tested the impedance of the
electrodes in four different scenarios: (1) in
phosphate buffered saline (PBS), (2) in thimerosal
(an organomercury compound), (3) in vitreous
without thimerosal; as well as (4) in vitreous with
thimerosal. We also performed cyclic voltammetry
and measured the cathodic charge storage capacity
for the electrodes for all experimental groups.
Several electrical equivalent models were tested and
fitted to the data to describe the physical system and
provide insight into the actual model for the
vitreous. We hypothesized that vitreous with and
without thimerosal would therefore not change its
electrical characteristics, given the low
concentration of the preservative.
2 METHODS
Here we describe the utilized substrates and the
electrochemical methods that were applied in order
to characterize the vitreous samples.
2.1 Preparation of Vitreous and
Solutions
A 1 ml of vitreous humor, stored in a 2 ml vial, was
bought from a biological supply company
(BioChemed Services, Winchester, VA).
Thimerosal was acquired from Sigma-Aldrich (St.
Louis, MO). A 0.005% of thimerosal solution was
prepared with 5 mg of thimerosal (C9H9HgNaO2S)
dissolved in 100 ml of distilled water. 1 µl of the
prepared 0.005% thimerosal solution was added to
the extracted vitreous for preservation according to
Kawano et al (Kawano et al., 1982). The final
concentration of thimerosal in vitreous humor is
5x10
-5
mg/ml.
2.2 Electrochemical Measurements
We manufactured clinically relevant stainless steel
electrodes of 250 µm core-diameter, insulated with
Teflon (10 µm) and characterized their
electrochemical behavior in phosphate buffered
saline, thimerosal and in vitreous. The electrode is
micromanipulated and positioned in the vitreous
sample, and electrochemical measurements were
simultaneously taken. We recorded electrochemical
impedance spectroscopy (EIS) and cyclic
voltammetry (CV).
A high efficiency, research-grade potentionstat
designed for fast and low-current measurements
Randles Model of Vitreous Humor
157
(Reference 600+, Gamry, Warminster, PA) was used
to perform measurements for the electrochemical
characterization of the vitreous humor.
Electrochemical Impedance Spectroscopy (EIS) and
Cyclic Voltammetry (CV) was performed. To
achieve EIS, a frequency response analyzer (FRA) is
used to impose an AC signal to a cell. The AC
voltage and current response of the cell is analysed
by the FRA to determine the resistive, capacitive and
inductive behaviour - the impedance - of the cell at
that particular frequency (Loveday et al., 2001). On
the other hand, CV is achieved by cycling potential
to measure current. Characterization of the vitreous
humor as well as the stainless steel electrode was
performed in Phosphate Buffer Saline (PBS) and in
the 0.005% thimerosal solution. The stainless steel
electrodes were scanned from 1 Hz to 100 kHz for
the EIS measurements and the CV curves were ran
for 5 cycles at a scan rate of 100 mV/s. In addition,
impedance spectra and CV of the stainless steel
electrodes were performed in thimerosal diluted
(0.005 %) in PBS and water. This was undertaken to
investigate the properties of thimerosal and its effect
on the electrodes.
For the purpose of our experiment, a two
electrode setup was employed to measure the
potential across the cell where the counter and
reference terminals of the potentiostat were shorted
and connected to an Ag/AgCl wire. The working and
working sense were connected to a stainless steel
wire electrode (250 µm in diameter, n = 5) for EIS
and CV measurements of the vitreous humor (figure
1).
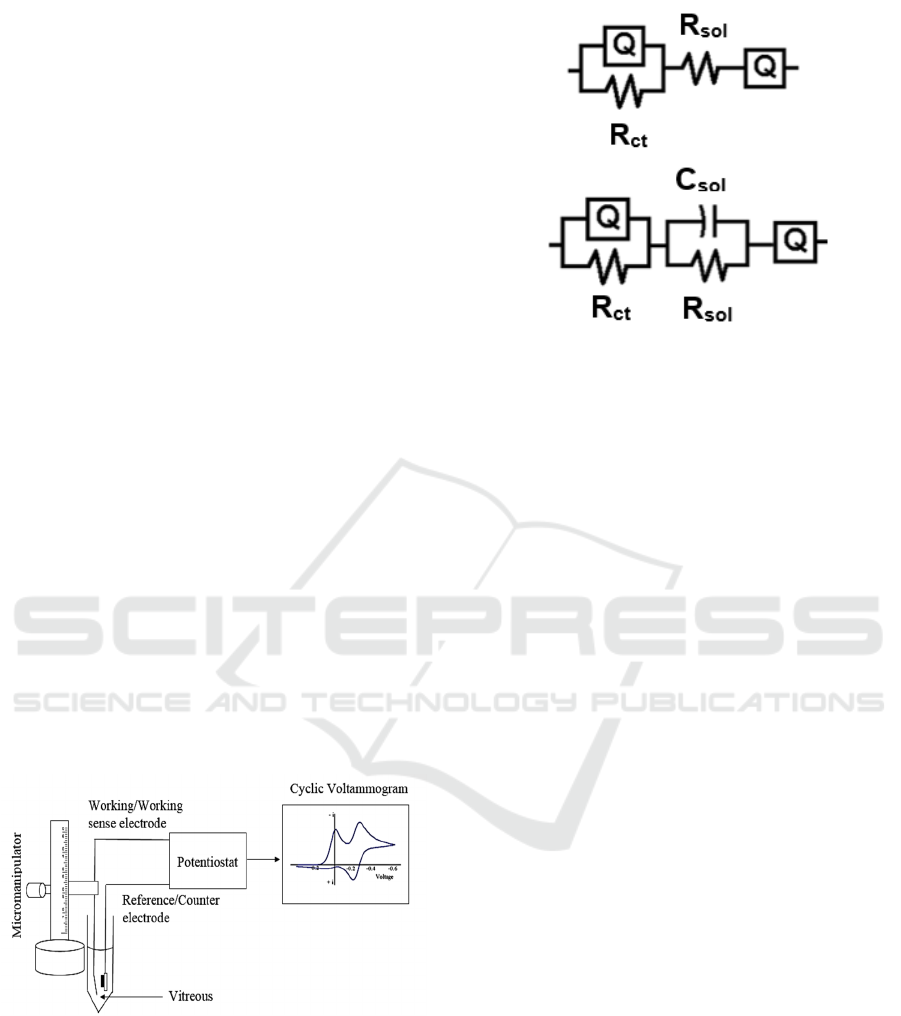
Figure 1: Schematic of experimental setup.
2.3 Data Analysis
The electrode is modelled by a Randles circuit,
shown in figure 2, containing a constant phase
element, indicated by (Q), and modelled as a non-
linear capacitor which maintains the phase
difference between current and voltage constant
Figure 2a: Equivalent circuit model for PBS, vitreous,
vitreous w/ thimerosal (distilled water) and thimerosal w/
PBS.
Figure 2b: Equivalent circuit model for thimerosal w/
distilled water.
throughout the frequency spectrum. The constant
phase element is parallel to a resistor (R
ct
), and these
two elements are commonly called pseudo-
capacitance or polarization impedance in electrodes.
The solution resistance of the vitreous, which is
mainly water, is denoted by R
sol
. The Randles circuit
was generated for measuring the impedance between
the electrode and ground, we applied a small (10
mVrms) sinusoidal wave of varying frequency, and
measure the current through the circuit, that is,
between the electrode and the Ag/AgCl wire.
Reference and counter electrodes are shorted, given
the low currents involved. The modulus of the
measured impedance is then the amplitude
difference between the applied voltage and
measured current, and the phase angle of the
impedance is the phase difference of both sinusoidal
waves. By applying this method from 1 Hz to 100
kHz one obtains Nyquist and Bode plots (modulus
and phase) of the combined impedance of the whole
system: electrode, insulation, solution resistance.
ZSimpWin (EChem Software, Ann Arbor, MI)
was used to develop the Randles circuit model
(figure 2) from the EIS data. ZSimpWin employs the
down-hill simplex method for optimizing the fits.
Data were exported as text files from the Echem
Analyst software (Gamry Instruments, Warminster,
PA). The models presented with visual fit to Bode,
Nyquist, real, and imaginary impedance values
versus frequency plots, chi-squared value (χ
2
) <
10×10
-4
, relative standard errors < 15% and non-
trending residual plots. As a two- electrode set up
was employed, the measured EIS data will reflect
a
b
BIODEVICES 2017 - 10th International Conference on Biomedical Electronics and Devices
158
the properties of the working electrode (WE), of the
media, and of the reference electrode (RE). Initially,
impedance spectra obtained from PBS was fit to the
model. The electrodes were modelled as a parallel
connection of a constant phase element (Q) and the
charge transfer resistance (R
ct
). The reference and
working electrodes were connected via a series
resistance (R
sol
) representing the media. The
constant phase element arises due to surface non-
uniformity and roughness of the interface. The
impedance of the constant phase element is given by
Z = Yo (iω)α, where (Yo)-1 is a constant with
dimension Fcm-2s(α-1), ω is angular frequency
(2πf), i =√-1, and 0 < α < 1, where α = 1 for an ideal
capacitor. The results were obtained by averaging
results from five electrodes (n=5) in each
experimental group.
The measurement of how much charge can be
delivered to tissue, by any electrode, is the integral
of current over time, as dQ/dt = I, where Q is the
charge in Coulombs, t is the time in seconds, and I is
the current in Amperes. When the CV excitation
voltage is applied at a slow rate, the hysteresis
observed (difference between the positive and
negative cycles of the voltage) denotes how much
charge can held by the electrode. The area under the
CV curve, is the charge storage capacity of the
electrode, and a common parameter reported in the
literature is the cCSC, cathodic charge storage
capacity. This parameter is relevant in implants used
for tissue stimulation because it sets the maximum
possible charge transfer by a given electrode
material and its geometrical area. This will allow for
the evaluation of how well that specific electrode is
performing during the implant period. CV tests to
our experimental data will be shown and charge
transfer mechanisms in vitro (with the electrode
immersed in vitreous) will be evaluated.
3 RESULTS
The interplay between the electrode surface
chemistry and the charge transfer into the vitreous
solution was examined in detail by using
voltammetric techniques. The system was stimulated
with a quasi-DC voltage that ranged from -0.8V to
0.7V, this could vary depending on the electrode
size and type. As the voltage is varied slowly over
time (at 100 mV/s), the current flowing through the
two electrodes was measured and plotted. Stability
was determined and reduction and oxidation peaks
on the current waveforms were observed. The cyclic
voltammetry (CV) spectrum gave insights when the
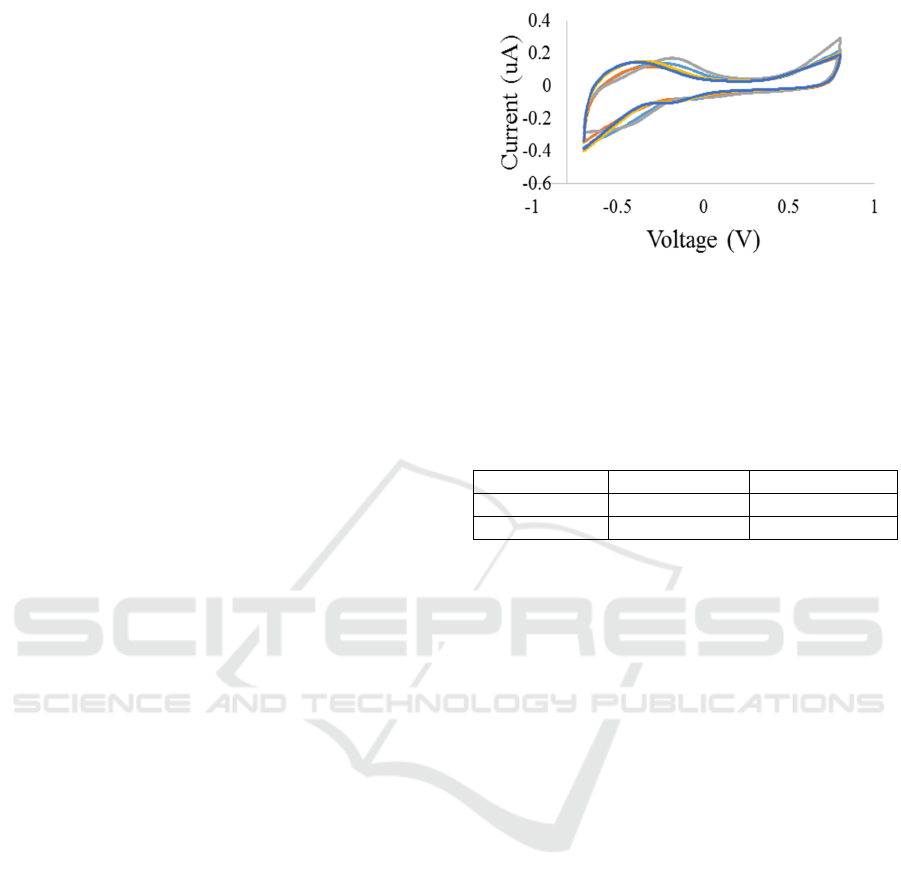
Figure 3: (Blue) thimerosal + PBS (0.005%), (Red)
thimerosal + Distilled Water (0.005%), (Grey) PBS,
(Orange) vitreous w/o thimerosal (0.005%), (Dark Blue)
vitreous w/ Thimerosal (0.005%).
Table 1: Mean and standard deviation of the vitreous with
and without thimerosal of all 5 electrodes. All values are
in Coulombs (C ).
Vit+Thim Vit-Thim
Mean -1.63×10
-6
-1.46×10
-6
st. dev. ±5.63×10
-7
±2.35×10
-7
electrode was immersed in phosphate buffered
saline, thimerosal versus when it is dipped into the
vitreous.
The integration of the CV curve using
EchemAnalyst provided the cathodic charge storage
capacity (cCSC), expressed Coulombs (C), of the
vitreous with thimerosal and the vitreous without
thimerosal solutions (table 1). The mean cCSC was
-1.63×10
-6
C for vitreous with thimerosal and -
1.46×10
-6
C for vitreous without thimerosal while
the standard deviation was ±5.63×10
-7
C for vitreous
with thimerosal and ±2.35×10
-7
C for vitreous
without thimerosal.
The mean and standard deviation of the charge
storage capacity determined to characterize the
electrode in vitreous with and without thimerosal
provides information about the performance of the
electrode in the electrolyte. Figure 3 shows the CV
curves of the stainless steel electrode in the vitreous
with and without thimerosal. A one-way ANOVA
test was performed to determine the statistical
significance of the means for each electrode. The p-
value lower than 0.05 (p = 0.000, 0.012, 0.40, 0.008,
0.022 respectively) indicated that the mean
difference between the vitreous with and without
thimerosal is statistically different for all electrodes.
A Tukey test was then performed to determine if
there is a significant difference between the mean of
the two groups. Results showed that the means are
not significantly different. The insignificant
Randles Model of Vitreous Humor
159
difference between the means is also observed in
figure 3. The “vitreous w/o thimerosal” and
“vitreous w/ thimerosal” voltammetric curves are
similar, revealing that the charge transfer from the
electrode to the vitreous is not significantly altered
by the addition of thimerosal. If there had been any
proteins adsorbed onto the surface of the electrode,
then the “vitreous w/ thimerosal” spectrum would
show significant differences to the “vitreous w/o
thimerosal” spectrum.
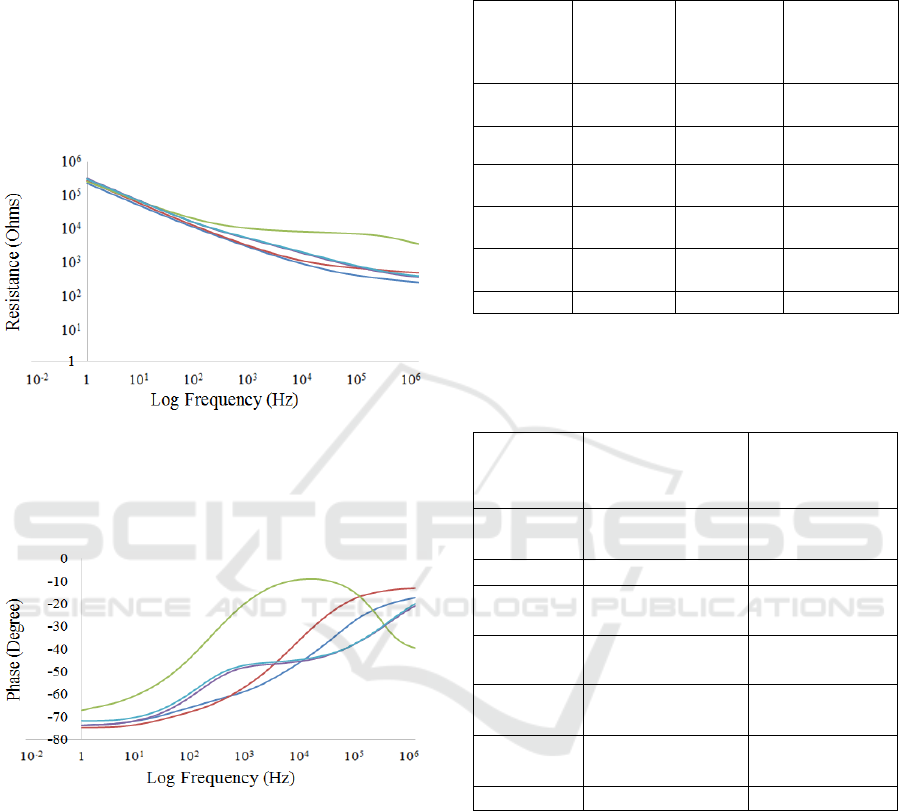
Figure 4A: Overlay of EIS impedance curves of a random
electrode (Blue) thimerosal + PBS (0.005%), (Red)
thimerosal + Distilled Water (0.005%), (Grey) PBS,
(Orange) vitreous w/o thimerosal (0.005%), (Dark Blue)
vitreous w/ thimerosal (0.005%).
Figure 4B: Overlay of EIS phase curves of a random
electrode (Blue) thimerosal + PBS (0.005%), (Red)
thimerosal + Distilled Water (0.005%), (Grey) PBS,
(Orange) vitreous w/o thimerosal (0.005%), (Dark Blue)
vitreous w/ thimerosal (0.005%).
Table 2: Summary of the fitted parameter values with
corresponding standard deviations to impedance spectra of
stainless steel electrodes measured in PBS, vitreous and
vitreous with 0.005% tthimerosal solution.
PBS Vitreous Vitreous +
thimerosal
(0.005 % in
dist. Water)
Q-Y
0
-SS
(uF)
6.49± 4.59 1.18 ± 1.28 1.59 ± 1.55
Q-n-SS 0.49± 0.13 0.54 ± 0.07 0.50 ± 0.07
R
ct
(k Ω)
1.82 ±
1.15
24.49 ±
10.60
18.34 ±
8.56
R
sol
(Ω)
473.55 ±
56.64
659.83 ±
310.60
1333.98 ±
1258.39
Q-Y
0
-RE
(uF)
0.12± 0.02 0.10 ±0.03 0.10 ± 0.03
Q-n-RE 0.85± 0.01 0.83 ± 0.02 0.83 ±0.02
Table 3: Summary of the fitted parameter values with
corresponding standard deviations to impedance spectra of
stainless steel electrodes measured in 0.005% thimerosal
diluted in distilled water versus in PBS solutions.
Thimerosal
(0.005% in
distilled water)
Thimerosal
(0.005 % in
PBS)
Q-Y
0
-SS 60.40 ± 1.01 (nF) 6.84 ±3.28 (uF)
Q-n-SS 0.80 ± 0.10 0.43 ± 0.05
R
ct
(kΩ) 65.36 ± 62.566 12.92 ± 18.31
C
sol
(uF) 0.145 ± 0.04 N/A
R
sol
11.93 ± 5.54 GΩ 940.9±276.78
kΩ
Q-Y
0
-RE 0.38 ± 0.22 (nF) 0.11 ± 0.03 (uF)
Q-n-RE 0.60 ± 0.07 0.85 ±0.01
Electrochemical impedance spectra of the
electrodes were acquired for PBS, vitreous with and
without thimerosal diluted with distilled water.
Equivalent circuit model (figure 2) was fitted to the
data (figure 4). The averaged parameters (n=5) are
shown in table 2. The “solution” resistance (R
sol
) is
greater for vitreous in comparison to PBS. The
estimated model parameters depict this trend
(473.55 ± 56.64 Ω (PBS), 659.83 ± 310.60 Ω
(vitreous)). The solution resistance further increases
when thimerosal (0.005 %) is added to the vitreous
(1.34 ± 1.25 kΩ). The RE electrode parameters are
the same across all media. The constant phase
element (Q) describes the deviation of the interfacial
BIODEVICES 2017 - 10th International Conference on Biomedical Electronics and Devices
160

impedance from the ideal behavior. The Q-n
exponent values for the stainless steel electrode (SS)
for PBS, vitreous and vitreous with thimerosal
(0.005% in water) represent a deviation from a
capacitive nature towards resistive (<0.6). The
charge transfer occurring at the electrode-electrolyte
interface is highest for vitreous and lowest in PBS
while R
ct
is lower when thimerosal is added to the
vitreous. All the values are reported in the form of
value ± standard deviation.
Impedance spectra were compared for
thimerosal in distilled water versus PBS with the
same dilution to understand its properties and effect
on the electrodes performance. The averaged
parameters (n=5) are shown in table 3. The
“solution” resistance (R
sol
) is not only greater when
thimerosal (11.93 ± 5.54 GΩ) is diluted in water in
comparison to PBS (940.90 ± 276.78 kΩ) but also
presents a capacitive nature (0.145 ± 0.04 uF).
Interestingly, the reference electrode parameters are
different when the dilution media is changed (table
2). While the double layer capacitance is two orders
of magnitude lower in the distilled water dilution
(60.4 nF), versus PBS (6 µF), the Q-n exponent
values for the stainless steel electrode (SS) is higher
0.80 ± 0.10, indicating the behaviour of a capacitor.
As expected, the charge transfer resistance
occurring at the electrode-electrolyte interface is
higher for water dilution when comparing to PBS
because the media is less conductive as expected.
All the values are reported in the form of value ±
standard deviation.
4 DISCUSSION
The effects of thimerosal diluted with PBS versus
distilled water is determined with the “solution”
resistance (R
sol
). From our data, it is noticed that R
sol
is only greater when thimerosal (11.93 ± 5.54 GΩ) is
diluted in water in comparison to PBS (940.90 ±
276.78 kΩ) indicating its capacitive nature. This
may be attributed to the low amount of free ions in
distilled water in comparison to PBS. Moreover, the
double layer capacitance lower in the distilled water
dilution (60.40 ± 1.01 nF) with the higher Q-n
exponent values (0.80 ± 0.10Ω) persists to conclude
that thimerosal diluted with water has a capacitive
behavior.
Though the RE electrode parameters is the same
across all media, the “solution” resistance (R
sol
)
increases further when thimerosal (0.005 %) is
added to the vitreous (1.34 ± 1.25 kΩ). This is true
due to thimerosal containing ethylmercury, a
compound that acts as both a substrate and an
inducer (Clark et al., 1977). This property affects to
the resistivity of the vitreous. This also explains why
the Q-n exponent values for vitreous with thimerosal
(0.005% in distilled water) deviated from capacitive
nature towards resistive (<0.6) due to the added
thimerosal.
The difference in the charge storage capacity of
the vitreous with and without thimerosal shows that
the ability of the electrode to deliver charge to the
solution increases when dipped in the vitreous with
thimerosal (table 1). The “solution” resistance
reveals high conductivity for the vitreous solution
w/o thimerosal versus the vitreous solution w/
thimerosal. The addition of the thimerosal solution
w/ distilled water to the vitreous increased the
mixture’s resistivity while decreasing its electrical
conductivity because of the resistance (11.93 ± 5.54
GΩ) of thimerosal diluted with distilled water.
5 CONCLUSION
The determined electrical properties of the vitreous
with and without an organomercury compound with
implantable electrodes allowed for a more detailed
electrical representation of the vitreous. In retinal
prostheses, the issue of the vitreous sticking to the
retina presents itself. Since the resistivity of the
vitreous increases when the thimerosal is added, it is
expected to notice an increase in the impedance seen
by the electrodes when they are positioned at the
surface of the retina. Though the charge storage
capacity is not significantly different as thimerosal is
added, its addition leads to the increase of the
solution resistance. This in turn decreases the
electrical conductivity of the vitreous solution with
thimerosal.
Our randles model and findings can be used to
provide a starting point to assist regulators in
understanding safety and effectiveness issues with
the vitreous. It can also assist the retinal implant
industry and device evaluators by establishing
common metrics of device effectiveness and aid in a
better understanding of the design issues that cause
loss of effectiveness of retinal stimulus electrodes of
retinal prostheses in blind subjects.
For future endeavors, biochemical analyses
could be attained to detect the different ions
concentration as well as the chemical processes of
the vitreous. This includes determining the
correlation between the temperature, viscosity,
liquefaction, oxidation and reduction potentials. This
Randles Model of Vitreous Humor
161

will enhance our knowledge about this gel-like
substance called the vitreous humor.
ACKNOWLEDGEMENTS
We would like to acknowledge the NSF grant FDA
SIR: 1445684.
REFERENCES
Bishop, P. N., 2000. Structural macromolecules and
supramolecular organisation of the vitreous gel.
Progress in Retinal and Eye Research, 19, 323-344
ISSN 1350-9462
Krause, C., 1934. Structural macromolecules and
supramolecular organisation of the vitreous gel. Arch
Ophthalmology. 1934;11(6):960-963.
doi:10.1001/archopht.1934.00830130044006.
Joseph, N. H., 1990. Patent US4902292 - Vitreous Body
Prosthesis Device.
Shah, S., Hines, A., Zhou, D., Greenberg, J. R., Humayun,
S. M., Weiland, D. J., 2007. Electrical Properties of
Retinal–electrode Interface. Journal of Neural
Engineering.
Kawano, S. I., Honda, Y., and Negi, A., 1982. Effects of
the Biological Stimuli of the Viscosity of the Vitreous,
National Center for Biotechnology Information. U.S.
National Library of Medicine.
Clark, D. L., Weiss, A. A., Silver, S., 1977. Mercury and
Organomercurial Resistances Determined by
Plasmids in Pseudomonas. Journal of Bacteriology
132.1 (1977): 186–196. Print.
Loveday D. et al., 2001. Potentiostatic EIS Tutorial –
Getting Started. https://www.gamry.com/application-
notes/EIS/potentiostatic-eis-tutorial/”. Web.
Peixoto, N., Jackson, K., Samiyi, R., Minnikanti, S., 2009.
Charge Storage: Stability measures in implantable
electrodes. Engineering in Medicine and Biology
Society, 2009. EMBC 2009. Annual International
Conference of the IEEE, Minneapolis, MN, 2009, pp.
658-661.
doi: 10.1109/IEMBS.2009.5333449
Majdi, J. A., Minnikanti, S., Peixoto, N., Agrawal, A.,
Cohen, E. D., 2014. Access resistance of stimulation
electrodes as a function of electrode proximity to the
retina. Journal of neural engineering 12, no. 1:
016006.
BIODEVICES 2017 - 10th International Conference on Biomedical Electronics and Devices
162
