
µSmartScope: 3D-printed Smartphone Microscope
with Motorized Automated Stage
Lu
´
ıs Rosado
1
, Jo
˜
ao Oliveira
1
, Maria Jo
˜
ao M. Vasconcelos
1
, Jos
´
e M. Correia da Costa
2
, Dirk Elias
1
and Jaime S. Cardoso
3
1
Fraunhofer Portugal AICOS, Rua Alfredo Allen 455/461, 4200-135 Porto, Portugal
2
Instituto Nacional de Sa
´
ude Dr. Ricardo Jorge, Rua Alexandre Herculano 321, 4000-055 Porto, Portugal
3
INESCTEC and University of Porto, Rua Dr. Roberto Frias, 4200-465 Porto, Portugal
Keywords:
Microscopy, Mobile Devices, Motorized Microscope Stage, Developing Countries, Mobile Health.
Abstract:
Microscopic examination is currently the gold standard test for diagnosis of several neglected tropical diseases.
However, reliable identification of parasitic infections requires in-depth train and access to proper equipment
for subsequent microscopic analysis. These requirements are closely related with the increasing interest in
the development of computer-aided diagnosis systems, and Mobile Health is starting to play an important role
when it comes to health in Africa, allowing for distributed solutions that provide access to complex diagnosis
even in rural areas. In this paper, we present a 3D-printed microscope that can easily be attached to a wide
range of mobile devices models. To the best of our knowledge, this is the first proposed smartphone-based
alternative to conventional microscopy that allows autonomous acquisition of a pre-defined number of images
at 1000x magnification with suitable resolution, by using a motorized automated stage fully powered and
controlled by a smartphone, without the need of manual focus of the smear slide. Reference smears slides
with different parasites were used to test the device. The acquired images showed that was possible to visually
detect those agents, which clearly illustrate the potential that this device can have, specially in developing
countries with limited access to healthcare services.
1 INTRODUCTION
The increasing interest in the development of
computer-aided diagnosis systems for disease diag-
nosis in developing countries is well known, mainly
due to the common practical difficulties experienced
in rural health facilities. The excessive workload due
to shortage of medical staff has been reported as one
of the most significant problems (Quinn et al., 2014),
fact that has been driving the development of new so-
lutions that aim to facilitate the diagnosis of several
neglected tropical diseases.
The detection of several neglected tropical dis-
eases, particularly blood stage parasites, are primarily
based on well established and widely used laboratory
techniques. The microscopic examination of smear
preparations of different human biological products
are also used to diagnosis a wide range of para-
sites, such as the usage of blood smears (e.g Malaria,
Lymphatic filariasis, African Trypanosomiasis), stool
smears (e.g. intestinal helminths) and urine smears
(e.g. Schistosomiasis) (Utzinger et al., 2012). How-
ever, reliable identification of the referred parasitic in-
fections requires in-depth train for specimen prepara-
tion and high-standard expertise for subsequent mi-
croscopic analysis. Those requirements are closely
related with the increasing interest in the develop-
ment of computer-aided diagnosis systems for this
purpose, particularly in the area of Mobile Health.
The mobile phone is currently Africa's most impor-
tant digital technology. In the year 2000 few Africans
had a mobile phone, but today about three-quarters
do (Zachary, 2015). So it becomes natural that Mo-
bile Health is starting to play an important role when
it comes to health in Africa, particularly through the
usage of solutions that allow skipping over central-
ized laboratories (Dolgin, 2015) by taking advantage
of the advanced imaging and processing capabilities
of the new generation of mobile devices.
Thus, the development of new portable micro-
scopic devices (and ideally low cost) is an area that
can greatly improve the chances of the successful de-
38
Rosado L., Oliveira J., JoÃ
ˇ
co M. Vasconcelos M., M. Correia da Costa J., Elias D. and S. Cardoso J.
ÎijSmartScope: 3D-printed Smartphone Microscope with Motorized Automated Stage.
DOI: 10.5220/0006155800380048
In Proceedings of the 10th International Joint Conference on Biomedical Engineering Systems and Technologies (BIOSTEC 2017), pages 38-48
ISBN: 978-989-758-216-5
Copyright
c
2017 by SCITEPRESS – Science and Technology Publications, Lda. All rights reserved

ployment of computer-aided diagnosis solutions for
disease diagnosis in the underserved areas (Rosado
et al., 2016). Given also the increase possibilities
coming from additive manufacturing, in this paper
we report our efforts on the development of a 3D-
printed microscope with a motorized stage, termed
µSmartScope, that can be easily coupled to a smart-
phone. The process will be to place the smartphone in
the µSmartScope along with the smear, and have the
smartphone image sensor to acquire a set of magni-
fied images autonomously. This collection of images
could then be analyzed, either automatically through
image processing approaches, or manually by a spe-
cialist on a remote location.
It worth mentioning that we took into account sev-
eral particularities of the African reality during the de-
sign of this device, like the high customs taxes and
import duties currently in practice in many African
countries; this motivated us to favor solutions easy
replicable in third world countries. Several others ad-
ditional requirements were equally considered, like
automating the device as much as possible, discard-
ing the need of considerable expertise and train of the
technician in terms of maneuvering the microscope,
or supplying the energy needed for the illumination
and/or any type of automation through the mobile de-
vice battery, thus discarding the need of an additional
power source.
This paper is structured as follow: Section 1 cor-
responds to Introduction and presents the motivation
and objectives of this work; Section 2 give a summary
of the related work found on the literature; Section 3
describes each component of the device, namely the
Optics, Illumination and Motorized Automated stage;
Section 4 details the process of Autofocusing; In Sec-
tion 5 the Results are presented; and finally the Con-
clusions are drawn in Section 6.
2 RELATED WORK
Some research has been made in the last years to
develop cell-phone based systems that provide low-
cost alternatives to conventional microscopy. The mi-
croscopy designs of the proposed systems can be sep-
arated in three different areas: lensless, on-lens and
attachment-based approaches.
The lensless approaches are based on the princi-
ples of holographic microscopy, i.e. the microscopic
images are reconstructed from the holograms cap-
tured by the cell-phone. This approach has the advan-
tage of not requiring any lenses or optical component
as well as obtaining images with large field-of-view
(FOV). However, acceptable resolutions are only ob-
tained for small magnifications (∼40x magnification,
NA= 0.65 objective) and processing power is needed
to reconstruct the image (Tseng et al., 2010; Pirnstill
and Cot, 2015).
On-lens approaches usually employ a refractive
element directly attached to the smartphone camera at
the focus, or a ball lens mounted in front of the camera
lens (Arpa et al., 2012; Cybulski et al., 2014). Despite
being a low-cost alternative, the ball lens produces a
spherical focal plane, which creates aberrations and
reduces drastically the usable FOV. Moreover, magni-
fication and radius of the ball lens are inversely linked,
so in order to achieve 1000x magnification we need a
a ball lens with radius of 0.15mm (Cybulski et al.,
2014), which can turn the mounting and alignment
process with the camera lens really challeging.
The attachment-based approaches covers the ma-
jority of the solutions already reported on the liter-
ature, which requires coupling additional hardware
to the cell-phone, such as commercial lenses or illu-
mination modules (Smith et al., 2011; Switz et al.,
2014; Pirnstill and Cot, 2015). This approach usu-
ally takes advantage of complex optical elements that
allow achieving suitable resolutions at high magnifi-
cations (e.g. ∼1000x), which increases the overall
cost of the system, but is currently a requirement for
the microscopic examination of several neglected dis-
eases. With high magnifications also emerges the lim-
itation of having a small FOV, thus requiring the de-
velopment of mechanisms to move the smears in or-
der to cover a large area of the specimen. Moreover,
it was verified that the majority of reported works are
designed for a unique cell-phone model, which can
greatly compromise the adoption of the proposed so-
lution.
In this work, we present a 3D-printed microscope
that can easily be attached to a wide range of mobile
devices models. To the best of our knowledge, this
is the first proposed smartphone-based alternative to
conventional microscopy that allows autonomous ac-
quisition of a pre-defined number of images at 1000x
magnification with suitable resolution, by using a mo-
torized automated stage fully powered and controlled
by a smartphone, without the need of manual focus of
the smear.
3 µSMARTSCOPE COMPONENTS
Since we wanted to achieve a cheap and easily repli-
cable alternative to conventional microscopes that can
be attached to smartphones, most of the device is 3D-
printed (see Fig. 1). The proposed device can be di-
vided in 3 major modules: the Optics; the Illumina-
ÎijSmartScope: 3D-printed Smartphone Microscope with Motorized Automated Stage
39
tion; and the Automated Stage (see Fig. 2).
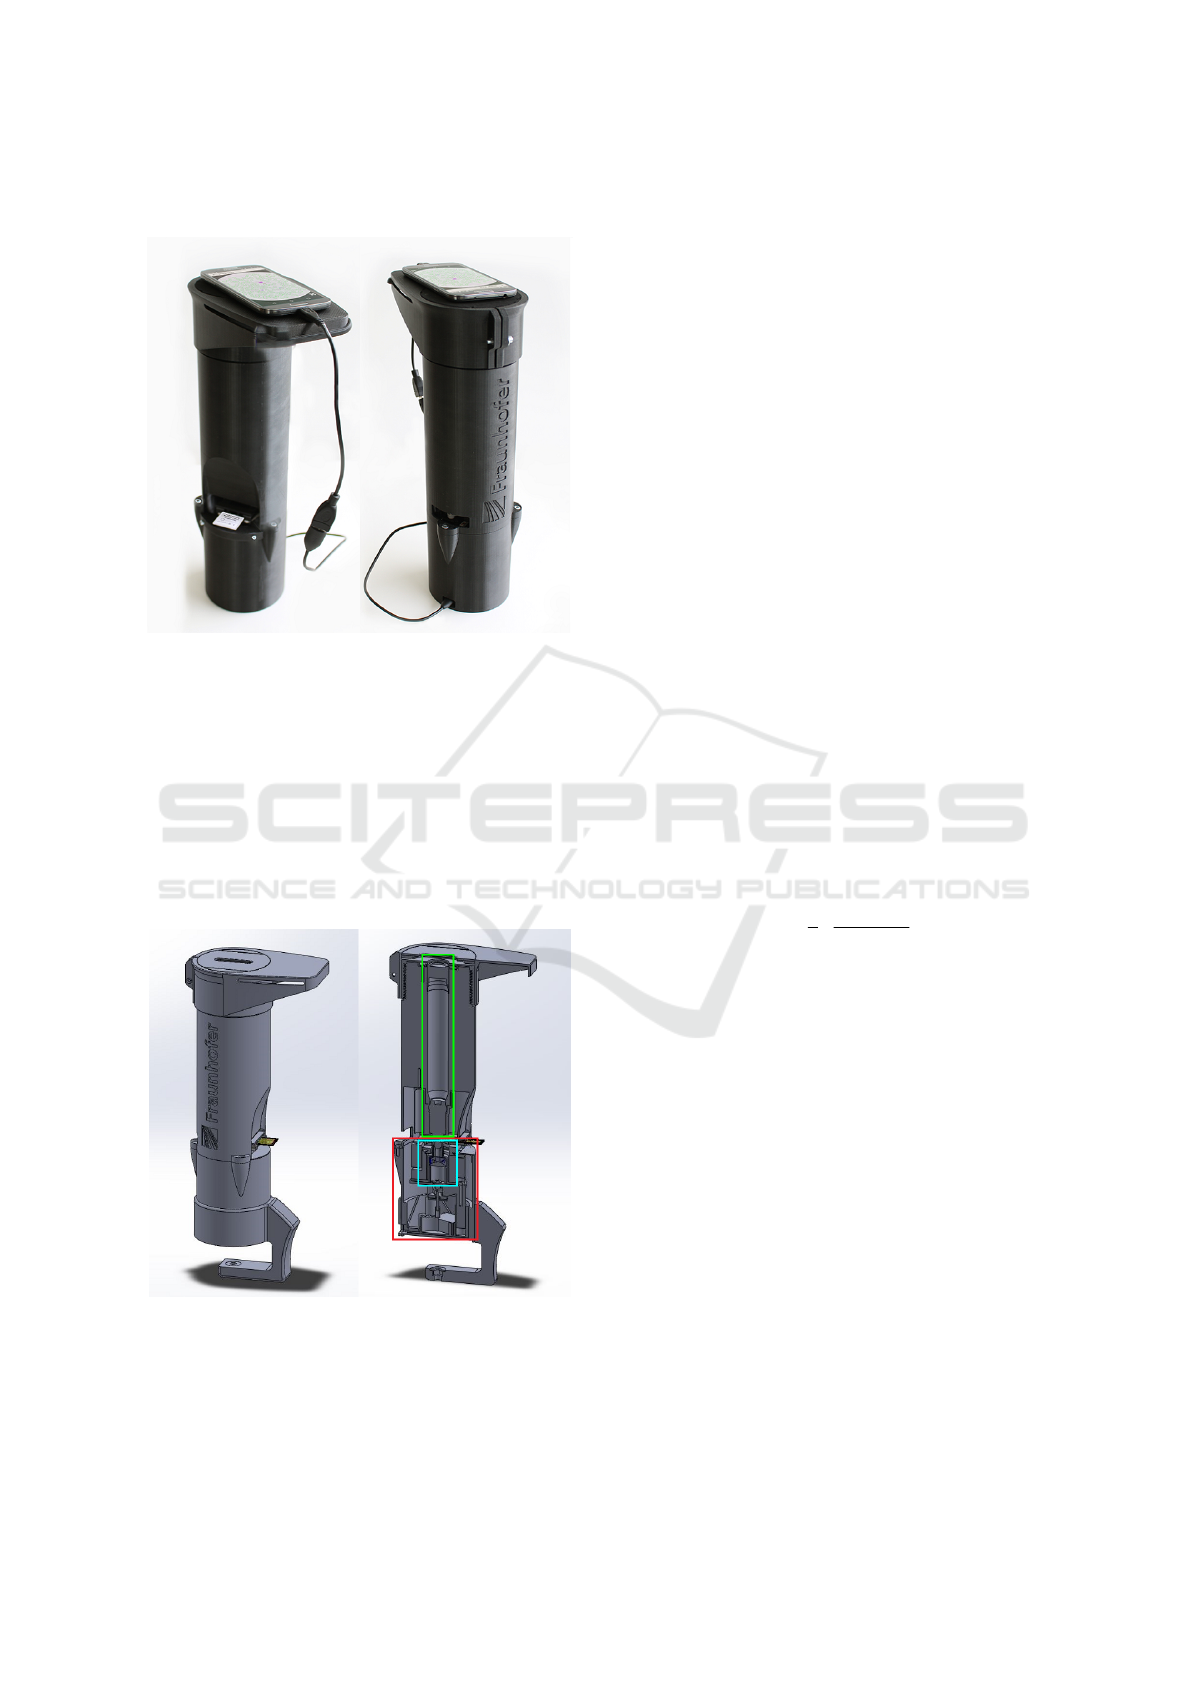
Figure 1: µSmartScope with smartphone attached and
malaria-infected blood smear inserted.
3.1 Optics
The selected commercial lenses used to construct the
µSmartScope were supplied by Bresser, a vendor that
showed a good price-quality relation for the required
optics. Particularly, we used the Planachromat 100x
oil-immersion objective (Bresser #5941500) and the
Wide Angle 10x Eyepiece (Bresser #5941700).
Figure 2: Render model of the µSmartScope used for 3D-
printing with the identification of the 3 main modules:
Optics (green); Illumination (cyan); and Automated Stage
(red).
3.2 Illumination
To allow a uniform illumination of the specimen, us-
ing just a LED is not enough because most of the light
is lost to parts of the sample that are not being cap-
tured. To counter that, in a common microscope, a
light condenser is normally used. The condenser is
a lens (or multiple lenses) that concentrates the light
from the illumination source and focus it in the part of
the sample that is being captured by the amplification
device. This device, in turn, magnifies the light beam,
allowing an uniform illumination. Since the support
materials for the lenses are 3D-printed, the minimum
resolution of the 3D-printer must be taken into con-
sideration. Several topologies of condensers can be
used with their pros and cons. One of the cheapest
options with acceptable results for our use case is the
Abbe condenser, which uses a plano-convex lens to
pre-concentrate the light into a smaller ball or half-
ball lens that, in turn, provides the final concentration
of light. This arrangement guarantees a good result
by using cheaper individual lenses instead of an ex-
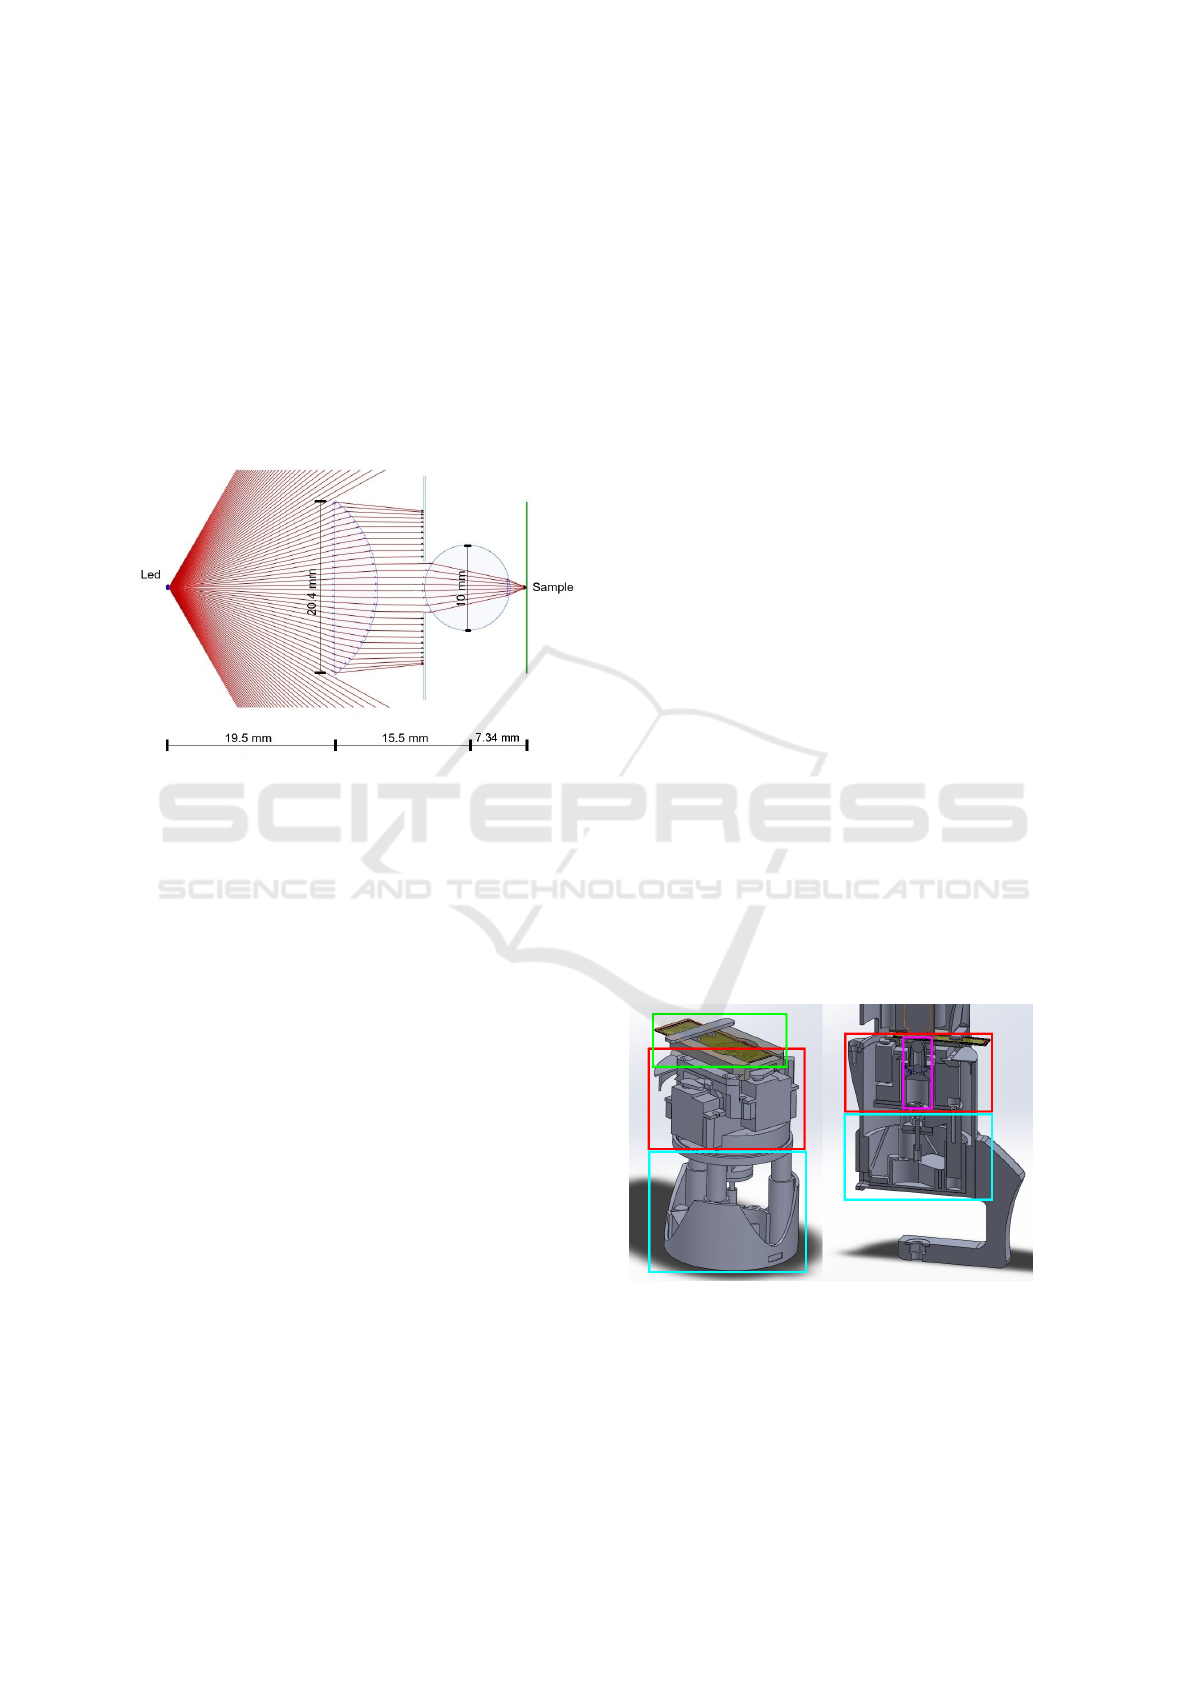
pensive, custom made, one. To design our condenser
we selected a 20.4 x 25mm plano-convex lens (Ed-
mund Optics #43483) and a 10mm N-BK7 Ball Lens
( Edmund Optics #32748). In order to calculate the
Back-Focal Length (BFL), i.e. distance on the optical
axis between last active optical surface and the spec-
imen plane (i.e. the sample), we used the following
equation (Cybulski et al., 2014):
BFL =
1
2
·
r · (2− n)
(n − 1)
, (1)
where r = 5mm is the radius of the ball lens and n =
1.517 is the Index of Refraction of the N-BK7 optical
material. This gives a BFL = 2.34mm, as shown in
Fig. 3.
Despite the distances defined on Fig. 3 being
strictly respected, during the design we also had to
ensure that the center of the ball lens was both care-
fully aligned with the center of the plano-convex lens
and with the center of the objective lens.
3.3 µStage
The microscopic examination of smears usually re-
quires the visual analysis of different microscopic
fields (i.e. positions) of the smears, and the mini-
mum number of required fields depends on the dis-
ease and used magnification. For instance, accord-
ing to World Health Organization (WHO), the anal-
ysis of 100 fields of a blood sample is the minimum
needed to perform a malaria microscopy test (WHO,
1991). Currently, this process is manually performed
BIODEVICES 2017 - 10th International Conference on Biomedical Electronics and Devices
40
by trained staff and can be extenuating, requiring that
the operator takes regular breaks in order to ensure
maximum attention. In order to improve this pro-
cess, the sample movement should be performed au-
tonomously and on-demand by the smartphone. For
that, the µStage was developed, which is an automatic
stage designed to be as cheap as possible, while pro-
viding displacement up to 20mm in X/Y with reso-
lution of 500 µm and a resolution of 25 µm in the Z
axis. It was designed to be powered using the USB-
OTG connection of the smartphone.
Figure 3: Schematic of the developed condenser generated
with OpticalRayTracer® optics design software.
3.3.1 Mechanical Structure
In order to be as flexible as possible, most of the struc-
ture is modular and can be adapted without needing to
refactor the whole structure. One of our major goals
was to minimize the use of mechanical components
and try to 3D-print as many parts as possible. This re-
duces costs and facilitates replication in third world
countries, but has some disadvantages like reduced
precision and wear.
The structure is composed by a base part where
the electronic board, the Z axis actuator and the µUSB
connector are placed. In this part, there are 3 slots that
are the negatives of the tubular structures of Z axis.
Besides the base, the stage is divided in 4 functional
modules that are fully 3D printed (see Fig. 4):
• Z axis: Composed by 3 tubular structures that
slide against their negatives in the base part, the
Z axis was designed to have the highest resolution
possible within the restrictions to ensure correct
focus of the smear. Ensuring that the used 3D-
printer is correctly calibrated and parametrized is
evidently important for all µSmartScope printed
components, but particularly crucial for this mod-
ule. Obtaining the required gap between the each
tubular structure and the corresponding negative
is crucial to achieve a smooth Z axis movement,
without tilting. Moreover, a simple stepper motor
is used to provide the movement, being the cir-
cular movement translated through a M3 threaded
rod and a nut fixed in this part. A rigid piece of
heat shrink sleeve is then used to couple the step-
per with the threaded rod. This ensures that even-
tual 3D printing deviations are corrected by the
flexibility of the sleeve without compromising the
Z axis movement.
• X/Y axes: Composed by 2 parts that slide against
the Z axis module and between each other, the
precision is not high but the resolution is enough
to ensure at least 100 different microscopic fields.
It should be noted that repositioning to a specific
field location with high precision is usually not
needed in microscopic smear analysis. Cover-
ing different microscopic fields that represents the
overall specimen is by far much more important.
Two servo motors are used to provide the move-
ment, together with some rubber bands that ensure
the movement in both ways. This arrangement is
not linear since the servo movement is provided in
a 90° arc, but ensures different fields: while one
of the servo moves, the other is always static and
placed in the Z axis part.
• Illumination: The optical design of this module
was already presented in section 3.2, which passes
through the Z and X/Y axes modules.
• Smear holder - a standard microscope slide can
be fitted in the top part of the stage and hold in
place by a simple plastic piece.
Figure 4: Render model of the motorized automated stage
with the identification of the 4 modules: Z-axis (cyan); X/Y
axes (red); Illumination (purple); and Smear holder (green).
ÎijSmartScope: 3D-printed Smartphone Microscope with Motorized Automated Stage
41
3.3.2 Electronics
The power board was designed to power the 3 actu-
ators (stepper and two servos) and the illumination
LED using only the power from a USB connection
with 5V and 500 mA. Almost any modern smartphone
has USB-OTG interface that allows the connection of
USB peripherals. To be fully compatible with the
µSmartScope, it needs to support, at least, the nor-
mal power standard enumerated above. Some manu-
facturers do not use this standard in their devices and
are not supported since this devices are not capable of
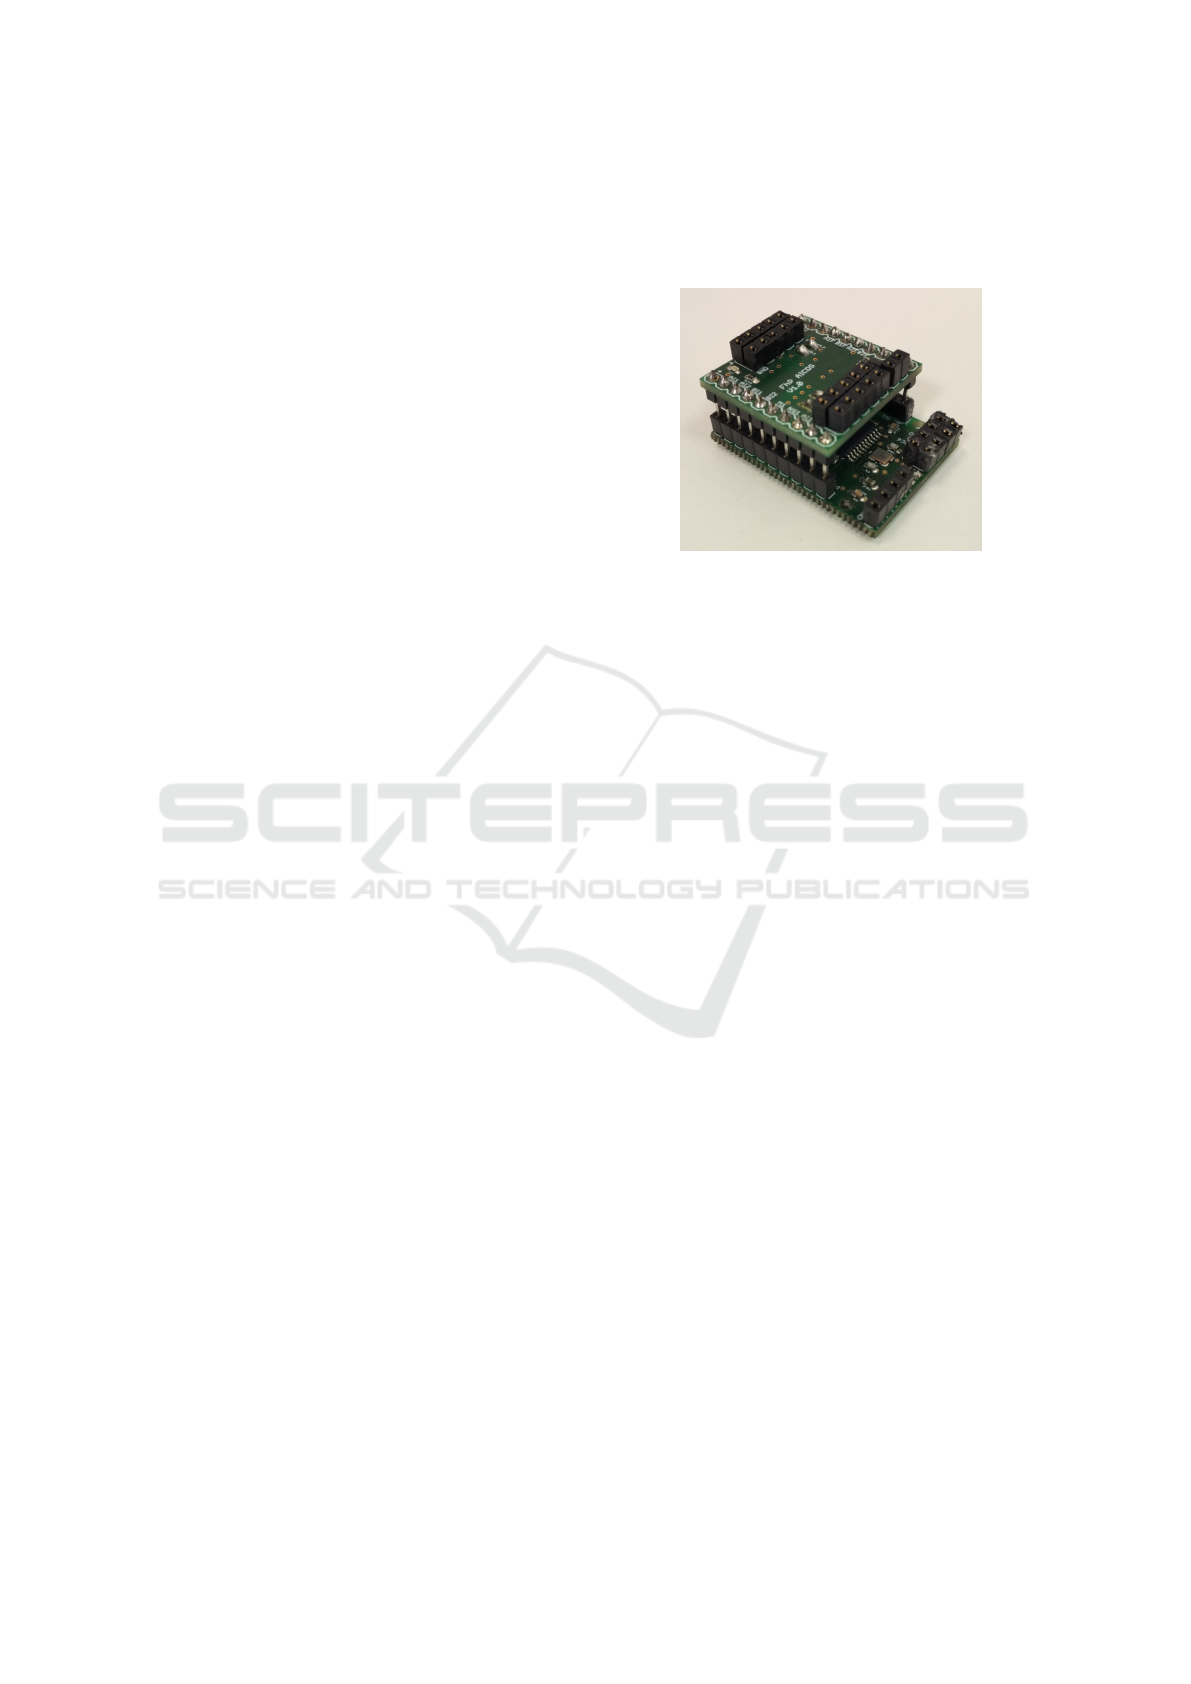
powering the µStage. An image of the developed PCB
can be observed in Fig. 5, and the electronic system is
composed by:
• Stepper motor: The used stepper motor is a
28BYJ-48 5V, which is the cheapest stepper mo-
tor found in common electronic stores. This was a
major point in choosing the motor since the repli-
cation of the µSmartScope should be easy and
cheap in any part of the world. It is controlled by
a DRV8836 from Texas Instruments with current
limited to 200 mA, and capable of 512 steps per
full rotation. Since we are using a standard M3
threaded rod, we have a theoretical resolution of
around 1 µm. Furthermore, a simple push-button
switch is placed in the Z axis to provide a way to
locate the position when the device is turned on.
• Two servo motors: The used servo motors are
the Hitec HS-55 5V, which is the cheapest micro
servo motor found in common electronic stores.
Controlled directly by PWM output and limited
to 200 mA, their rotation is directly used to gen-
erate the linear movement. The servo head has a
size of 13mm meaning that this is our maximum
displacement. Using the 90° travel with 2.5° per
step, we have 36 steps available while we only
need 10 per axis;
• Illumination: Since the illumination depends of
the sample under analysis, the control board pro-
vides an output based in a power Mosfet capa-
ble of providing 150mA at 5V. This power can be
controlled by changing the PWM duty cycle of the
output.
• Control: An ATMega32u4 is used to control all
the logic of the system, which contains native
USB communications and plenty of GPIO ports
and PWM support. The native USB connection is
seen as a serial port in the smartphone using the
USB serial for Android library (Wakerly, 2012).
Moreover, an API for Android was developed to
allow interaction with the stage. This API was
made to be as simple as possible to integrate in
any app, providing every function needed to fully
control the stage (i.e. stepping in X, Y and Z axes,
as well as control the LED light).
Figure 5: Prototype PCB to control the µStage.
4 AUTOMATED FOCUS
The traditional focusing method in microscopy is usu-
ally achieved by manually adjusting the vertical posi-
tion of the smear stage, in order to obtain a focused
image of the smear. However, for screening processes
that requires the analysis of a huge amount of po-
sitions per specimen, this process clearly becomes a
cumbersome task. As an illustrative example, for the
analysis of malaria-infected blood smears, is recom-
mended the analysis of 100 different positions for a
single specimen. Thus, taking advantage of devel-
oped motorized automated stage and real time feed-
back retrieved from the smartphone camera sensor, it
became clear that is fundamental to develop an au-
tomated focus approach that ensures autonomous ac-
quisition of focused smear images.
Automated focus is a long standing topic in the
literature and several focus algorithms have been pro-
posed (Krotkov, 1988; Shih, 2007), yet the search for
the proper algorithm still remains an open topic, since
it can highly depend on the resolution of the cam-
era sensor and visual characteristics of the specimen.
Generally an autofocus system includes three compo-
nents: focusing region selection, focus measurement
and peak search. In this section it will be presented
a description of those components to obtain micro-
scopic images from thin blood smears infected with
malaria parasites.
Due to lens constrains, it is not possible to obtain
the optical circle with maximal focus in the whole
area. Therefore, for each frame given by the cam-
era sensor, this automated focus algorithm considers
the central square of the previewed image, with size
equal to one third of previewed image (smallest of the
BIODEVICES 2017 - 10th International Conference on Biomedical Electronics and Devices
42

height and weight value) to be the region with maxi-
mum focus, as portrayed in Fig.7.
4.1 Focus Metric
Taking into consideration several works on the liter-
ature targeting the automatic focus for microscopic
devices using image processing, in this work we se-
lected a wide range of focus metrics already pro-
posed that where considered highly relevant for au-
tomatic focusing for testing and comparison. In de-
tail, we tested: derivative-based as the Brenner gra-
dient and the Tenenbaum gradient; statistics based,
like the normalized variance; histogram-based, as en-
tropy; and intuitive algorithms, like thresholded con-
tent (Sun et al., 2005; Liu et al., 2007). After this
comparative analysis, the standard deviation (STD) of
the Tenenbaum gradient (Tenenbaum, 1970) was con-
sidered the most discriminative focus metric to dif-
ferentiate better a focused point in the focus curve,
i.e. in the variation of the metrics while the Motor-
ized Automated Stage is ascending in the vertical axis
(see Fig.6). The Tenenbaum gradient is obtained by
convolving the previously selected central square of
the image with Sobel operators, and by summing the
square of gradient vector components:
T ENG = (G
x
(i, j)
2
+ G
y
(i, j)
2
), (2)
where G
x
and G
y
are the horizontal and vertical gradi-
ents computed by convolving the focus region image
with the Sobel operators. From the previous equation,
the STD and the mean values are extracted.
4.2 Focus Logic
The developed automated focus logic has three dis-
tinct phases: the Rough, Precise, Ending phase (see
Fig.6). The main concept behind the proposed focus
logic relies on following concept: the Motorized Au-
tomated Stage starts at a bottom position (called the
reset position), and while is going up in the Z axis
(i.e. the vertical axis), the value of the selected focus
metrics starts to increase. The usage of three differ-
ent phases in the focus logic is directly related with
the length of the Z steps. Particularly, a pre-defined
length of the Z step is a associated to each phase, so
while the stage is going up and the metric increases,
the focus logic evolves from the Rough phase (Z steps
with maximum length) to the Ending phase (Z steps
with minimum length).
To better understand the focus logic, please see in
Fig.6 where it is presented the behavior of the Tenen-
baum metrics while the motorized stage goes up. The
first step of the algorithm consists in resetting the
stage to a predefined Z step that is below the focus
point (Rough phase). While ascending, in each Z
step an image frame is captured and the selected focus
metrics are evaluated in order to infer the next move:
either stay in the same stage and move up or go to next
stage and adapt Z step length. The focus curve for the
selected focus metric is usually composed by two lo-
cal maxima, where the second corresponds to the best
focused image region. So a threshold is dynamically
defined when the first local maximum is reached, and
a focus image is selected and saved only after this
threshold is overcome and a new maximum value ex-
ists. By doing this, we ensure that the last image saved
is the one with best focus quality, while minimizing
memory allocation of the algorithm. Moreover and
because the stage can suffer some “jumps” leading to
metrics behavior different than the one presented, we
included a failure index metric which after 3 failures
leads the motorized stage to reset.
5 RESULTS
In this section we present the obtained results in terms
of Resolution, Field of View and Illumination of the
obtained images using the µSmartScope, as well as an
analysis of the µStage performance in terms of steps
precision/resolution and power consumption.
5.1 Resolution
The magnified images of the smears obtained with
the µSmartScope must have an appropriate resolution
over a sufficiently large area, so a conclusive deci-
sion about the presence of a specific infectious agent
can be made. The 1951 USAF resolution test chart
is a resolution test pattern conforming to MIL-STD-
150A standard, set by US Air Force in 1951. It is still
widely accepted to test the resolving power of optical
imaging systems such as microscopes, cameras and
image scanners. One example is the READY OPTICS
USAF 1951 Microscope Resolution Target, which is a
target embedded in a standard microscope slide, suit-
able for oiled objectives and oiled condensers. In
terms of resolution, the target allows to check a mini-
mum spacing between lines of 0.197 nm.
Microscopic images of the READY OPTICS
USAF 1951 Microscope Resolution Target with
1000x magnification were acquired the µSmartScope
and with the Bresser Microscope-5102000-Erudit
DLX (see Fig. 8). Both systems use similar objec-
tives and eyepieces, so the main goal is to evaluate
image resolution of the µSmartScope.
ÎijSmartScope: 3D-printed Smartphone Microscope with Motorized Automated Stage
43
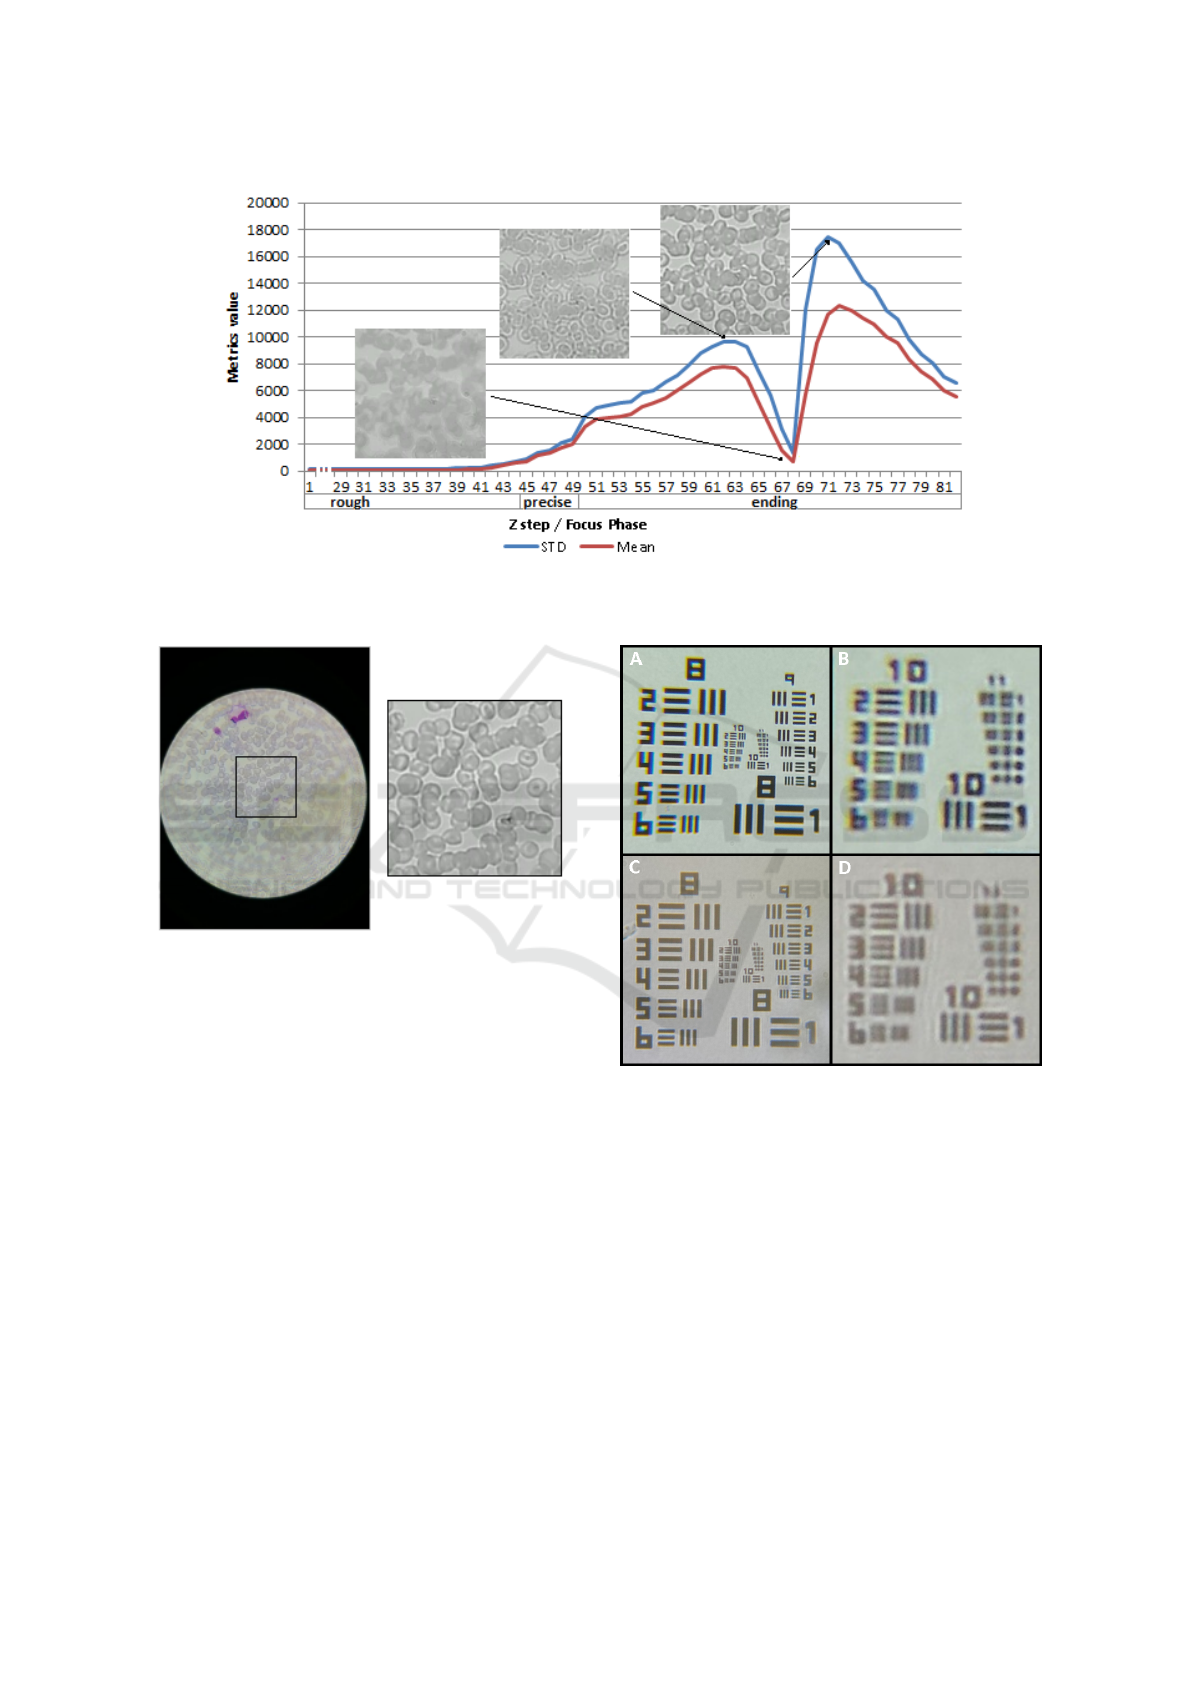
Figure 6: Focus curve of the Tenenbaum metrics for the central square of the image, i.e. variation of the metrics while the
Motorized Automated stage is ascending in the vertical axis.
Figure 7: Focused image obtained using the µSmartScope,
and respective central square used by the automated focus
algorithm.
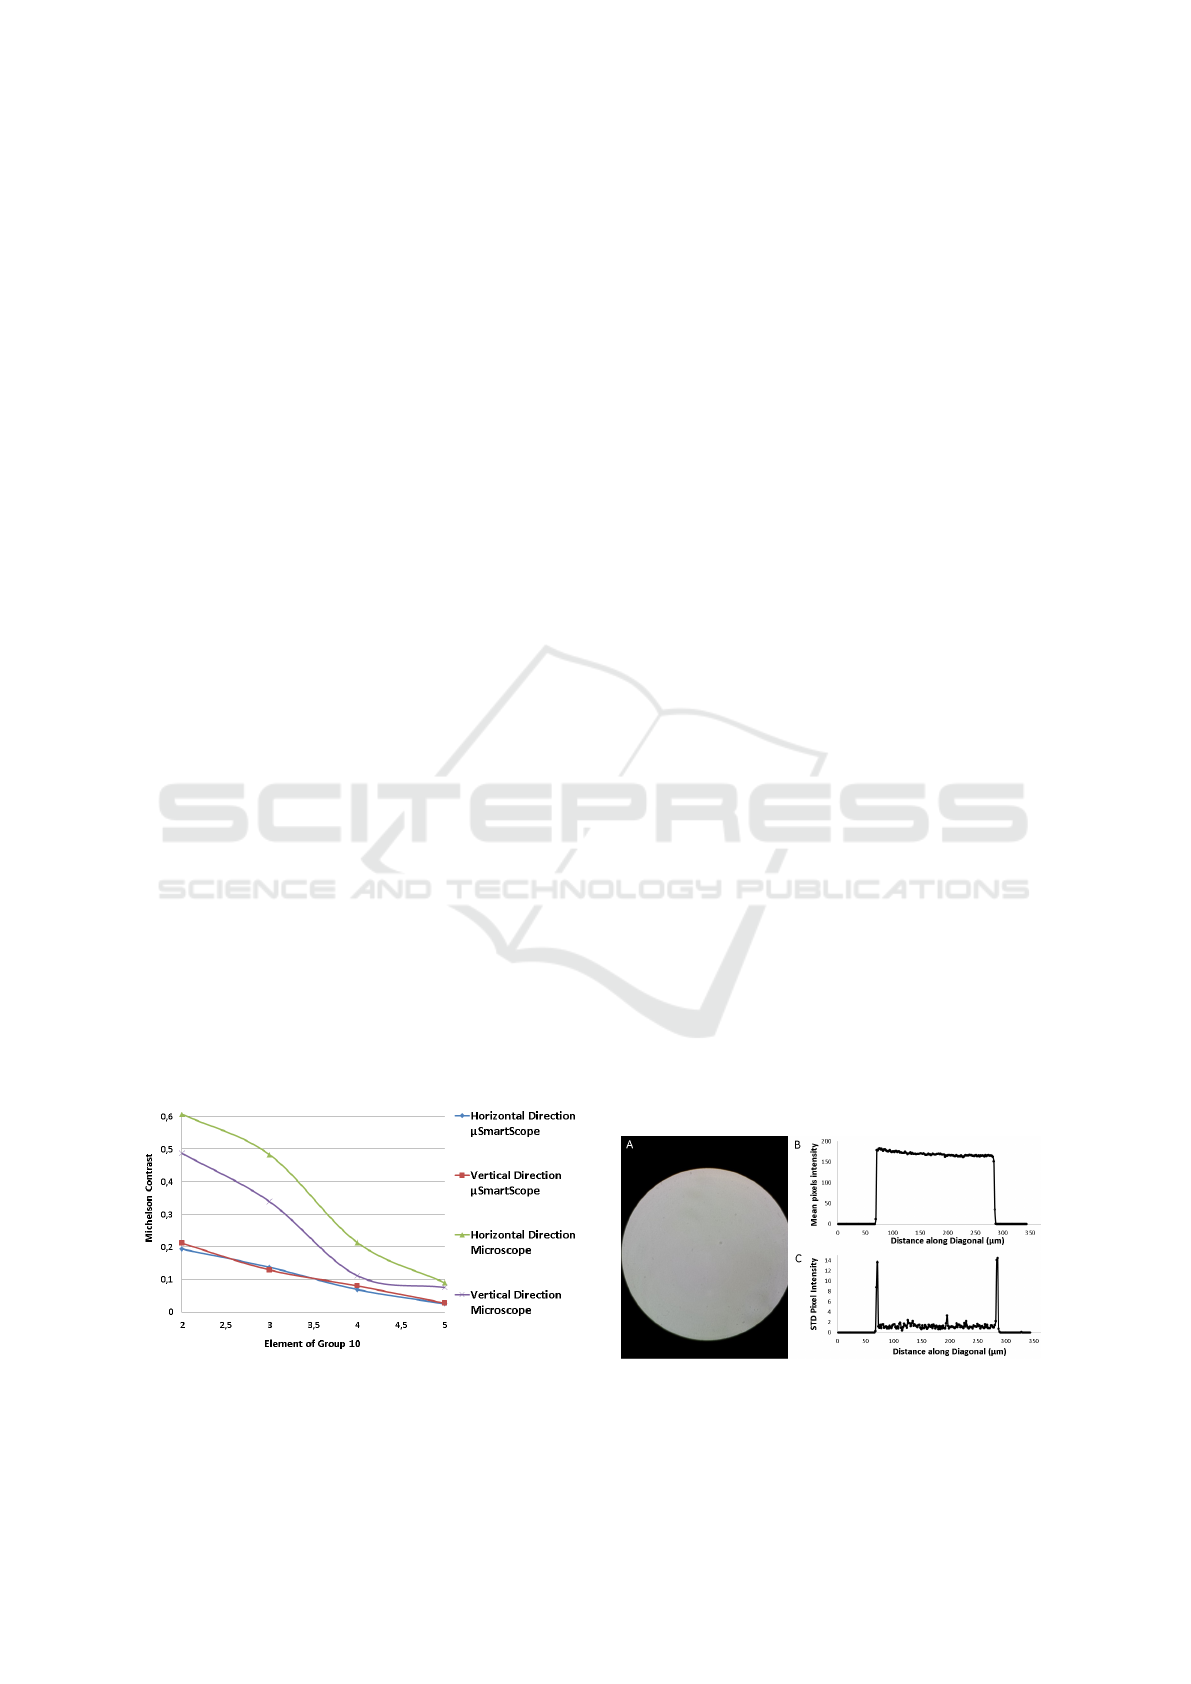
To determine the resolution of the µSmartScope
and compare it to the resolution of the Bresser Com-
mercial Microscope, the images acquired with the
separate systems were converted to grayscale and the
analysis focused on Group 10, which was the small-
est resolvable group. In order to determine the small-
est resolvable Element of Group 10 in both horizontal
and vertical orientations, the images were firstly con-
verted to grayscale and a line for each of the 6 bars of
that Element were drawn. Each line starts and ends
in a background pixel, and intersects perpendicularly
the respective bar. All pixel values of each line were
used to calculate the Michelson contrast, which was
assigned to the respective bar. In each direction of
each Element, the bar with minimum Michelson con-
trast was selected for analysis purposes (see Fig. 9).
It was defined that an Element is considered re-
solvable on a particular direction if the minimum
Figure 8: Images of READY OPTICS USAF 1951
microscope resolution target: A) acquired using
the µSmartScope; B) Detail of Group 10 using the
µSmartScope; C) acquired using Bresser Microscope -
5102000 - Erudit DLX 20x-1000x; D) Detail of Group 10
using the Microscope.
Michelson contrast was 0.1. Thus, Element 3 was
defined as the minimum resolvable Element for the
µSmartScope, which gives a minimum resolution of
0.388µm on both directions. For the Bresser Commer-
cial Microscope, Element 4 was selected as the min-
imum, which corresponds to a resolution of 0.345µm
for both directions. Although the µSmartScope
present a slightly lower resolution, it is clear on Fig. 9
that both directions have a more homogenous behav-
BIODEVICES 2017 - 10th International Conference on Biomedical Electronics and Devices
44
ior in terms of resolution, while in the Bresser Micro-
scope there is an evident discrepancy between the re-
solving power on different directions. The lower val-
ues of Michelson contrast for the µSmartScope might
be caused by the limitation in terms of the maximum
power rate of the smartphone, since both the illumina-
tion and motorized automated stage must be powered
by USB-OTG. Thus the power that feeds the LED is
limited, which diminishes the intensity of the LED
and consequently the image contrast.
5.2 Field of View
Resolution and field of view are inversely linked in
standard laboratory microscopes. In order to obtain
microscopic fields with both high magnification and
resolution, the usage of objectives with higher nu-
merical aperture is required, which results in smaller
Field of Views (FOV) (Pirnstill and Cot, 2015). To
determine the FOV of the µSmartScope, images of
the READY OPTICS USAF 1951 Microscope Res-
olution Target were acquired and used to estimate
the pixel-microns relationship. The exact distances
between bars of a specific Element is given by the
specifications of the resolution target, particularly El-
ement 2 and 3 of Group 8 corresponds to 1.740µm and
1.550µm, respectively. By measuring the number of
pixels between bars of this 2 Elements on the acquired
image, a relationship of 0.085 µm/pixel was obtained
for Element 2 and 0.084 µm/pixel for Element 3. So
we considered the average value, i.e. a relationship of
0.0845 µm/pixel. Furthermore, the number of pixels
for the vertical and horizontal axis that passes through
the center of the visible optical circle of the acquired
image were determined. These values were then com-
bined with the previously calculated µm/pixel rela-
tionship, in order to estimate the FOV of the visible
optical circle, with 214.38µm and 206.87µm for the
vertical and horizontal axis, respectively.
Figure 9: Minimum Michelson contrast for USAF Resolu-
tion Target Elements of Group 10.
5.3 Illumination
In order to evaluate the uniformity of the illumina-
tion of the LED coupled to the proposed condenser,
an image was acquired with a blank microscope slide
(see Fig. 10.A). A diagonal line scan was consid-
ered to evaluate the variation of pixels intensity along
this line. A total of 200 pixel boxes were considered,
equally spaced and with size 10x10. For each of those
boxes the mean and standard deviation were collected
(see Fig 10.B and 10.C). Despite small pixel inten-
sity variations probably caused by dust or components
floating in the immersion oil, this results demonstrate
that we can achieve a substantially uniform illumina-
tion with low noise with the proposed set up.
5.4 µStage
The µStage was analyzed in terms of precision and
resolution of the X/Y and Z steps, as well as in terms
of power consumption.
5.4.1 Precision and Resolution
While testing the usage of the µStage, we found out
that the precision of each axis is affected by the fact
that all moving parts are 3D printed. Since plastic im-
perfections and particles can be present in the sliding
portions of the parts, this leads to different displace-
ments in each step. In Fig. 11 is presented the results
for the displacement of the X, Y and Z axis, where
100 steps were taken and each one measured using a
digital caliper (Mitutoyo Absolute) with resolution of
0.01mm ± 0.02mm. Each measure was grouped per
value and the frequency plotted.
For the X and Y steps, a clear variation of the step
size is depict in Fig 10.A. This behavior is mainly
caused by the non-linear movement of the servo (pre-
viously described in section 3.3.1), as well as by the
Figure 10: Illumination uniformity analysis for Prototype:
a) Original image; b) Mean pixel intensity of the 10x10
pixel boxes on the diagonal direction; c) Standard deviation
of the 10x10 pixel boxes on the diagonal direction.
ÎijSmartScope: 3D-printed Smartphone Microscope with Motorized Automated Stage
45

imperfections of the printed parts. Nevertheless, we
obtained an average displacement of 330µm with a
standard deviation of 81µm, which proved to be a suit-
able approach for our solution. Taking into account
that the main goal of the X and Y steps is to displace
the smear into a different position and acquire an im-
age of a new microscopic field, the average displace-
ment provided by this approach is marginally higher
than the FOV determined in section 5.2, which con-
sequently means that we are obtaining a new micro-
scopic field every time we take a X or Y step.
Regarding the Z axis, our caliper is not able to
measure such small steps. To estimate the average
step size, one full revolution of the motor was con-
sidered (which corresponds to 512 steps), and the re-
spective displacement was measured 100 times. This
distance was then divided by the number of steps, in
order to estimate the travel of a single step. As we
can see in Fig 10.B, the steps are less dispersed, but
a significant variability is still verified. Each step cor-
responds to an average of 0.98µm with a standard de-
viation of 0.18µm, which gives an indication that our
steps in the Z axis are within the theoretical values.
Although we have a small step-size in the Z axis,
we observed that the movement is not smooth and
the variability in the step size leads to some “jumps”
while focusing the microscopic field. At 1000x mag-
nification this can have a significant impact in obtain-
ing the ideal focus point of the smear. It worth noting
that this is the reason why we can not simply move
Figure 11: Frequency of measured step size values after 100
repetitions. A) X and Y axes; B) Z axis.
Table 1: Power consumption test results.
Smartphone
Average
Current
(mA)
Average Power
Consumption
(W)
Autonomy
(min)
Samsung S5 208.64 1.043 164
Nexus 5 201.34 1.006 149
the Z axis to a specific pre-defined position that corre-
sponds to the focus point, in order to focus the spec-
imen. Thus, the automatic focus methodology pro-
posed on section 4 plays a critical role in the com-
pensation of this irregular behavior, and consequently
in the acquisition of focused images autonomously.
It worth noting that the overall image acquisi-
tion process involves: autonomous control of the Z
axis for autofocusing, capture the image in the fo-
cus point, and autonomous control of the X/Y axes to
the next microscopic field (where this process restarts
if we want to acquire a new image). We tested the
autonomous acquisition of 100 images using a LG
Nexus 5, which took in average 80 seconds per im-
age, and 94 of the images were considered focused.
5.4.2 Power Consumption
In order to ensure that we never go over the maxi-
mum power rate of the smartphone, the whole sys-
tem power consumption is always under 400mA at
5V. This is achieved by allowing only one actuator
moving at any given time. In Table 1, the power con-
sumption of the system can be observed together with
the autonomy for the tested smartphones. The profile
tested was as close as possible to the real one, i.e. the
smartphone was acquiring views continuously with
the screen off and in flight mode until it shut down
due to low battery.
It worth noting that we are currently using the
smartphone battery to simultaneously powering the
actuators of the µStage, the LED light, acquired data
continuously with the optic sensor and process each
acquired frame for the automatic focus of the smear.
Considering the current battery capacity of smart-
phones, this obviously represents a huge burden in
terms of power consumption, and it is clear that the
current autonomy of the system is low for a day of
continuous use. As an alternative, one can consid-
erer the usage of at least two smartphones to allow
the acquisition of images 24h per day, or the usage of
a power bank coupled to a OTG splitter cable, which
we are considering to include in the next version of
the µSmartScope system.
BIODEVICES 2017 - 10th International Conference on Biomedical Electronics and Devices
46
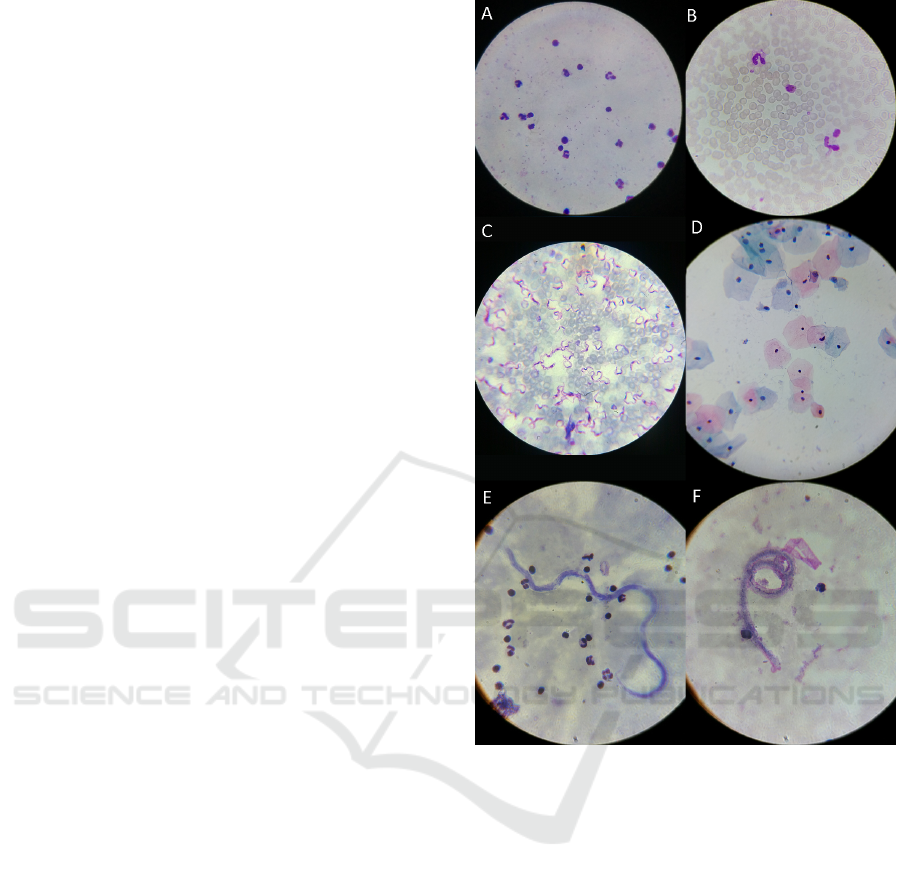
5.5 Applicability Examples
The µSmartScope was used to acquire microscopic
images of reference blood smears with different para-
sites, which are responsible for the most relevant ne-
glected tropical diseases that can be detected through
microscopic examination (see Fig 12). Particu-
larly, the following smears were used: thick blood
smear infected with malaria parasites (P.falciparum
species); thin blood smear infected with malaria par-
asites (P.ovale and P.malariae species); thin blood
smear infected with Chagas parasites (Trypanosome
cruzi species); and thick blood smear infected with
Lymphatic Filariasis parasites (Brugia malayi and
Wuchereria bancrofti species).
Furthermore, to highlight the versatility of the de-
veloped system, a liquid-based Pap smear with high
grade squamous lesions was also tested, which is as-
sociated with precancerous changes and high risk of
cervical cancer. For the analysis of this smear, a mag-
nification of 400x is required, so we had to adapt
the optical set up of the µSmartScope, which con-
sisted in the simple procedure of changing the Bresser
Planachromat 100x oil-immersion objective for the
Bresser Planachromat 40x (Bresser #5941540).
To finalize, considering the acquired images and
the feedback received by the specialists that helped
us collect the smears, we can state that very promis-
ing results were obtained. For all the tested smears,
the detection of the considered blood parasites and the
precancerous cells on the cervix was considered pos-
sible through images acquired via the µSmartScope.
6 CONCLUSIONS
In this paper, we present a 3D-printed microscope that
can easily be attached to a wide range of mobile de-
vice models. This is the first proposed smartphone-
based alternative to conventional microscopy that al-
lows autonomous acquisition of a pre-defined number
of images at 1000x magnification with suitable res-
olution, by using a motorized automated stage fully
powered and controlled by a smartphone, without the
need of manual focus of the smear.
All the components of the proposed device are de-
scribed and properly evaluated. In terms of the Op-
tical Module, a minimum resolution of 0.388µm was
determined, with a FOV of 214.38µm and 206.87µm
for the vertical and horizontal axis that passes through
the center of the visible optical circle, respectively.
Regarding the Illumination Module, the LED light
coupled to the proposed condenser demonstrated to
achieve an uniform illumination suitable for bright-
Figure 12: Images of different smears acquired with the
µSmartScope: a) Thick blood smear infected with malaria
parasites (P.falciparum species); b) Thin blood smear
infected with malaria parasites (P.ovale and P.malariae
species); c) Thin blood smear infected with Chagas par-
asites (Trypanosome cruzi species); d) Liquid-based Pap
smear with high grade squamous lesions; e) Thick blood
smear infected with Lymphatic Filariasis parasites (Brugia
malayi species); f) Thick blood smear infected with Lym-
phatic Filariasis parasites (Wuchereria bancrofti species).
Images a), b) and c) were acquires with a LG Nexus 5, while
images d), e) and f) with a Samsung Galaxy S5. All images
were acquired with magnification of 1000x, except image
d) which has magnification of 400x.
field microscopy. In terms of the Motorized Auto-
mated Stage (µStage), we achieved an average reso-
lution of 330µm (with a standard deviation of 81µm)
for the X and Y steps and an average resolution of
0.98µm (with a standard deviation of 0.18µm) for the
Z steps.
Several smears infected by different blood para-
sites responsible for the most relevant neglected tropi-
ÎijSmartScope: 3D-printed Smartphone Microscope with Motorized Automated Stage
47

cal diseases were used to test the device. The acquired
images showed that it was possible to detect those
agents through images acquired via the µSmartScope,
which clearly illustrate the huge potential that this de-
vice can have, specially in developing countries with
limited access to healthcare services.
As future work, we want to tackle several of the
detected issues in order to achieve a more robust ver-
sion of the µSmartScope system. In particular, we
want to solve the significant negative impact of oc-
casional plastic imperfections (originated by the 3D
printing process) in the precision of the µStage, as
well as the currently low autonomy of the system for
continuous usage.
ACKNOWLEDGEMENTS
We would like to acknowledge the financial sup-
port from North Portugal Regional Operational Pro-
gramme (NORTE 2020), Portugal 2020 and the Euro-
pean Regional Development Fund (ERDF) from Eu-
ropean Union through the project ’Deus ex Machina:
Symbiotic Technology for Societal Efficiency Gains’,
NORTE-01-0145-FEDER-000026.
REFERENCES
Arpa, A., Wetzstein, G., Lanman, D., and Raskar, R. (2012).
Single lens off-chip cellphone microscopy. pages 23–
28. IEEE.
Cybulski, J. S., Clements, J., and Prakash, M. (2014). Fold-
scope: Origami-Based Paper Microscope. PLoS ONE,
9(6):e98781.
Dolgin, E. (2015). Portable pathology for Africa. IEEE
Spectrum, 52(1):37–39.
Krotkov, E. (1988). Focusing. International Journal of
Computer Vision, 1(3):223–237.
Liu, X., Wang, W., and Sun, Y. (2007). Dynamic evaluation
of autofocusing for automated microscopic analysis of
blood smear and pap smear. Journal of microscopy,
227(1):15–23.
Pirnstill, C. W. and Cot, G. L. (2015). Malaria Diagnosis
Using a Mobile Phone Polarized Microscope. Scien-
tific Reports, 5:13368.
Quinn, J., Andama, A., Munabi, I., and Kiwanuka, F.
(2014). Automated Blood Smear Analysis for Mobile
Malaria Diagnosis. In Mobile Point-of-Care Monitors
and Diagnostic Device Design, Devices, Circuits, and
Systems.
Rosado, L., Costa, J. M. C. d., Elias, D., and Cardoso, J. S.
(2016). A Review of Automatic Malaria Parasites
Detection and Segmentation in Microscopic Images.
http://www.eurekaselect.com, 14(1):11–22.
Shih, L. (2007). Autofocus survey: a comparison of algo-
rithms. In Electronic Imaging 2007, pages 65020B–
65020B. International Society for Optics and Photon-
ics.
Smith, Z. J., Chu, K., Espenson, A. R., Rahimzadeh, M.,
Gryshuk, A., Molinaro, M., Dwyre, D. M., Lane,
S., Matthews, D., and Wachsmann-Hogiu, S. (2011).
Cell-Phone-Based Platform for Biomedical Device
Development and Education Applications. PLoS
ONE, 6(3):e17150.
Sun, Y., Duthaler, S., and Nelson, B. J. (2005). Autofocus-
ing algorithm selection in computer microscopy. In
2005 IEEE/RSJ International Conference on Intelli-
gent Robots and Systems, pages 70–76. IEEE.
Switz, N. A., D’Ambrosio, M. V., and Fletcher, D. A.
(2014). Low-Cost Mobile Phone Microscopy with a
Reversed Mobile Phone Camera Lens. PLoS ONE,
9(5):e95330.
Tenenbaum, J. M. (1970). Accommodation in computer vi-
sion. phd dissertation. Technical report, DTIC Docu-
ment.
Tseng, D., Mudanyali, O., Oztoprak, C., Isikman, S. O.,
Sencan, I., Yaglidere, O., and Ozcan, A. (2010). Lens-
free microscopy on a cellphone. Lab on a Chip,
10(14):1787–1792.
Utzinger, J., Becker, S. L., Knopp, S., Blum, J., Neu-
mayr, A. L., Keiser, J., and Hatz, C. F. (2012). Ne-
glected tropical diseases: diagnosis, clinical manage-
ment, treatment and control. Swiss Medical Weekly,
142:w13727.
Wakerly, M. (2012). Usb serial for android.
WHO, W. H. O. (1991). Basic malaria microscopy.
Zachary, G. (2015). Technology alone won’t improve health
in Africa [Spectral lines]. IEEE Spectrum, 52(1):7–7.
BIODEVICES 2017 - 10th International Conference on Biomedical Electronics and Devices
48
