
DEACT: An Online Tool for Analysing Complementary RNA-Seq Studies
A Case Study of Knockdown and Upregulated FLI1 in Breast Cancer Cells
Katherine Duchinski
1, ∗
, Margaret Antonio
2, ∗
, Dennis Watson
3
and Paul Anderson
1, †
1
Department of Computer Science, College of Charleston, 66 George Street, Charleston, SC, U.S.A.
2
Department of Biology, Boston College, 140 Commonwealth Ave., Chestnut Hill, MA, U.S.A.
3
Department of Genetics, Medical University of South Carolina, 68 President Street, Charleston, SC, U.S.A.
Keywords:
RNA-sequencing, RNA-Seq, Meta-analysis, Differential Expression, Transcriptomics, Comparative Analysis.
Abstract:
Understanding the genetic basis of disease may lead to the development of life-saving diagnostics and thera-
peutics. RNA-sequencing (RNA-seq) gives a snapshot of cellular processes via high-throughput transcriptome
sequencing. Meta-analysis of multiple RNA-Seq experiments has the potential to (a) elucidate gene function
under different conditions and (b) compare results in replicate experiments. To simplify such meta-analyses,
we created the Dataset Exploration And Curation Tool (DEACT), an interactive, user-friendly web applica-
tion. DEACT allows users to (1) interactively visualize RNA-Seq data, (2) select genes of interest through
the user interface, and (3) download subsets for downstream analyses. We tested DEACT using two com-
plementary RNA-seq studies resulting from knockdown and gain-of-function FLI1 in an aggressive breast
cancer cell line. We performed fixed gene-set enrichment analysis on four subsets of genes selected through
DEACT. Each subset implicated different metabolic pathways, demonstrating the power of DEACT in driving
downstream analysis of complementary RNA-Seq studies.
1 INTRODUCTION
Recent advances in next-generation sequencing have
enabled researchers to collect genomic data more
quickly and cost-efficiently than ever before. RNA-
sequencing (RNA-Seq) utilizes next-generation se-
quencing to identify and quantify transcripts in a cell.
Analyzing transcriptome changes between healthy
and abnormal cells, or other contrasting phenotypes,
is key in understanding diseases and in developing
novel molecular therapies and drugs.
Given a reference genome, one of the first stages
of analyzing RNA-Seq data involves aligning and
quantifying sequenced reads. Next, differential ex-
pression is determined by comparing paired groups
(e.g., treatment vs control). Several tools have been
developed and are widely used for identifying, quan-
tifying, and assessing differential expression of tran-
scripts from the sequenced reads (Trapnell et al.,
2012; Zhou et al., 2014; Robinson et al., 2010;
Ritchie et al., 2015; Love et al., 2014).
Typically, the following stage in RNA-Seq anal-
∗
These authors contributed equally to this work
†
Corresponding author
ysis is pathway enrichment, identification of path-
ways based on the differentially expressed transcripts
in those pathways. Popular tools for pathway en-
richment analysis and visualization include iPath-
wayGuide, GAGE, and Pathview (Draghici et al.,
2007; Luo et al., 2009; Luo and Brouwer, 2013).
The transition between these two stages can be
problematic for researchers who want to analyze two
or more parallel or independent RNA-Seq experi-
ments. Parallel studies may convey, for example, a
spectrum of severity of a cell phenotype, while inde-
pendent studies may contrast two conditions, such as
loss-of-function versus gain-of-function of a gene. In
such cases, researchers are interested in a subset of
transcripts that stand out comparatively across exper-
iments. Subsets of interesting genes could then be fed
to downstream pathway enrichment tools.
Visualizing and creating subsets of genes across
experiments is difficult for researchers who are not
computationally trained. Biclustering is a popular ap-
proach for identifying functional genes that behave
a similar way in multiple experimental conditions
(Pontes et al., 2015). However, successful use of bi-
clustering algorithms depends on having a amount of
large data, which is not always the case in compar-
154
Duchinski K., Antonio M., Watson D. and Anderson P.
DEACT: An Online Tool for Analysing Complementary RNA-Seq Studies - A Case Study of Knockdown and Upregulated FLI1 in Breast Cancer Cells.
DOI: 10.5220/0006152901540159
In Proceedings of the 10th International Joint Conference on Biomedical Engineering Systems and Technologies (BIOSTEC 2017), pages 154-159
ISBN: 978-989-758-214-1
Copyright
c
2017 by SCITEPRESS – Science and Technology Publications, Lda. All rights reserved
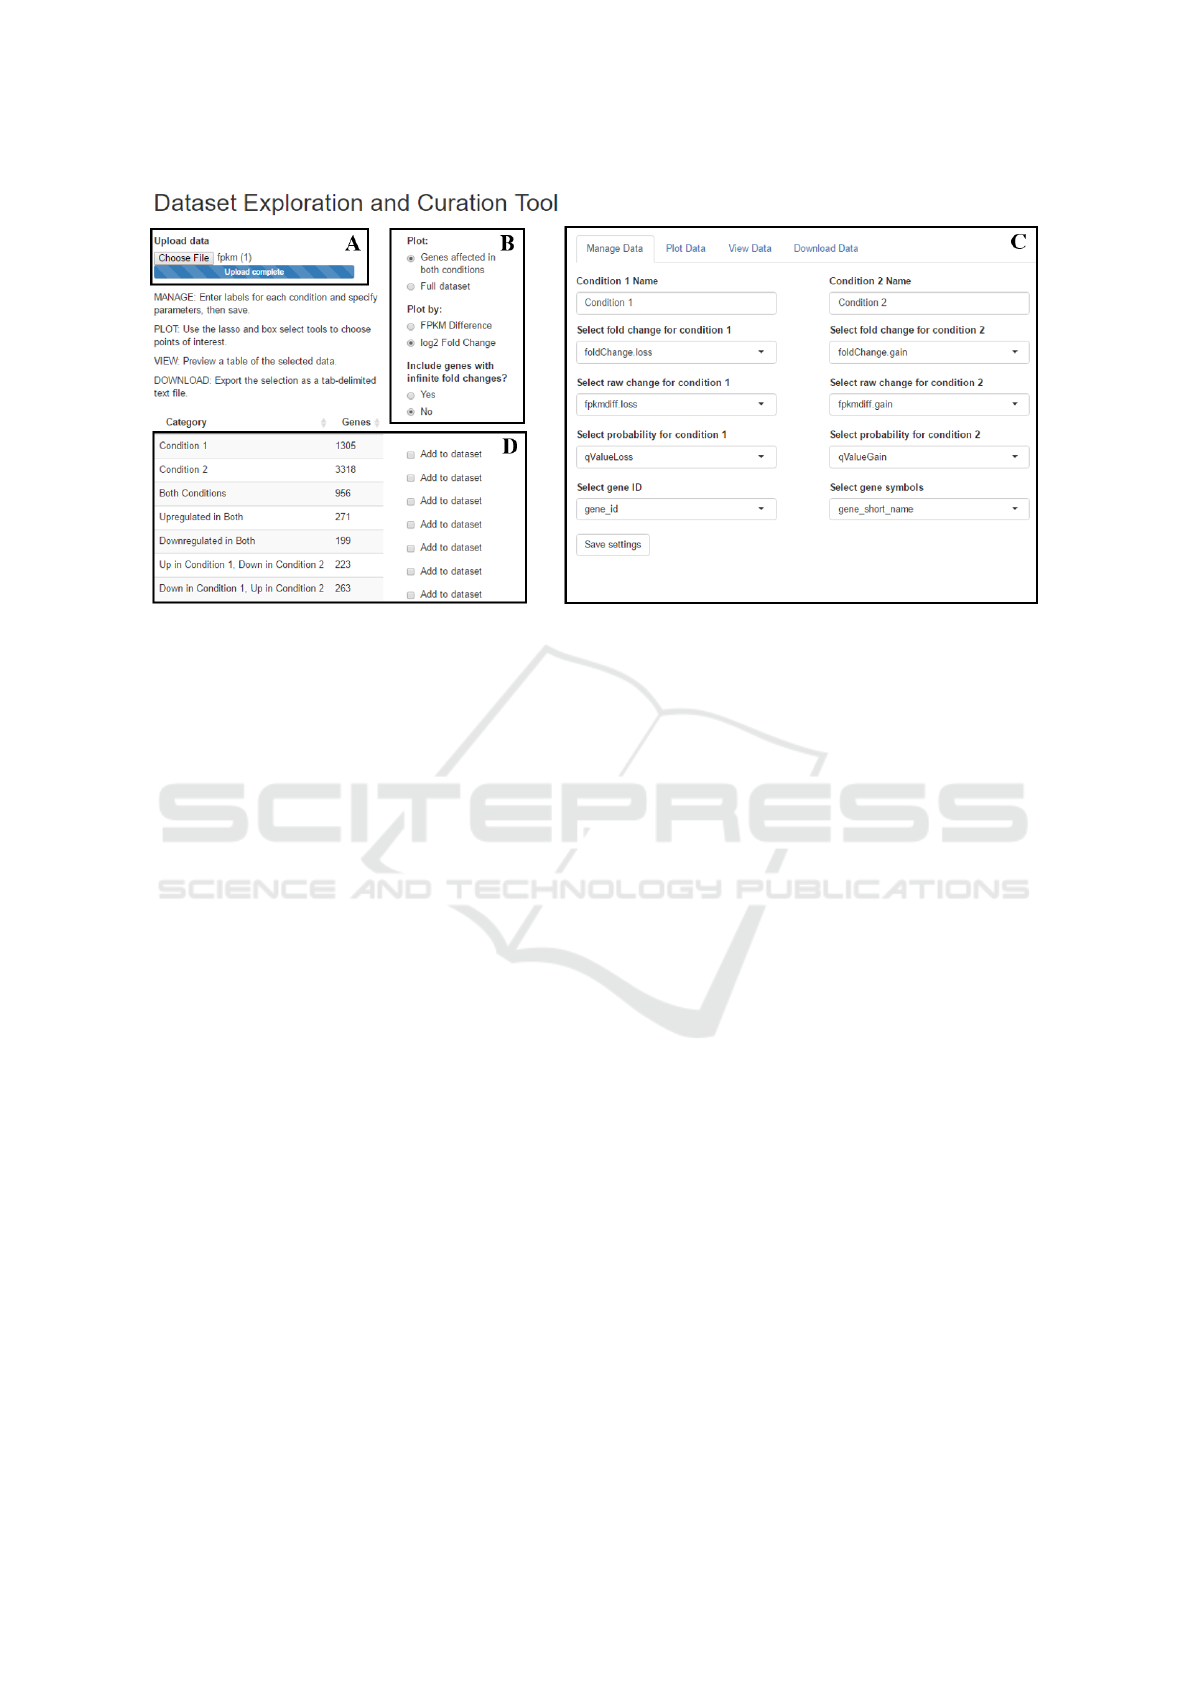
Figure 1: Screenshot of the DEACT web application. DEACTs user interface contains (A) file upload; (B) visualization
options; (C) the main panel, in which the user may manage, plot, view, and download the data; and (D) an overview of
significant genes in the dataset.
ing only two experimental conditions, or in RNA-Seq
analysis in general. Secondly, the lack of an ”optimal”
bi-clustering algorithm, as in the case of sequence
alignment, is a challenge to experimental biologists
who do not have the training to run and compare mul-
tiple algorithms.
In order to address this need, we developed a
user-friendly web application designed to visualize,
compare, select, categorize, and subset differentially
expressed transcripts in two complementary experi-
ments. The Dataset Exploration And Curation Tool
(DEACT) enables researchers to compare two RNA-
Seq studies using a simple interface for managing,
viewing, and plotting data. Here we demonstrate
its use with a case study of gain-of-function (GOF)
and loss-of-function (LOF) of the FLI1 gene, which
has been associated with hematological and epithelial
cancers (Watson et al., 2010; Scheiber et al., 2014).
DEACT allows users to subset data based on gene
categories (i.e., whether the gene is significant in both
experiments, or has a contrasting expression between
two conditions).
Many tools that support multiple studies, such
as RNASeqViewer, visualize users data through heat
maps, while DEACT allows for more quantitative
comparisons. Other applications that utilize scatter-
plots, like GRACOMICS, do not allow the user to
create custom selections or easily export predefined
subsets (Rog
´
e and Zhang, 2013; Seo et al., 2015).
DEACT offers an interactive data visualization fea-
ture which retains quantitative and transcript annota-
tion information. It allows users to quickly and easily
compare experimental conditions by visualizing and
defining gene subsets that can easily be exported for
further analysis.
2 IMPLEMENTATION
2.1 Software
DEACT is an interactive web application imple-
mented using the R shiny package. It uses the
R package plotly to create scatterplots (RStudio,
Inc, 2014; Plotly Technologies Inc., 2015). DE-
ACT can be used with up to 5 MB of data at
https://kduchinski.shinyapps.io/DEACT/. For larger
datasets or for deploying customized versions, the
source code to use DEACT locally is available at
https://github.com/kduchinski/DEACT.
2.2 Workflow
The DEACT workflow consists of three main sections
which can be easily navigated using a tab bar in the
main panel interface: (a) manage data, (b) view data,
and (c) plot data (Figure 1C).
In the MANAGE DATA section, users can upload
differential expression data from transcriptome profil-
ing in comma-separated value (csv) or tab-delimited
(txt) formats (Figure 1A). Each differential expres-
sion observation should have (1) a gene identifica-
tion number and/or gene symbol, (2) differential ex-
DEACT: An Online Tool for Analysing Complementary RNA-Seq Studies - A Case Study of Knockdown and Upregulated FLI1 in Breast
Cancer Cells
155
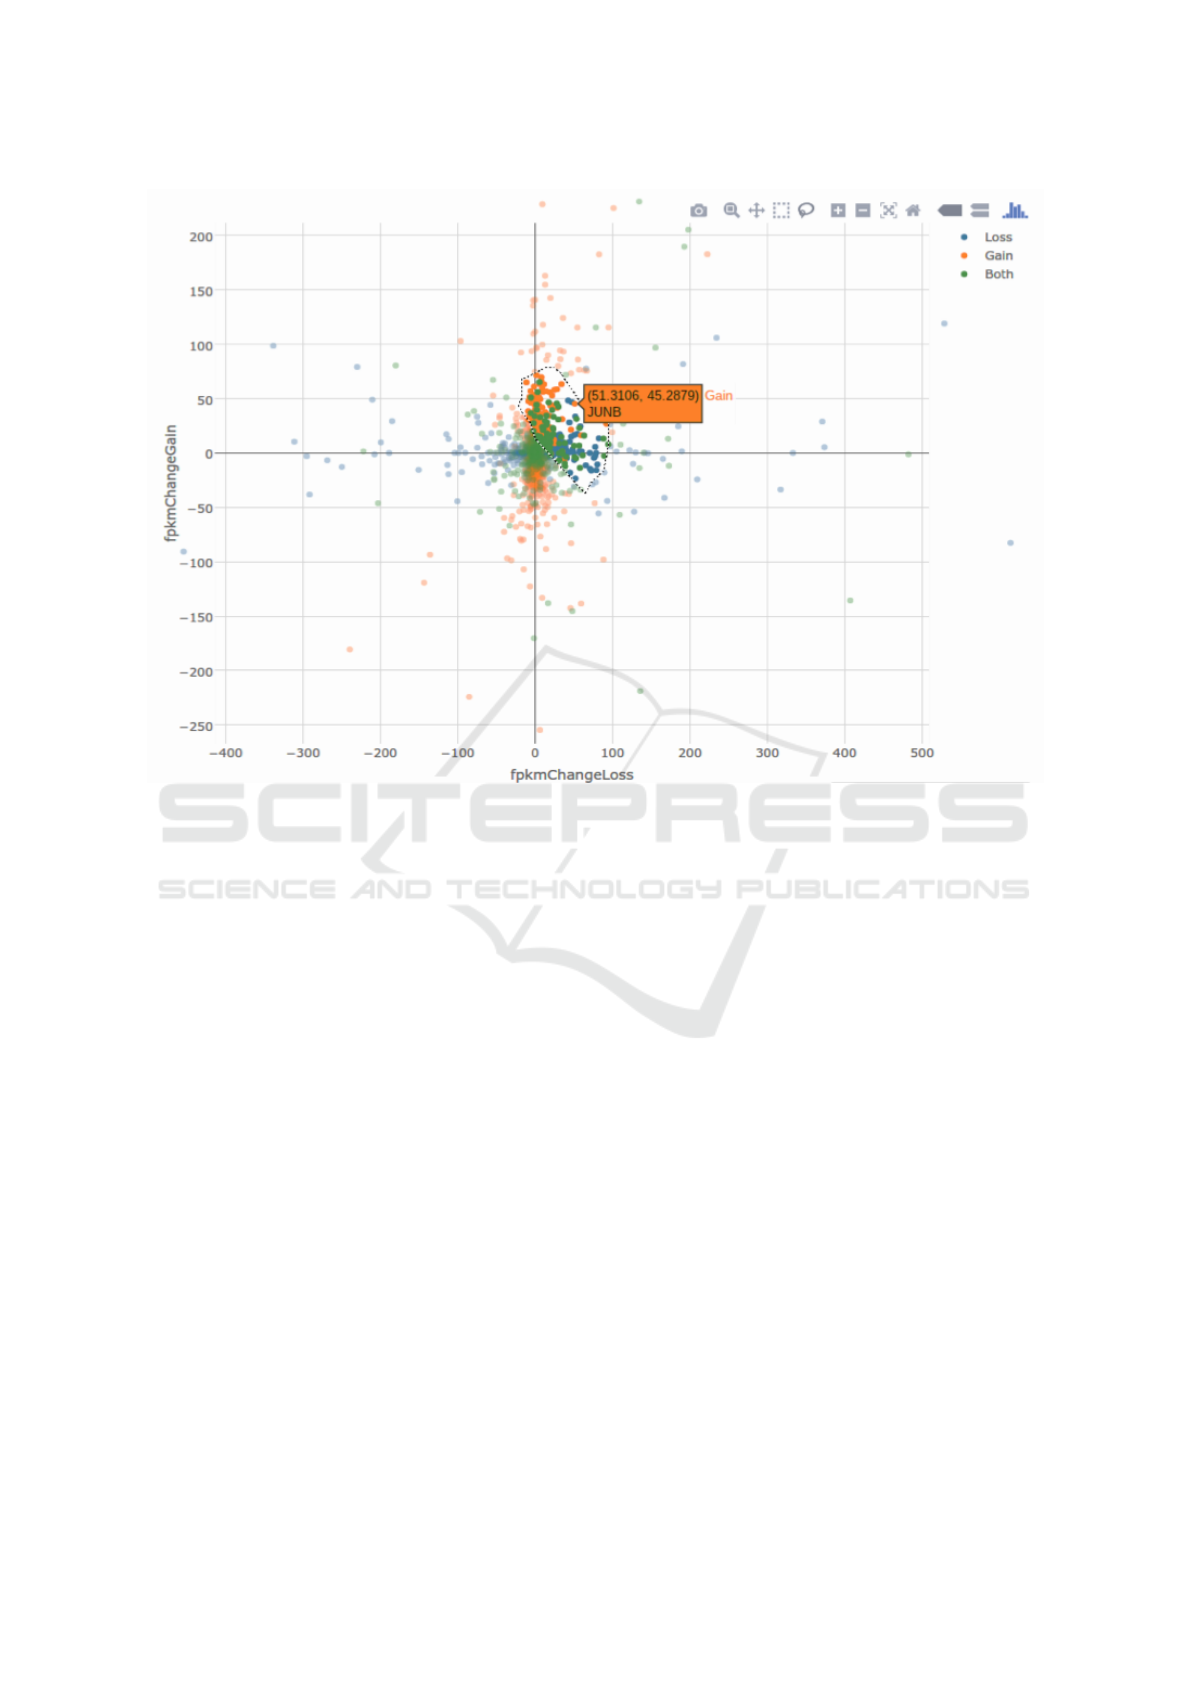
Figure 2: A sample plot generated by DEACT with the Fli1 data. The graph has been zoomed in on the center and an area has
been selected through the lasso tool. The hover tag is displayed for one of the points, a gene significantly affected by only the
condition named ”Gain” by the user.
pression measured in Fragments Per Kilobase of tran-
script per Million mapped reads (fpkm) or log fold
change, and (3) a measure of significance (i.e. p-value
or q-value). Upon uploading data, the fields for these
three components must be specified for both experi-
mental conditions using a drop-down selection menu
of the data columns (Figure 1C). DEACT automati-
cally subsets transcripts into categories based on their
differential expression in the two experimental condi-
tions being studied (Figure 1D). These subsets can be
selectively added to the data viewing table. Custom
subsets may be added directly from the scatterplot.
The second section, PLOT DATA, plots the entire
data set on an interactive scatterplot, which includes
zoom, pan, and hover controls (Figure 1). Each sig-
nificantly differentially expressed gene is plotted by
the change in its expression, either in fragments per
kilobase per million (fpkm) or by log
2
fold change,
which was specified in the MANAGE DATA section.
The plot displays the gene symbol/id and differential
expression value when the user hovers over a data
point (Figure 2). Data can be selected by box (rect-
angular) or lasso (free shape) selection. All points
within the selection will be included in the data view-
ing table. If plotting by fold change, transcripts with
infinite fold changes will not be graphed, but the user
may choose to include them in the data viewing table.
After managing data (uploading data, specifying
fields, and selecting categories), users can use the
VIEW DATA feature which displays select data in a
table format with search and sorting options. This fea-
ture allows users to preview their data before down-
loading.
Finally, the user-curated dataset can be down-
loaded as a tab-delimited text file for further analy-
sis, such as pathway analysis. The user may choose
which columns from the dataset to include in the file.
3 USAGE EXAMPLE
DEACT was tested using RNA-Seq data from
Friend Leukemia Virus Integration 1 (FLI1) research.
Specifically, two independent RNA-Seq studies were
analyzed with DEACT: (1) gain-of-function (GOF)
and (2) loss-of-function by knockdown (LOF) exper-
iments in MDA MB231, an aggressive human breast
cancer cell line. FLI1 belongs to the ETS family of
BIOINFORMATICS 2017 - 8th International Conference on Bioinformatics Models, Methods and Algorithms
156
transcription factors, which are associated with key
cellular processes dysregulated in cancer cells (Wat-
son, 2010). Although aberrant expression of FLI1 has
been observed in hematological cancers, it was re-
cently found to also be dysregulated in breast cancer,
an epithelial-derived cancer (Scheiber et al., 2014).
Fli1
Knockdown
Overexpression
GOF
Control
LOF Control
Differential
expression analysis
Differential
expression analysis
DEACT subsets
GOF only
LOF only
↑↓GOF, ↑↓LOF
Custom
↑GOF, ↑LOF
↓GOF, ↓LOF
↑GOF, ↓LOF
↓GOF, ↑LOF
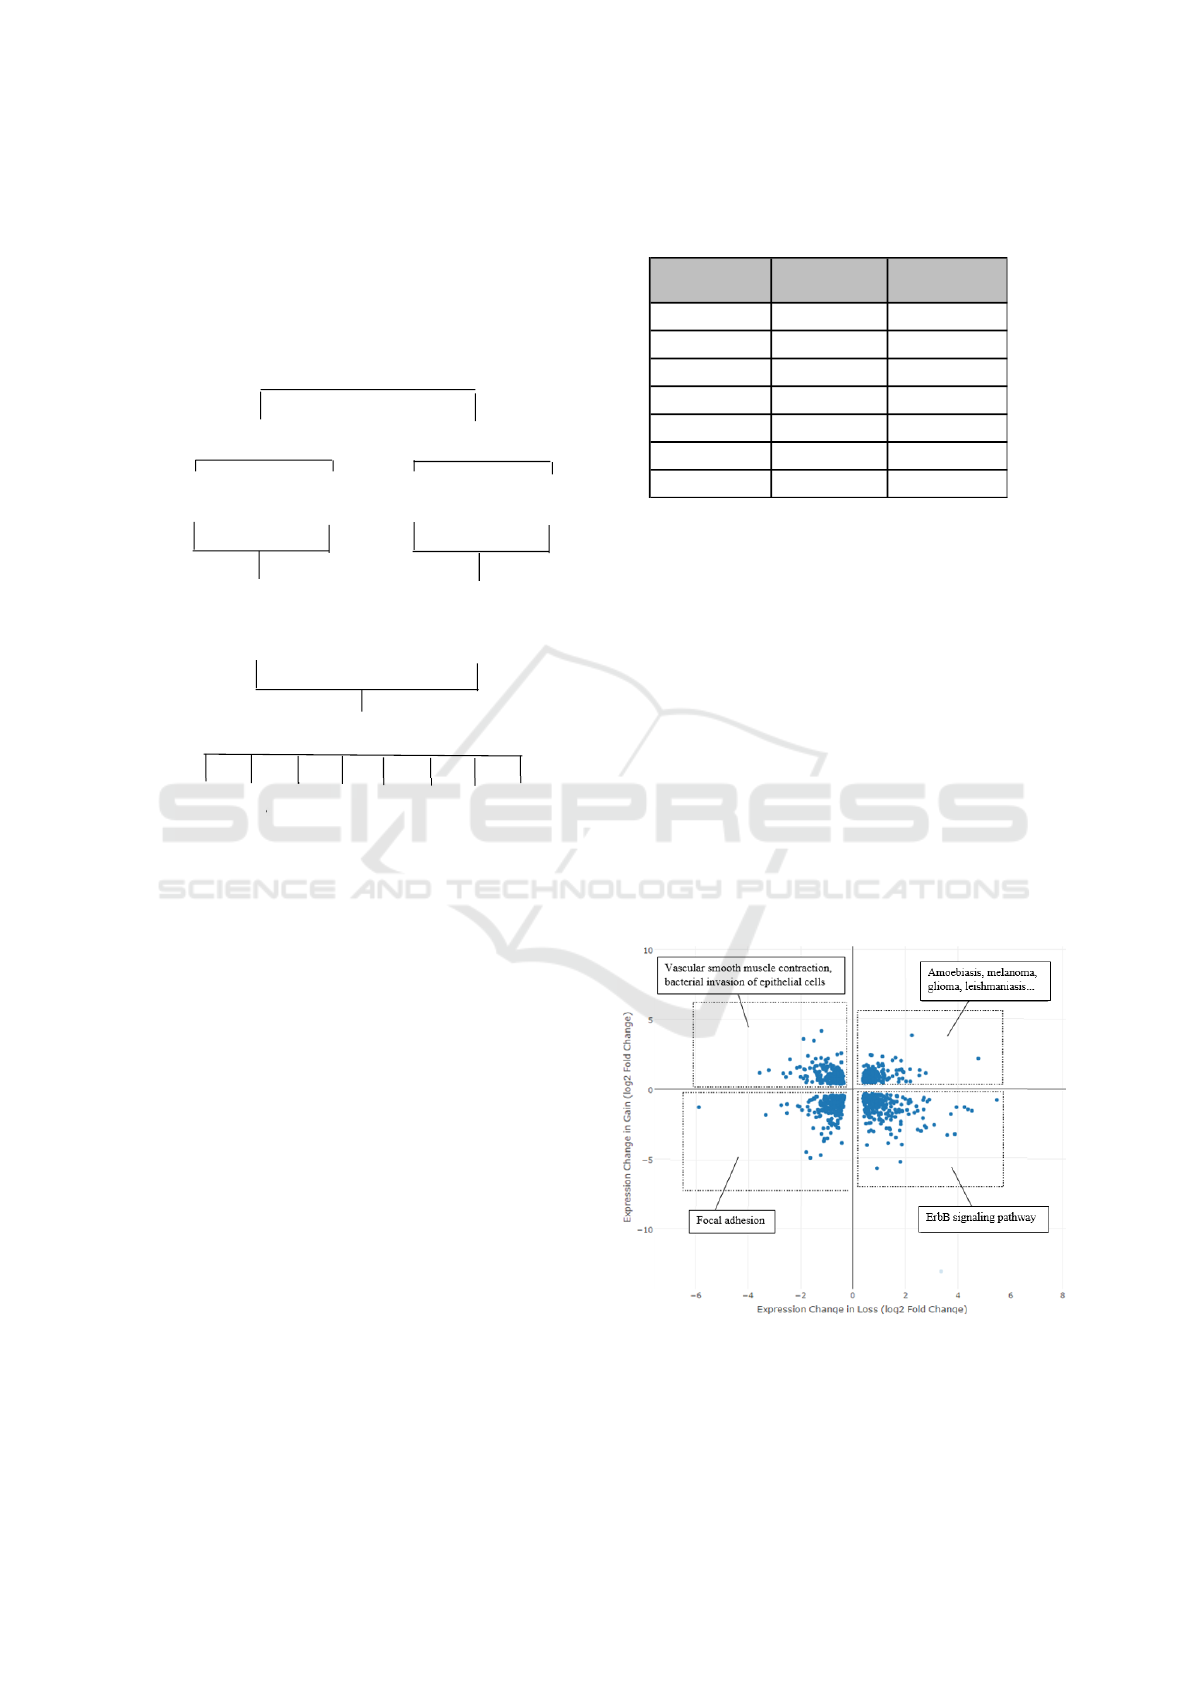
Figure 3: Diagram of the FLI1 loss- (LOF) and gain-of-
function (GOF) studies. The quantified differential expres-
sion data from both were subsetted by DEACT into cate-
gories with possible biological relevance.
An shRNA constructed in lentiviruses was used in
the FLI1 LOF experiment, while adenovirus was used
in the FLI1 GOF experiment (Figure 3). Three bi-
ological replicates each were prepared for the LOF,
GOF, and lentival and adenoviral controls. RNA
was extracted and sequenced using the Illumina
HiSeq2500. Sequenced reads were filtered for quality,
processed, mapped, and quantified using the Tuxedo
Suite (Bioinformatics, 2011; Bolger and Giorgi,
2014; Trapnell et al., 2012). Probability values were
corrected for the false discovery rate. CummeRbund
was used to prepare a file for DEACT from CuffDiff
data from each experiment.
DEACT was able to visualize and subset data from
both studies. DEACT categorized significant (α =
0.05) genes affected in each FLI1 experiment (Table
Table 1: Genes categorized by regulation direction across
two FLI1 expression studies. DEACT identified signifi-
cantly dysregulated transcripts.
Gain-of-
Function FLI1
Loss-of-
Function
Genes
3318
1305
956
271
199
223
263
↑
↓
↑
↓
↑
↓
↑
↓
↑
↑
↓
↓
↓
↑
↑
↓
1). This information may prompt preliminary bio-
logical conclusions from the data. For example, take
the 271 genes that were up-regulated and the 199 that
were down-regulated in both conditions. From these
subsets, it can be concluded that of genes that were af-
fected by both conditions, 470 (49%) were regulated
in the same direction. This result is counter-intuitive;
GOF and LOF studies are rarely performed for the
same gene in part because their results are expected
to be non-informative due to an expected contrast.
The subsets that show contraregulation between the
gain-of-function and the loss-of-function may be of
particular interest to researchers because expression
of these genes may be dependent upon expression of
FLI1. Similarly, pathway analysis of these subsets
may show which cellular functions are correlated with
FLI1 expression.
Figure 4: A visual representation of pathway analysis by
subset. Small subsets from Table 1 are denoted with signif-
icant metabolic pathways related to those genes.
The genes categorized into the last four rows of
Table 1 were downloaded as four subsets. These se-
DEACT: An Online Tool for Analysing Complementary RNA-Seq Studies - A Case Study of Knockdown and Upregulated FLI1 in Breast
Cancer Cells
157
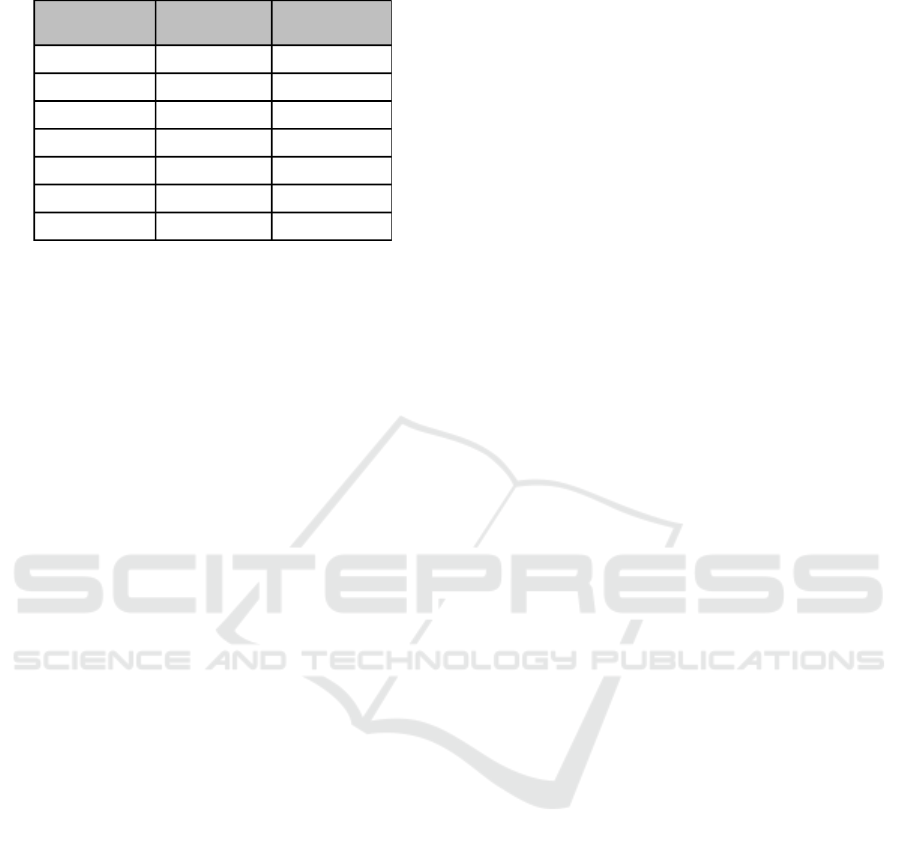
Table 2: Pathway categorized by regulation direction across
two FLI1 expression studies.
Gain-of-
Function FLI1
Loss-of-
Function
Pathways
153
64
69
33
35
35
33
↑
↓
↑
↓
↑
↓
↑
↓
↑
↑
↓
↓
↓
↑
↑
↓
lections represent the possible regulation patterns for
genes affected by both conditions. Each subset, as
well as the full dataset, were subjected to pathway
analysis using iPathwayGuide (Draghici et al., 2007).
Each subset is labeled with its significant (α = 0.05)
pathways (Figure 4).
The top 100 pathways for genes up-regulated in
GOF, down-regulated in GOF, and so on for LOF
were identified and similarly categorized in Table 2.
These tables demonstrate how subsets of genes may
translate into subsets of pathways. For example, of
the original 400 pathways, 33 (8.25%) involve genes
up-regulated in GOF and down-regulated in LOF.
Closer investigation is necessary to determine if each
pathway as a whole was up- or down-regulated. Path-
ways that are up-regulated in one condition and down-
regulated by the other are often of particular interest,
as these may indicate which cellular processes are di-
rectly correlated with a condition.
4 DISCUSSION
DEACT’s interactive user interface for rapid visual-
ization and categorization of expression data is intu-
itive for researchers with little or no programming ex-
perience. It supports any two complementary studies
and can compare biological replicates or contrasting
experimental conditions. DEACT automatically cat-
egorizes significant data points by their response to
each condition. These practically relevant categories
may be downloaded as subsets for further study, for
example, in a file format accepted by iPathwayGuide
and other programs. Alternatively, unique subsets can
be selected directly from the user interface. The re-
sponsive user interface allows users to instantly iden-
tify and select any set of genes, thus achieving a level
of engagement that neither scripts nor traditional plots
offer.
The simple, interactive design makes DEACT an
effective collaboration tool for research laboratories.
Unlike biclustering, DEACT can be effectively used
to interpret small datasets and does not require the
additional time or training required to optimize a bi-
clustering algorithm. Instead, it is built to quickly an-
swer preliminary questions about new RNA-seq data
to prompt downstream analyses and encourage a flow
of discussion. With DEACT, researchers may easily
create highly customizable datasets to fit any ques-
tion, however specific. In the future, pathway analysis
may be integrated with DEACT in order to visualize
cellular responses on the pathway level as well as the
gene level. This feature may be incorporated into the
user interface, as shown in Figure 3.
DEACT adds to a growing set of meta-analytical
tools for RNA-Seq data. With a tool like DEACT,
non-computationally trained researchers can mine
their data for novel insights on gene expression and
function. Such meta-analyses not only augment our
understanding of cellular processes, but they have the
potential to lead to novel life-saving therapeutics.
ACKNOWLEDGEMENTS
The authors would like to thank the College of
Charleston for hosting the NSF Omics REU which
is supervised by the National Science Foundation
DBI Award 1359301. We also acknowledge sup-
port from the Genomics Shared Resource, Hollings
Cancer Center, Medical University of South Car-
olina. This shared resource is supported in part by the
Hollings Cancer Center, Medical University of South
Carolina Support Grant (P30 CA 138313).
REFERENCES
Bioinformatics, B. (2011). Fastqc a quality control tool
for high throughput sequence data. Cambridge, UK:
Babraham Institute.
Bolger, A. and Giorgi, F. (2014). Trimmomatic: a flex-
ible read trimming tool for illumina ngs data. URL
http://www. usadellab. org/cms/index. php.
Draghici, S., Khatri, P., Tarca, A. L., Amin, K., Done, A.,
Voichita, C., Georgescu, C., and Romero, R. (2007).
A systems biology approach for pathway level analy-
sis. Genome research, 17(10):1537–1545.
Love, M. I., Huber, W., and Anders, S. (2014). Moderated
estimation of fold change and dispersion for rna-seq
data with deseq2. Genome biology, 15(12):1.
Luo, W. and Brouwer, C. (2013). Pathview: an
r/bioconductor package for pathway-based data
integration and visualization. Bioinformatics,
29(14):1830–1831.
BIOINFORMATICS 2017 - 8th International Conference on Bioinformatics Models, Methods and Algorithms
158

Luo, W., Friedman, M. S., Shedden, K., Hankenson, K. D.,
and Woolf, P. J. (2009). Gage: generally applicable
gene set enrichment for pathway analysis. BMC bioin-
formatics, 10(1):1.
Plotly Technologies Inc. (2015). Collaborative data science.
Pontes, B., Gir
´
aldez, R., and Aguilar-Ruiz, J. S. (2015). Bi-
clustering on expression data: A review. Journal of
biomedical informatics, 57:163–80.
Ritchie, M. E., Phipson, B., Wu, D., Hu, Y., Law, C. W.,
Shi, W., and Smyth, G. K. (2015). limma pow-
ers differential expression analyses for rna-sequencing
and microarray studies. Nucleic acids research, page
gkv007.
Robinson, M. D., McCarthy, D. J., and Smyth, G. K. (2010).
edger: a bioconductor package for differential expres-
sion analysis of digital gene expression data. Bioin-
formatics, 26(1):139–140.
Rog
´
e, X. and Zhang, X. (2013). Rnaseqviewer: visualiza-
tion tool for rna-seq data. Bioinformatics, page btt649.
RStudio, Inc (2014). Easy web applications in R. URL:
http://www.rstudio.com/shiny/.
Scheiber, M. N., Watson, P. M., Rumboldt, T., Stanley, C.,
Wilson, R. C., Findlay, V. J., Anderson, P. E., and Wat-
son, D. K. (2014). Fli1 expression is correlated with
breast cancer cellular growth, migration, and invasion
and altered gene expression. Neoplasia, 16(10):801–
813.
Seo, M., Yoon, J., and Park, T. (2015). Gracomics: soft-
ware for graphical comparison of multiple results with
omics data. BMC genomics, 16(1):1.
Trapnell, C., Roberts, A., Goff, L., Pertea, G., Kim, D., Kel-
ley, D. R., Pimentel, H., Salzberg, S. L., Rinn, J. L.,
and Pachter, L. (2012). Differential gene and tran-
script expression analysis of rna-seq experiments with
tophat and cufflinks. Nature protocols, 7(3):562–578.
Watson, D. K., Turner, D. P., Scheiber, M. N., Findlay, V. J.,
and Watson, P. M. (2010). Ets transcription factor
expression and conversion during prostate and breast
cancer progression. Open Cancer J, 3:24–39.
Zhou, X., Lindsay, H., and Robinson, M. D. (2014).
Robustly detecting differential expression in rna se-
quencing data using observation weights. Nucleic
acids research, 42(11):e91–e91.
DEACT: An Online Tool for Analysing Complementary RNA-Seq Studies - A Case Study of Knockdown and Upregulated FLI1 in Breast
Cancer Cells
159
