
Radio Frequency CMOS Chem-bio Viscosity Sensors based on
Dielectric Spectroscopy
Subhajit Guha and Christian Wenger
IHP, Leibniz Insititute for Innovative Microelectronics, Frankfurt (Oder), Germany
Keywords: CMOS Viscosity Sensor, Dielectric Sensor, RF Viscosity Sensor, High Frequency Viscosity Sensor.
Abstract: This paper presents a CMOS Radio frequency dielectric sensor platform for the detection of relative viscosity
changes in a fluid sample. The operating frequency of the sensor is 12.28 GHz. This frequency range has been
chosen for high signal to noise ratio and also to avoid other low frequency dispersion mechanisms for future
lab on chip applications. The sensor chip has been fabricated in 250 nm BiCMOS technology of IHP. The
measurements conducted to show the relative viscosity variation detection capability of the sensor chip, were
based on mixtures of glycerol and water as well as glycerol and organic alcohol. The detection limit of
viscosity is dependent on the permittivity contrast of the sample constituent. Therefore, it is also shown the
choice of frequency inherently aids in the permittivity contrast of the sample constituents.
1 INTRODUCTION
Viscosity sensors are widely developed and utilised
primarily for sensing and analysis of oil or fuel
(Agoston et al., 2005, Perez and Hadfield, 2011).
There is a significant use of such sensors in the
automotive industry where detection of
contamination or breakdown of oil is of extremely
high relevance. Therefore, there is a wide range of
commercially available robust viscosity sensors. The
working of such sensors are mostly based on
mechanical or piezoelectrical sensing mechanisms
(Agoston et al., 2005, Thalhammer et al., 1998, Shih
et al., 2001, Brouwer et al., 2011). The use and
success of viscosity sensors have inspired researchers
to use the same principles for various other
applications.
In the recent past, there have been efforts to use
the principles of viscosity sensors in biosensing
applications. Various research groups have designed
and developed sensors to estimate glucose
concentration in blood (Boss et al., 2012, Zhao et al.,
2007) or analyse blood coagulation using the concept
of viscosity change (Cakmak et al., 2014). The
sensing principle for these developed viscosity based
biosensors are also mechanical or piezoelectrical,
influenced directly from the established commercial
viscosity sensor. The mechanical principle is based
on the deflation of cantilevers or beams when a fluid
comes in contact with the same. The viscosity of the
fluid determines the degree of deflation or
deformation of the beam. A significant drawback
suffered by this kind of sensors is the relaxation of the
beam or the cantilever back to the original position.
Therefore, there can be considerable calibration
issues for such devices. Piezoelectric based sensors
require a piezomaterial, where a variation of
mechanical stress on the piezo material leads to an
electrical output, such as voltage or current,
depending on the read out mechanism. The adhesion
or the influence of the biological sample on the
piezomaterial pose a serious challenge for such
sensors. Recently, MEMS based CMOS compatible
viscosity sensor was shown by (Cakmak et al, 2014).
working on the same principle of micro-cantilever
deformation. Although, reduction in sample volume
was achieved, the cantilever approach could still
suffer from calibration failures. Impedance
spectroscopy method was discussed by (Perez and
Hadfield, 2011), where the authors described a
viscosity sensor based on the detection of variation of
permittivity. The frequency range of operation is in
the order of few 1 MHz. Application of this sensor in
biological applications will be critical, as there are
other dispersion mechanisms of biological samples in
this frequency range which could influence the signal
to noise ratio for viscosity characterization.
In this work, we propose CMOS on chip dielectric
sensor for viscosity characterization. The frequency
range of operation is in the order of 12 GHz. In
142
Guha S. and Wenger C.
Radio Frequency CMOS Chem-bio Viscosity Sensors based on Dielectric Spectroscopy.
DOI: 10.5220/0006151901420148
In Proceedings of the 10th International Joint Conference on Biomedical Engineering Systems and Technologies (BIOSTEC 2017), pages 142-148
ISBN: 978-989-758-216-5
Copyright
c
2017 by SCITEPRESS – Science and Technology Publications, Lda. All rights reserved
previous works, it was shown that such sensors can
be used for the detection of concentration of cells and
particles in a suspension (Guha et al., 2015), detection
of biomarkers like creatinine and more (Guha et al.
2015). The sensing principle is based on the detection
of dielectric change using a capacitive sensor
embedded in a resonant CMOS oscillator. In this
work, it is proposed that the viscosity variation of
fluid samples can be measured by the detection of the
change in the dielectric constant of the fluid. Such a
sensor can be envisaged for future lab on chip
application like characterization of sputum for
detection of lung diseases. In this paper we will
describe the working principle of the sensor and show
the operation of the sensor with mixtures of liquids
with different viscosities. The operating frequency of
the sensor is chosen to be 12 GHz; this high frequency
leads to small chip size and hence small sample
volume. Additionally, this frequency range enables a
better signal to noise ratio for sensing due to strong
contrast in dielectric permttivities.
The paper is organised in the following manner:
Section 2 describes the sensor and the high frequency
operation. Section 3 shows the results. The
concluding remarks and the application of such a
sensor is described in section 4.
2 RF SENSOR OPERATION
The sensor operation is based on the detection of
dielectric constant of the sample using a capacitive
sensor embedded in the CMOS oscillator. The
variation of the capacitance due to the permittivity of
the samples leads to the tuning of the resonant
frequency of the oscillator. Oscillator based dielectric
sensors have been researched upon considerably for
the past years and the working principle can be found
extensively in literature (Guha et al., 2015, Jamal et
al., 2014, Wang et al., 2010). In this work, we extend
this sensor platform for viscosity detection.
Although, there are considerable amount of
viscosity sensors, CMOS based viscosity sensors are
still not well established. Such sensors could be
extremely useful for lab on chip applications. For
example, sputum samples from different patients
have different viscosities and the detection of the
same can enable us to detect lung diseases at a very
early stage. Viscosity change of a liquid sample can
be detected from the permittivity. This is due to the
relationship between the permittivity of the overall
liquid and the fraction of its various constituents. For
example, a glycerol water mixture sample has
different viscosities depending on the amount of
water in the mixture. At the same time, different water
content in the mixture leads to different permittivity
of the sample. Therefore, there exists a correlation
between the changes in viscosity with the change in
the effective dielectric constant of the sample. It
should be also noted here, that the knowledge of the
fluid constituents of the sample is needed for this kind
of indirect viscosity sensing. In this context, the
question arises if high frequency sensor is of
relevance for the detection of viscosity change. We
have seen in literature that high frequency dielectric
sensors are extremely useful for the detection of
concentration of particles in the suspension (Guha et
al., 2015). In the case of viscosity sensor based on
dielectric measurements, a high signal to noise ratio
can be obtained if the contrast between permittivities
of the constituents are considerably high. Considering
the glycerol water mixture example again, we find
from the literature that the low frequency permittivity
of water is around 80 and that of glycerol is 42.5. This
provides a considerable amount of contrast in the
dielectric permittivities. Therefore, a low frequency
detection could be useful. However, if the sensor
system has to be a unique platform applied to lab on
chip applications, it can be extremely critical at low
frequency to obtain a high signal to noise ratio. This
is because, the biological samples show dispersion
mechanisms at low frequencies and can lead to
considerable variation in the results. Therefore, a
chosen operating frequency of 12 GHz can be useful.
At this frequency considering the glycerol water
mixture as an example again, the permittivity contrast
is still of the same order.
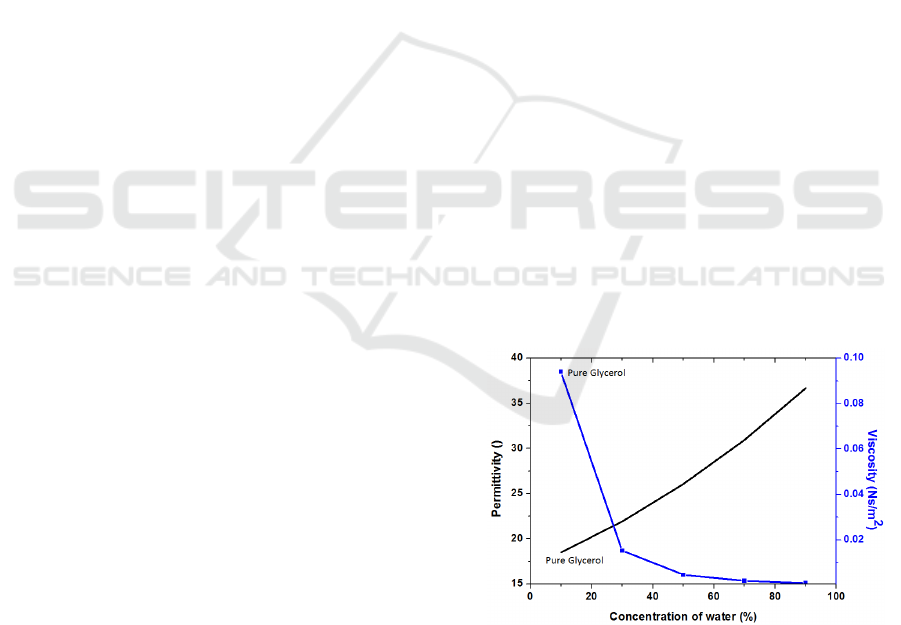
Figure 1: Permittivity and viscosity variation of glycerol
and water mixture with respect to water content at 12 GHz.
The permittivity of glycerol is approximately 17 and
that of water is 40 at this frequency range. Therefore,
operating the sensor in this frequency range provides
the advantage of obtaining the permittivity contrast
and at the same time avoids the low frequency
Radio Frequency CMOS Chem-bio Viscosity Sensors based on Dielectric Spectroscopy
143
dispersion mechanisms. Fig 1 shows the variation of
permittivity and viscosity as a function of water
content in the solution at 12 GHz. Mixture theory was
used to calculate the effective permittivity of the
mixture and the effective viscosity.
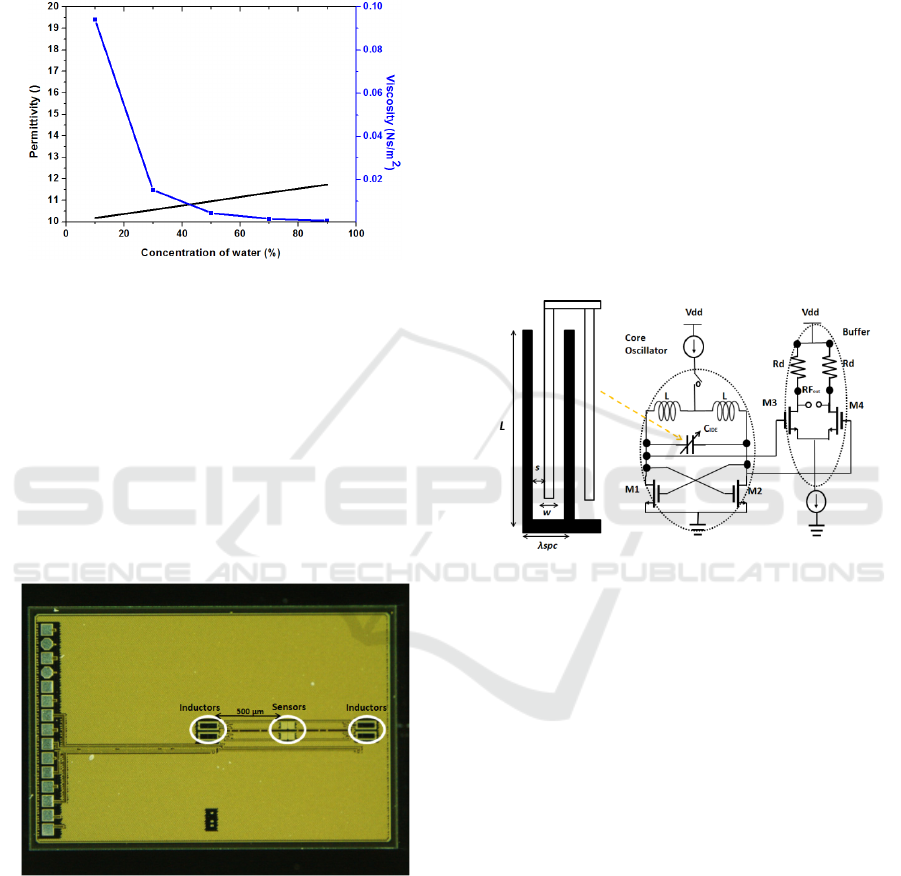
Figure 2: Permittivity and viscosity variation of glycerol
and water mixture with respect to water content at 60 GHz.
In case of higher frequency of operation of the sensor,
there is a loss on the dielectric contrast. This is shown
in Fig. 1 and Fig. 2. At 12 GHz, the variation in
permittivity of the glucose water mixture due to water
content variation is considerably higher when
compared to the variation of permittivity of the same
at 60 GHz. However, the variation in the viscosity of
the mixture due to its water content is uniform at both
the frequencies, as viscosity is a frequency
independent parameter.
Figure 3: Chip Photograph of sensor chip.
Additionally, the inherent advantage of the high
frequency sensor is the sensor chip size and in turn
the sample volume required. The sensor chip photo is
shown in Fig. 3.
The sensors as seen from a closer look are
interdigitated capacitors (IDC) with over-all size of
50 µm x 50 µm. Therefore, sample volume of the
order of µl is required for detection. The planar IDC
is a fringing field sensor; the fringing electric fields
between the adjacent fingers are utilised to detect the
dielectric permittivity of the sample placed on top of
it. The penetration depth of the fringing fields is the
function of the geometry of the IDC structure. For
homogeneous solutions, where, the permittivity is
uniform all over the solution the penetration depth is
not of significance. Therefore, it can be understood
that the IDC structures can be used for accurate near
field sensing approaches. The sensor chip was
fabricated in the 250 nm technology of IHP , with
f
t
/f
max
of 180 GHz/250 GHz. The overall chip size 1.8
mm x 3 mm. The larger dimension of the chip in spite
of smaller sensor area will be explained in the
subsequent experimental and results section.
The sensor architecture details can be found in
literature. In Fig. 4, the schematic of the sensor
architecture is shown.
Figure 4: Sensor architecture: Sensor IDC embedded in
CMOS oscillator.
As mentioned above the sensor capacitor is embedded
in the oscillator and the read out parameter of the
sensor is the oscillating frequency of the sensor.
3 EXPERIMENTS AND RESULTS
RF boards were prepared for measurements with
viscous liquids. The sensor chip was wire bonded to
the board. For the first measurements with the
viscous liquid samples no mircrofluidic integration
was done. Therefore, one major challenge was
encountered while the measurement of liquids, where
the bond wires used or the bonding of the chip could
be broken due to interaction with the fluid. In order to
avoid this scenario, measures were taken to protect
the bond wires. This was done by sealing the chip pad
area with a dielectric material. This is shown in Fig.
5.
BIODEVICES 2017 - 10th International Conference on Biomedical Electronics and Devices
144
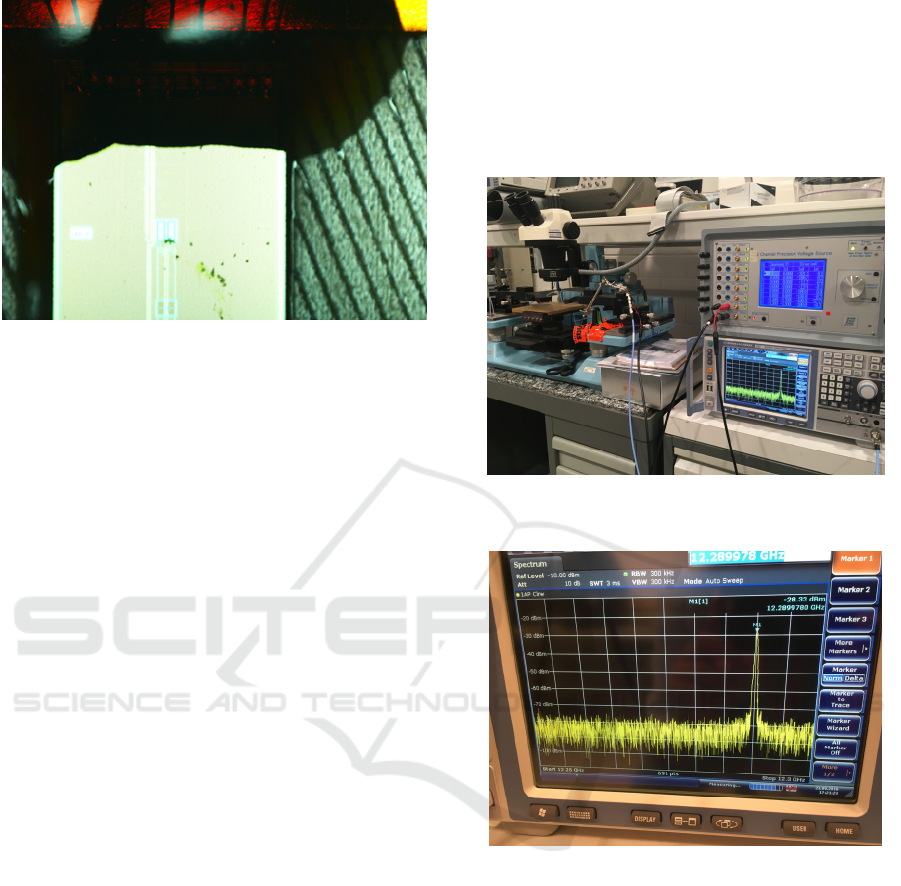
Figure 5: Sensor chip with the dielectric material protecting
the bond pads and bond wires.
The dielectric medium prevents the bond wires
coming in direct contact with the liquid medium and
therefore, no breaking of bond wires can take place.
This kind of an approach adds an additional degree of
robustness to the chip, wherein, the sensor chip can
be dipped in the liquid for accurate calibration of the
chip. This method also aids in the cleaning of the chip
using ethanol. Therefore, after conduction of every
measurement the sensor area can be cleaned for the
next set of measurements. This is a significant issue
when such kinds of sensors are used for accurate long
term usage.
The influence of dielectric packaging of the chip
can be seen on the RF output. It is known, that the RF
measurement devices are calibrated to 50 Ohms,
Therefore, the output lines for the RF signal is
designed to have a characteristic impedance of 50
Ohms. The same is done for the RF lines on the board
in order to incur minimal losses to the RF signal due
to reflection. The bond wires account for some losses.
However, encapsulating the bond pad area with the
dielectric medium results in additional losses to the
RF signal which can reduce the RF output power.
However, the RF output power is considerably higher
than the noise floor of the measurement device and
can be accurately measured.
Fig. 6 shows the measurement setup of the sensor
chip with the viscous liquid. A Rhode and Schwarz
X-band spectrum analyser has been used for the
measurement of the RF spectrum.
It can be seen from the inset view of the spectrum
analyser screen (Fig. 7), that the measured RF output
power (-27 dBm) is considerably higher than the
noise floor of the device. The measurements were
conducted in 2 steps. Initially a calibration of the
sensor chip was performed with known alcohols with
known values of permittivity and viscosity. In the
second set of measurements the mixture of glycerol
and water was used to measure the oscillator output
with varying viscosity. The last set of measurements
were performed with the mixture of glycerol and
ethanol to show the significance of knowing the
constituents of the sample for indirect viscosity
measurement.
Figure 6: Measurement setup showing Spectrum analyser,
power supply and chip holder.
Figure 7: Inset of spectrum analyser. The oscillating
frequency with air is 12.28 GHz.
3.1 Calibration
The sensor chip needs to be calibrated with known
alcohols of different permittivities and viscosities.
With no material on top of the sensor, the output
frequency of the sensor is measured to be 12.28 GHz.
This can be seen from the inset view of the spectrum
analyser in Fig. 7. For the next calibration step the
sensor chip was measured with organic alcohols. Four
different alcohols were used for the measurement,
namely, ethanol, methanol, acetone and isopropanol.
Fig. 8 shows the variation of the oscillating frequency
with respect to permittivity of the alcohol.
Radio Frequency CMOS Chem-bio Viscosity Sensors based on Dielectric Spectroscopy
145
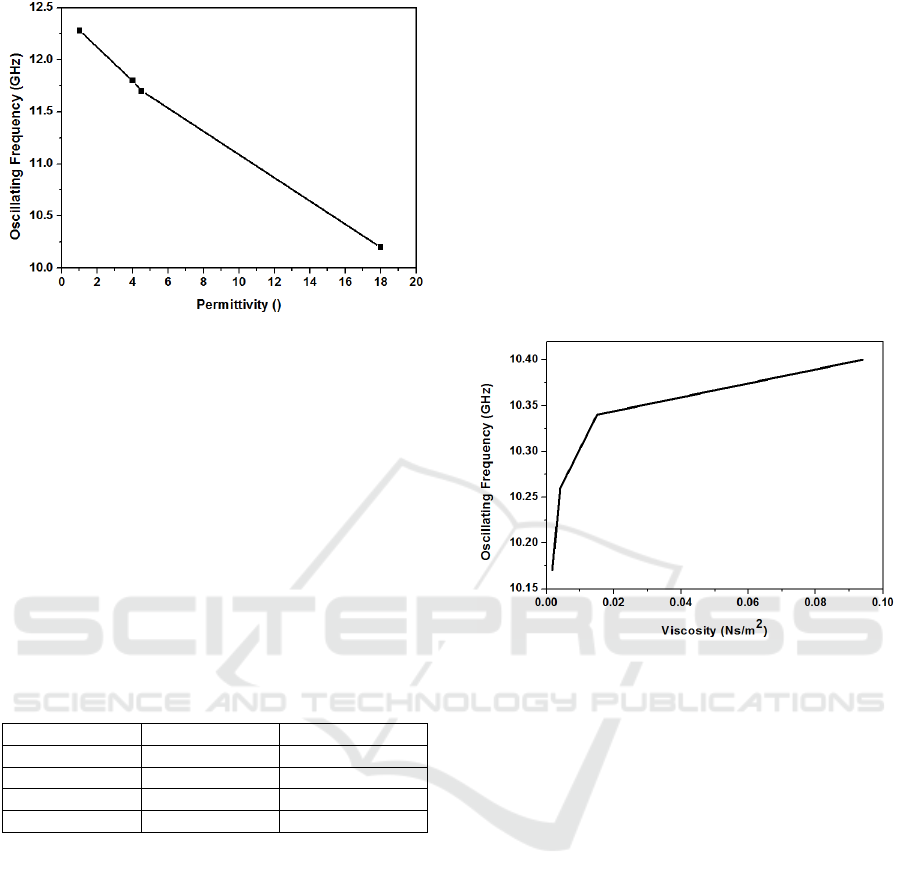
Figure 8: Calibration using different types of organic
alcohols.
It is straight forward to understand the variation of the
output oscillation frequency with respect to
permittivity. As the permittivity increases the
capacitance of the sensor capacitor increases as well.
The output oscillation frequency which has an inverse
relation to the capacitance value of the sensor
capacitor decreases with the increase of the
capacitance. The relative permittivity values of the
alcohols at 12 GHz and at room temperature are given
in Table 1.
The corresponding viscosity and permittivity
values of the alcohols are also shown in Table 1.
Table 1.
Alcohol Permittivity Viscosity(mPa.s)
Isopropanol 4 2.1
Ethanol 4.5 0.983
Methanol 8.2 0.507
Acetone 18 0.30
From Table 1 it is seen that the viscosity values
decrease with the increase in permittivity of the acid.
However, on the other hand, it is seen water has a
permittivity of 42 at 12 GHz and a viscosity of 0.81
mPa.s. Therefore, it can be understood that there is no
relation between the absolute values of the relative
permittivity and the viscosity. The sensor being
ideally a dielectric sensor, can detect variation in the
viscosity of a solution based on the permittivity
variation. Therefore, it is needed to know the
permittivity values of the constituents of a liquid
sample in order to detect the viscosity variation. This
will be shown in more detail with two different
sample mixtures with opposite permittivity trends but
same viscosity trends.
3.2 Viscosity Measurement
The operation of the sensor to detect viscosity
variation is done using the mixture of water and
glycerol. Water being a non-viscous liquid reduces
the viscosity of glycerol considerably with its
increasing concentration. On the other hand, water
has a high permittivity as mentioned in previous
section when compared to glycerol. Therefore,
increasing the concentration of water in the mixture
increases the permittivity of the overall solution. This
was also shown in the previous section. The variation
of the oscillation frequency with respect to viscosity
of the glycerol water mixture is shown in Fig.9.
Figure 9: Variation of oscillating frequency of the oscillator
with respect to viscosity variation of glycerol water
solution.
3.3.1 Discussion
It should be noted here, that the sensor architecture
described here is not used to detect an absolute value
of viscosity of a given sample. Detection of absolute
value of viscosity based on an electrical method is not
feasible, unless, there is a direct mathematical
correlation between viscosity and an electrical
quantity. The sensor architecture in this work is used
to detect a relative variation in the viscosity of a fluid
sample based on its constituents. This argument
becomes clear when a similar experiment was
performed with a mixture of glycerol and ethanol.
Prior to the that, it is important to understand the
exclusiveness of viscosity and permittivity. Fig. 10
shows the variation of permittivity with respect to the
percentage of ethanol in ethanol glycerol mixture.
BIODEVICES 2017 - 10th International Conference on Biomedical Electronics and Devices
146
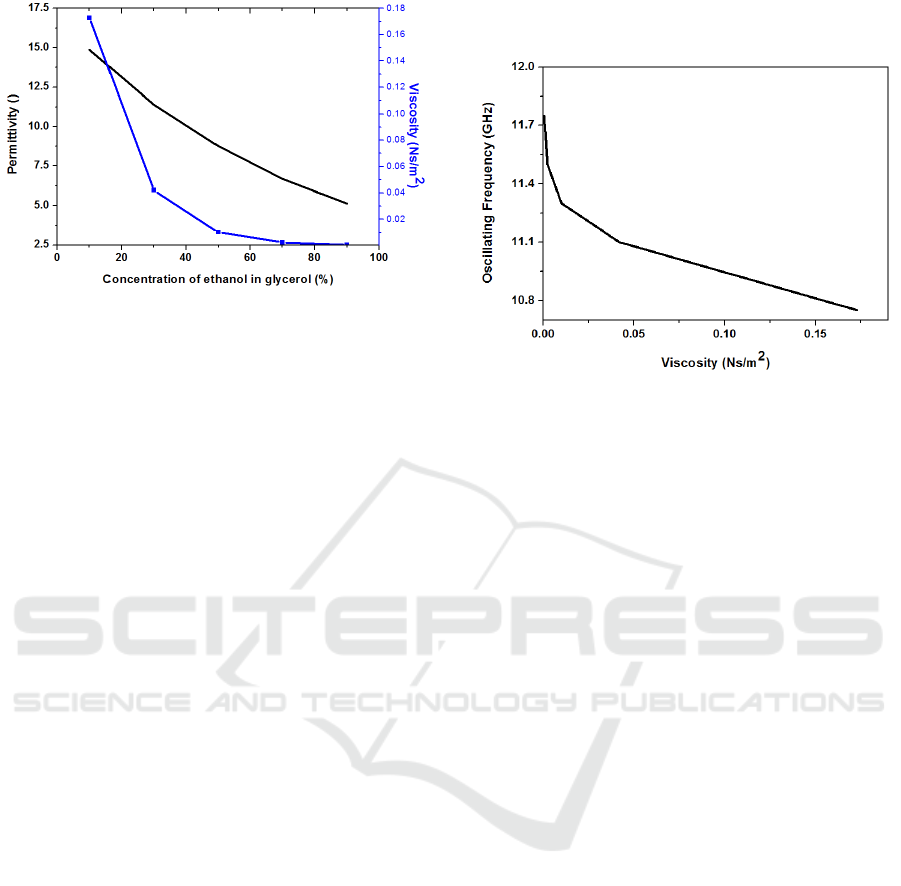
Figure 10: Variation of permittivity and viscosity with
ethanol concentration in ethanol glycerol mixture.
It can be seen that as the concentration of ethanol
increases in the ethanol glycerol mixture, the
permittivity and the viscosity decrease for the overall
mixture. This is in contrast to the glycerol water
mixture where the increase in water content in the
glycerol water mixture increased the permittivity and
reduced the viscosity. Therefore, it can be very well
understood that the permittivity for a given viscous
sample is dependent on the constituents of the sample
The sensor detects only the permittivity and not
the absolute value of viscosity of the solution. This
can be seen with the experiment on the sensor chip
with the mixture of ethanol and glycerol. The results
of the same are shown in Fig. 11.
It is observed, that the oscillating frequency
reduce with increasing viscosity (reduction in ethanol
content in the solution). This is because ethanol has a
lower permittivity as compared to glycerol.
Therefore, increasing the ethanol concentration
reduces the permittivity of the solution. Ethanol also
has a substantially low viscosity as compared to
glycerol. Therefore, increasing the concentration of
ethanol reduces the viscosity of the solution as well.
This was not the case for water glycerol mixture,
where permittivity of the overall solution increased
with increasing water content due to high permittivity
of water and viscosity decreased with increasing
water content.
Now the question arises about the use of the
sensor in lab on chip application like characterization
of sputum as was mentioned in the introductory
section. From the literature it is known that the
viscosity of sputum sample varies with the constituent
it for different patients with lung disease (M. Lopez-
Vidriero et al., 1973). Especially the water content of
the sputum varies for different patients. Knowing the
constituents of the sputum, the variation of water
content will vary the relative viscosity of the sputum
and along with it its permittivity. This sensor
architecture can thus ideally be used for the detection
of the sputum viscosity variation.
Figure 11: Variation of oscillating frequency of oscillator
with respect to viscosity of ethanol glycerol mixture.
4 CONCLUSIONS
In this work we have shown a high frequency sensor
operating in the frequency range of 12 GHz to detect
the viscosity change in a fluid. It was shown that the
choice of the frequency range was based on high
signal to noise ratio due to high contrast in dielectric
permittivity. At lower frequencies, the contrast
between the dielectric permittivities of the liquids are
still high, however, other dispersion effects might
influence the use of the sensor in future lab on chip
applications. On the other hand, very high frequency
operation reduces the contrast between the dielectric
permittivities of the samples, and was shown in
analytically for glycerol water mixture at 12 GHz and
60 GHz. Solutions with different viscosities were
measured and a shift in the resonant frequency of the
sensor oscillator was shown in this work. Two
solution mixture was characterized: glycerol water
mixture and glycerol ethanol mixture. For glycerol
water mixture, the increase in water content increased
the mixture permittivity and reduced the mixture
viscosity. On the other hand, for the ethanol glycerol
mixture, the permittivity and viscosity decrease with
increasing ethanol content. The sensor architecture is
suitable to detect the permittivity change based on
which the solution viscosity of known constituents
can be obtained. It was highlighted that this method
is an indirect way of detection of viscosity. This is due
to the fact that viscosity being a mechanical quantity,
cannot be measured directly with an electrical
quantity. Therefore, knowing the characteristics of
the constituents is extremely important. This kind of
Radio Frequency CMOS Chem-bio Viscosity Sensors based on Dielectric Spectroscopy
147

sensor architecture is suitable for future lab on chip
applications like sputum characterization based on
viscosity variation of the sample.
ACKNOWLEDGEMENTS
The authors would like to thank BMBF, Germany for
funding the project under the grant no: 13U13862.
The authors would also like to thank the technology
department of IHP for fabrication of the chip.
REFERENCES
Agoston, A., Otsch, C., Jakoby, B., 2005. Viscosity sensors
for engine oil condition monitoring-Application and
interpretation of results. Sensors and Actuators A:
Physical. 121 (2), 327-332.
Torres Perez, A., Hadfield, M., 2011. Low-cost oil quality
sensor based on changes in complex permittivity.
Sensors. 11, 10675-10690.
Thalhammer, R., Braun, S., Devicic-Kuhar, B., Groschl,
M., Trampler, F., Benes, E., Nowotny, H., Kostal, M.
1998. Viscosity sensor utilizing a piezoelectric
thickness shear sandwich resonator. IEEE Transactions
on Ultrasonics, Ferroelectrics and Frequency Control.
45 (5), 1331-1340.
Shih, W., Li, X., Gu, H., Shih, W-H., Aksay, I. 2001.
Simultaneous liquid viscosity and density
determination with piezoelectric unimorph cantilevers.
Journal of Applied Physics. 89(2), 1497-1505.
Brouwer, M., Gupta, L., Sadegi, F., Peroulis, D., Adams, D.
2011. High temperature dynamic viscosity sensor for
engine oil applications. Sensors and Actuator A:
Physical. 173, 102-107.
Boss, C., Meurville, E., Sallese, J.M., Ryser, P. 2011. A
viscosity-dependent affinity sensor for continuous
monitoring of glucose in biological fluids. Biosensors
and Bioelectronics, 30 (1), 223-228.
Zhao, Y., Li, S., Davidson, A., Yang, B., Wang, Q., Lin, Q.
2007. A MEMS viscometric sensor for continuous
glucose monitoring. Journal of Micromechanics and
Microengineering. 17, 2528-2537.
Cakmak, O., Ermek, E., Kilinc, N., Baris, I., Kavakli, I.J.,
Yaralioglu, G.G., Urey, H. 2014. Microcantilever based
LOC system for coagulation measurements. In
Proceedings, 18
th
International Conference on
Miniaturized systems for chemistry and Life Sciences,
Texas, USA.
Guha, S, Wolf, A., Lisker, M., Trusch, A., Meliani, C.,
Wenger, Ch. 2015. 12 GHz CMOS MEMS lab-on-chip
system for detection of concentration of suspended
particles in bio-suspensions. In Proceedings,
Biodevices, Lisbon, Portugal.
Guha, S., Warsinke, A., Tientcheu, Ch.M., Schamlz, K.,
Meliani, C., Wenger, Ch. 2015. Label free sensing of
creatinine using 6 GHz CMOS near-field dielectric
immunosensor. Analyst 140, 3019-3027.
Jamal, F.I., Guha, S., Eissa, M.H., Borngraeber, J., Meliani,
C., Kissinger, D., Wessel, J. 2016. Comparison of
microstrip stub resonators for dielectric sensing in low
power K-Band VCO. In Proceedings IEEE Topical
Conference on Biomedical Wireless Technologies,
Networks and Sensing, Texas, USA.
Wang, H., Sideris, C., Hajimiri, A. 2010. A frequency shift
based CMOS magnetic biosensor with spatially
uniform sensor transducer gain., IEEE; Custom
Integrated Circuit Conference, USA.
Lopez-Vidriero, M., Charman, J., Keal, E., De Silva, D.,
and L Reid, L. 1973. Sputum viscosity: correlation with
chemical and clinical features in chronic bronchitis.
Thorax, 28, 401- 408.
BIODEVICES 2017 - 10th International Conference on Biomedical Electronics and Devices
148
