
Complementary Domain Prioritization: A Method to Improve
Biologically Relevant Detection in Multi-Omic Data Sets
Benjamin A. Neely
1
and Paul E. Anderson
2
1
Marine Biochemical Sciences, National Institute of Standards and Technology, Charleston, SC 29412, U.S.A.
2
Department of Computer Science, College of Charleston, Charleston, SC 29424, U.S.A.
Keywords:
Genomics, Trancriptomics, Proteomics, Proteogenomics, Proteotranscriptomics.
Abstract:
As the speed and quality of different analytical platforms increase, it is more common to collect data across
multiple biological domains in parallel (i.e., genomics, transcriptomics, proteomics, and metabolomics). There
is a growing interest in algorithms and tools that leverage heterogeneous data streams in a meaningful way.
Since these domains are typically non-linearly related, we evaluated whether results from one domain could
be used to prioritize another domain to increase the power of detection, maintain type 1 error, and highlight
biologically relevant changes in the secondary domain. To perform this feature prioritization, we developed
a methodology called Complementary Domain Prioritization that utilizes the underpinning biology to relate
complementary domains. Herein, we evaluate how proteomic data can guide transcriptomic differential ex-
pression analysis by analyzing two published colorectal cancer proteotranscriptomic data sets. The proposed
strategy improved detection of cancer-related genes compared to standard permutation invariant filtering ap-
proaches and did not increase type I error. Moreover, this approach detected differentially expressed genes that
would not have been detected using filtering alone while also highlighted pathways that might have otherwise
been overlooked. These results demonstrate how this strategy can effectively prioritize transcriptomic data
and drive new hypotheses, though subsequent validation studies are still required.
1 INTRODUCTION
Individually, the fields of genomics, transcriptomics,
and proteomics continue to receive significant re-
search attention as their utility as novel discovery
platforms increases (Larance and Lamond, 2015;
de Klerk and a.C. t Hoen, 2015); however, there is
growing interest in algorithms and tools that leverage
these heterogeneous data streams (Boja et al., 2014).
This is for two main reasons: (i) it is becoming rea-
sonable both from an experimental and cost perspec-
tive to run two or more analytical methods simultane-
ously (e.g., proteomics and transcriptomics), and (ii)
it is believed that integrating data sources will give
rise to a deeper understanding of the system being
interrogated. Thus using multidomain data in a non-
trivial manner supports improved systems biology ap-
proaches to high-throughout biological analysis.
The most straightforward approach to harmoniz-
ing heterogeneous data streams is to combine p-
values (Alves and Yu, 2014) or simply to identify
statistical agreement following parallel analyses. For
example, Zhang et al. utilized proteomic analysis to
complement a seminal genomic/transcriptomic anal-
ysis of colorectal cancer (Cancer and Atlas, 2012).
By analyzing the same samples, the analyses could
be directly compared to identify shared changes at
the gene, transcript and protein level such that hy-
potheses from the genomic study were confirmed at
the protein level. In other words, identified differen-
tially abundant proteins increased the confidence of
differentially expressed genes. In addition to differ-
ential analyses of multiple domains, topological net-
work approaches and gene set enrichment analysis
can be used to predict activated/inhibited transcrip-
tion factors. Agreement between this type of anal-
ysis of transcriptomic and proteomic data has been
used in studies of renal cell carcinoma and psoriasis to
identify disease-relevant transcription targets(Neely
et al., 2016; Piruzian et al., 2010). These standard
approaches make comparisons in parallel, as opposed
to directly incorporating the data sets into a unified
computational analysis. It has yet to be demonstrated
how to capitalize fully on the relationship between ge-
nomic/transcriptomic and proteomic data sets.
Another approach to analyzing mutlidomain data
68
Neely B. and Anderson P.
Complementary Domain Prioritization: A Method to Improve Biologically Relevant Detection in Multi-Omic Data Sets.
DOI: 10.5220/0006151500680080
In Proceedings of the 10th International Joint Conference on Biomedical Engineering Systems and Technologies (BIOSTEC 2017), pages 68-80
ISBN: 978-989-758-214-1
Copyright
c
2017 by SCITEPRESS – Science and Technology Publications, Lda. All rights reserved

sets is to combine information from features in mul-
tiple biological domains into a singular analytical
space. Numerous tools that combine different data
modalities are being developed (see (Kumar et al.,
2016; Haider and Pal, 2013; Kuo et al., 2013) for ex-
tensive reviews). For example, tools such as 3Omics
offer a web-based one-click tool to combine data
from different domains by constructing correlation
networks and co-expression profiles to highlight tran-
script/protein/metabolites with strong agreement be-
tween the domains (Kuo et al., 2013). There is also
an effort to develop techniques that integrate net-
works between domains, such as metabolomic and
proteomic data (Pirhaji et al., 2016), to identify re-
lationships that are driving biological changes. It is
evident that merging data from different domains into
a shared analytical approach is a powerful approach.
A third approach is to use a unified computational
method that relies on data from complementary do-
mains to prioritize traditional methods of differential
expression to highlight biologically relevant changes.
Prioritization can be used to reduce the search space
of an analytical domain by using data from a sec-
ondary domain. Such prioritization methods are be-
coming more important as the number of variables
(e.g., transcripts, proteins, metabolites) that are stud-
ied using next-generation technology may range from
a few hundreds to tens of thousands. Transcrip-
tomics can include gene arrays which measure tens
of thousands of probes or RNA-seq analysis which
can sequence and measure tens of thousands of tran-
scripts, while proteomics (specifically mass spec-
trometry based shotgun proteomics) can provide a
proteome sampling of around ten thousand proteins
(Geiger et al., 2012). These high-dimensional search
spaces, along with relatively small sample sizes, re-
duce the power to detect potentially biologically rel-
evant changes while controlling the FDR. One of the
most common forms of analysis in high-dimensional
data such as these, is variable-by-variable statistical
testing. This is used to test the null hypothesis that be-
havior for a given variable does not change between
conditions. In the case of gene microarrays, this can
be accomplished on a gene-by-gene level using a t-
test, and extended to more complex experimental de-
signs using ANOVA. For next-generation sequenc-
ing projects where read counts are available, p-values
may be computed using read count statistics (Robin-
son and Smyth, 2007). For high-dimensional data this
results in a large number of hypotheses that need to
be evaluated, and thus, many genes may be detected
as significant even though the null hypothesis is true
(i.e., there is really no change). This is known as type
I error and is controlled with various false positive
measures, including family-wise error rate (FWER)
or false discovery rate (FDR), that control for type I
error or the extent to which false positives occur but
also reduces the power to detect true positives. A re-
view of these methods can be found in (Dudoit et al.,
2003).
One general methodology to reduce the transcrip-
tomic search space is gene prioritization, which uti-
lizes a priori phenotype relationships in published
databases (reviewed extensively here (B
¨
ornigen et al.,
2012)). Since this method requires manually cu-
rated and compiled information to prioritize exper-
imental data, it can overestimate relationships once
the data being queried becomes part of the a priori
relationship, and it is limited to the search space of
the database. Another method is to apply a filtering
scheme prior to statistical testing. A comparison of
these methods can be found in Bourgon et al. In these
filtering schemes, a set of variables (e.g., genes) are
identified that generate uninformative signal. Then
the formal statistical test is applied to the remaining
features. The goal of this approach is to select a fil-
ter that makes multiple test correction less severe and
thus enhance true positive detection.
In order to overcome a priori biases, several au-
thors have recommended nonspecific or unsupervised
filters that do not make use of sample class labels, and
thus, have little influence on the formal statistical test-
ing (Talloen et al., 2007). One criticism of supervised
filtering techniques is that they are in fact a statisti-
cal test and may result in optimistic adjusted p-values
and a true false positive rate that is larger than re-
ported. The goal therefore of any filtering technique is
to enrich true differential expression/abundance, if not
then these techniques have the potential to generate
overly optimistic conclusions. Common permutation-
invariant filters include variance or abundance thresh-
olds since it is assumed that this removes genes that
are unlikely to be detected as significantly different
and emphasize biologically relevant signal. While
these filters are a common first step used by tools
commonly used to analyze transcriptomic data (e.g.,
limma, DESeq2, EdgeR, etc.), they do not incorpo-
rate data from multiple domains.
We propose a general method for feature prioriti-
zation and filtering that combines data from different
biological domains and is built upon the biological re-
lationship between independent data domains: Com-
plementary Domain Prioritization. Unlike methods
that attempt to merge domains into a singular analyt-
ical space, this method prioritizes features in the tar-
get domain by integrating empirical data from com-
plementary domains through evidence-based relation-
ships in curated databases. Herein, we demonstrate
Complementary Domain Prioritization: A Method to Improve Biologically Relevant Detection in Multi-Omic Data Sets
69
how this general methodology can use proteomic data
to guide transcriptomic differential expression analy-
sis. The method utilizes heterogeneous data streams
by leveraging available pathway data in Kyoto Ency-
clopedia of Genes and Genomes [KEGG; (Kanehisa
et al., 2014)], WikiPathways (Kelder et al., 2009),
and MSigDB:Transcription Factor Target databases
(Matys et al., 2006) as a bridge between proteomic
and transcriptomic data to increase the power to de-
tect biologically relevant differential expression pat-
terns in transcriptomic data. We apply this prioriti-
zation strategy to two independent studies with pub-
licly available data. Our results indicate that this ap-
proach to prioritization followed by independent fil-
tering provides an experimentally informed prioriti-
zation strategy leading to an increase in the power to
detect meaningful changes while still controlling type
I error.
2 METHODS
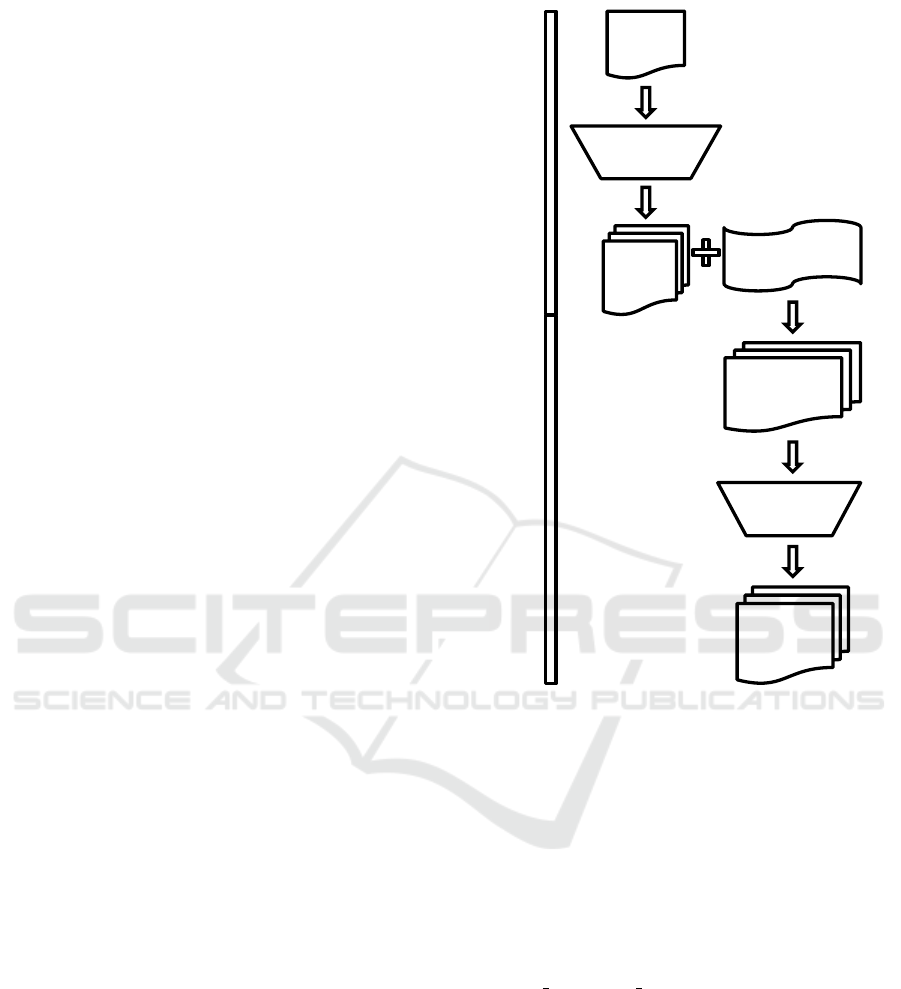
Complementary Domain Prioritization (CDP) is
a two-stage prioritization and filtering approach
that combines data from two biological domains
with the goal of increasing the power of discovery
while still controlling type I error (Figure 1). In
the first stage, enrichment analysis is performed
on one domain (in this example, proteomic data)
using pathway or gene set databases. Gene lists
from pathways or gene sets are then extracted and
provide the input to the second stage, which applies
these gene lists as prioritization criteria to the second
domain (in this case, transcriptomic data). This is
followed by a permutation-invariant gene list filtering
approach. This general methodology, which can be
extended to other domains, is demonstrated herein
by using proteomic data to prioritize transcriptomic
data. An R package has been developed during
the course of this study and is available for general
use by the research community. This repository
contains all of the required scripts and documen-
tation for their use https://github.com/Anderson-
Lab/ComplementaryDomainPrioritization. This
package provides a programmatic method to obtain
the gene lists derived from the protein enrichment
data.
2.1 Gene List Generation
The first stage of CDP is gene list generation, which
in this example is driven by proteomic data anal-
ysis. Quantitative proteomic data was used along
with class labels to detect differentially abundant
Protein
List
Gene
Lists
Prioritized
Gene List
Final
Gene List
Gene List Generation
Prioritization and Filtering
Prioritization
Transcriptomic
Data
Filtering
Figure 1: Complementary Domain Prioritization
flowchart. This figure shows the overall workflow of prior-
itization and filtering.
proteins at a given threshold. This protein list
was uploaded to WebGestalt (WEB-based GEne SeT
AnaLysis Toolkit), a web-based tool that can per-
form pathway and gene set enrichment against dif-
ferent databases for eight different species (Wang
et al., 2013), though Homo sapiens is the focus of
this example. For each enrichment test the refer-
ence set was specified as protein-coding genes (e.g.,
hsapiens entrezgene protein-coding) when using pro-
teomic data. The statistical parameters used for the
hypergeometric statistical method were BH p-value
adjustment, requiring a significance level < 0.05 and
minimum of two proteins per pathway/gene set. For
clarification, transcription factor (TF) target analysis
enrichment is gene set enrichment analysis against the
transcription factor targets in the C3:motif gene set
of MSigDB (Matys et al., 2006). Following KEGG,
WikiPathways (WikiP) or TF enrichment analysis, the
resulting pathways and gene sets were downloaded
from WebGestalt as .tsv files.
BIOINFORMATICS 2017 - 8th International Conference on Bioinformatics Models, Methods and Algorithms
70

2.2 Gene Prioritization and Filtering
The second stage of CDP first uses the enriched path-
ways or gene sets to prioritize the genes in the second
domain belonging to each pathway or gene set of in-
terest. Pathway information for KEGG was extracted
using the KEGGREST R package. Pathway informa-
tion for WikiPathways was retrieved using the official
web service provided by WikiPathways. Gene set in-
formation from the transcription factor database (via
MSigDB) was downloaded and queried locally. The
prioritized gene list G is defined as:
P = {P
i
}, (1)
genes(P
i
) = {g
j
}, (2)
G =
[
P
i
∈P
genes(P
i
), (3)
where P is the set of all pathways or gene sets identi-
fied in stage 1, genes(P
i
) is the list of genes in path-
way P
i
, and G is the resulting prioritized gene list.
CDP prioritizes genes in the transcriptome in-
volved in pathways or gene sets showing enrichment
at the protein level and removing genes not present
in these pathways or gene sets. Next, permutation-
invariant filtering is applied to further enhance the
power of detection by applying variance or mean
abundance filtering. Variance filtering is defined as
ranking the genes according to variance across sam-
ples (ignoring class labels). This has been shown to
be similar to fold-change filtering, but in an unsuper-
vised manner (see Bourgon et al. for a detailed dis-
cussion). Mean abundance filtering ranks the genes
by the mean abundance of each gene. In the method-
ology described herein, these permutation-invariant
filtering methods are applied after prioritization as
follows:
Var(G
i
) =
1
n − 1
n
∑
j=1
(E
i j
−
¯
E
i
)
2
(4)
Mean(G
i
) =
1
n
n
∑
j=1
E
i j
(5)
R = order(G) (6)
F =
[
i=1...θ
R
i
(7)
(8)
where E
i j
is the expression estimate of gene i and
sample j, R is an ordered list of genes that have been
sorted by their variance (Var(G
i
)) or mean abundance
(Mean(G
i
)), θ is the desired number of genes, and F
is the final set of genes which have been prioritized
and filtered.
2.3 Experimental Data Sets
Two data sets were selected for evaluation, referred to
herein as TCGA CRCa and Marra. The first data set,
TCGA CRCa, is comprised of transcriptomic and pro-
teomic analyses of 87 tumor samples from individuals
with colorectal carcinoma, for which transcript levels
were measured by RNA sequencing yielding FPKM
measurements (Cancer and Atlas, 2012), and protein
levels were measured by label-free shotgun proteomic
analysis yielding spectral counts that were quantiled
and then log-transformed (Zhang et al., 2014). Tran-
scriptomic data for the TCGA CRCa data set were
retrieved from supplemental tables of the published
paper (Cancer and Atlas, 2012). Using the key pro-
vided by both the authors and the key in the follow-
up proteomics paper (Zhang et al., 2014), we deter-
mined the 87 samples which overlapped between the
two studies. The transcriptomic data supplied in sup-
plemental were utilized directly (as opposed to re-
processing raw data), which was given as FPKM val-
ues for 20,531 genes. These gene symbols were first
confirmed as being current accepted HGNC symbols,
followed by converting them to Entrez gene IDs. Of
the original 20,531 genes, 18,995 had Entrez gene ID
annotation and were used for analysis. A side note
is that we understand that more robust statistics can
be performed using direct count data with tools such
as EdgeR or baySeq, but for our purposes comparing
FPKM values with a t-test was acceptable.
Proteomic data for the TCGA CRCa data set were
retrieved from supplemental tables of the published
paper (Zhang et al., 2014). The supplemental data
was used directly and consisted of already processed
data that was spectral count data for 7,211 proteins,
which had been quantiled then log transformed. Of
these 7,211 proteins (with gene symbol identifiers),
7,147 had Entrez gene ID annotation and were used
for analysis. To generate a p-value for these proteins
to be used in CDP, a moderated t-test was applied
to the data using the limma package (Smyth, 2004)
followed by a Benjamini-Hochberg procedure to cor-
rect for multiple hypothesis testing. For this analy-
sis, the samples are dichotomized based on whether
lymphatic invasion was present in an attempt to clas-
sify tumor aggressiveness similar to the original anal-
ysis (Cancer and Atlas, 2012). The original paper uti-
lized a model consisting of tumour stage, lymph node
status, distant metastasis and vascular invasion at the
time of surgery. Of the 87 samples analyzed, eight did
not have a value specified, 44 had lymphatic invasion
and 35 did not.
The second data set, Marra, is comprised of tran-
scriptomic and proteomic analyses of paired adenoma
Complementary Domain Prioritization: A Method to Improve Biologically Relevant Detection in Multi-Omic Data Sets
71

and normal mucosa samples from individuals with
pre-cancerous colorectal tumors or lesions. Transcript
levels of 35 adenomas with matched normal mu-
cosa are measured using Affymetrix GeneChip Hu-
man Exon ST Arrays (Cattaneo et al., 2011). Tran-
scriptomic data for the Marra data set (Cattaneo et al.,
2011) were retrieved from the NCBI Gene Expres-
sion Omnibus database identifier GSE21962, which
contained raw files from Affymetrix GeneChip Hu-
man Exon ST Arrays (HuEx-1 0-st-v2). Array data
that was specific to pre-cancerous tumors and lesions
was utilized, without duplicate samples resulting in
35 adenomas with matched normal mucosa. Files
were processed using the oligo package (Carvalho
and Irizarry, 2010) and pd.huex.1.0.st.v2 library. Ro-
bust multichip average (RMA) normalization was ap-
plied at the transcript level (i.e., core gene ST probe-
set) generating expression values on a log-scale. This
resulted in data for 20,011 probes, which contained
16,132 genes with Entrez gene ID annotation and
were used for analysis.
Proteomic analysis of 30 similar but not iden-
tically matched samples was performed later using
isobaric labeling (iTRAQ) to quantify protein abun-
dance (Uzozie et al., 2014). Even though the Marra
data set is comprised of data for similar but not iden-
tical samples, this is still relevant since often re-
searchers use publicly available transcriptomic data
to augment original analysis, such as Shimwell et
al. (Shimwell et al., 2013). Proteomic data for the
Marra data set (Uzozie et al., 2014) were retrieved
from the published paper. This supplemental data was
quantified at the peptide level using 8-plex iTRAQ
across 10 experiments, with iTRAQ labels 113 and
114 being a pooled reference sample and the remain-
ing six labels being three adenoma/normal mucosa
pairs from the same patient per experiment (i.e., 30
pairs total). These data were processed using Infer-
noRDN(Polpitiya et al., 2008) similar to the steps de-
scribed by the authors(Uzozie et al., 2014). Briefly,
for each experimental data set only unique peptides
were utilized and label intensity measurements were
first log2 transformed followed by mean centering
(central tendency adjustment). These mean centered
log transformed peptide level data were rolled up to
the protein level using reference peptide based scal-
ing (default parameters except one-hit wonders were
allowed). This resulted in protein level quantification
that was mean normalized log2 transformed by ex-
periment. The distribution of 113 and 114 labels was
found to be nearly identical between the 10 experi-
ments, and so inter-experimental normalization was
not required. Therefore we utilized the normalized
log-intensity values for each adenoma/normal mucosa
pair to generate a log-fold change value. Next we
found proteins that were measured in all experiments,
and used these 820 proteins for analysis. Of these
820 proteins with UniProtKB Identifiers, 768 had En-
trez gene IDs, which were used to perform a moder-
ated t-test with the limma package (Smyth, 2004) fol-
lowed by a Benjamini-Hochberg procedure to correct
for multiple hypothesis testing.
Since we use pathway and gene set databases to
create prioritization filters, it is important to report rel-
evant percent overlap related to the data sets and these
databases. The TCGA CRCa data set is comprised of
7,147 unique proteins and 18,787 unique transcripts
with Entrez gene IDs. The KEGG database contains
3,185 (45%) and 6,307 (34%) of these proteins and
transcripts, respectively. The WikiP database con-
tains 3,719 (52%) and 7,215 (38%) of these proteins
and transcripts, respectively. The TF database con-
tains 5,208 (73%) and 12,035 (64%) of these proteins
and transcripts, respectively. The Marra data set is
comprised of 768 unique proteins and 15,807 unique
transcripts with Entrez gene IDs. The KEGG database
contains 474 (62%) and 6,073 (38%) of these proteins
and transcripts, respectively. The WikiP database
contains 533 (69%) and 6,841 (43%) of these proteins
and transcripts, respectively. The TF database con-
tains 628 (82%) and 11,556 (73%) of these proteins
and transcripts, respectively. The relative overlap is
higher for protein than transcript data sets against the
pathway databases (KEGG and WikiP) since path-
ways are comprised of proteins. Also for reference,
there are 27,228 genes with Entrez gene IDs in the
Homo sapiens genome, and 21,061 of these are pro-
tein coding (Ensembl 81, H. sapiens GRCh38.p3).
3 RESULTS
3.1 Prioritization and Novel Discovery
The goal of Complementary Domain Prioritization
(CDP) is to guide differential analysis in one do-
main using differential analysis of a parallel domain.
The proposed method was evaluated using two pub-
lished proteotranscriptomic data sets, TCGA CRCa
and Marra, with diverse gene expression and pro-
tein abundance patterns. The TCGA CRCa data set
presents an example of a difficult differential expres-
sion discovery task when studying differences in tu-
mor aggressiveness using lymphatic invasion as a
phenotype. The original TCGA analysis identified
40 genes related to tumor aggressiveness, which was
determined by more factors than just lymphatic inva-
sion (Cancer and Atlas, 2012). In the current anal-
BIOINFORMATICS 2017 - 8th International Conference on Bioinformatics Models, Methods and Algorithms
72

ysis, using lymphatic invasion as a phenotype there
were minor changes with respect to differential ex-
pression at the transcript level with 49 differentially
expressed genes (two-sided equal t-test, Benjamini-
Hochberg corrected p< 0.2; BH < 0.2) and 26 differ-
entially abundant proteins (BH < 0.2). Of these 49
differentially expressed genes, two were identified in
the original analysis. In contrast, using CDP detected
on average 10 of the 40 genes identified in the orig-
inal TCGA study by filtering alone or prioritization
then filtering (data not shown). This provided a mod-
est improvement in analysis to detect genes related to
tumor aggressiveness.
In order to demonstrate whether CDP was priori-
tizing otherwise disregarded genes that are interesting
candidates correlated to cancer phenotypes, we report
the number of rejected null hypotheses (e.g., number
of candidate discoveries) as a function of the FDR for
only cancer-related genes. To accomplish this, a list
of 1663 cancer-related genes, retrieved via the Hu-
man Protein Atlas (Uhl
´
en et al., 2015), were tracked
and evaluated for each data set (Figure 2 and Supple-
mentary Figure S1 online). In the TCGA CRCa data
set prioritization followed by filtering consistently de-
tected approximately two to three-fold more cancer-
related transcripts with BH < 0.3 than using filtering
only, and higher θ resulted in better detection (Fig-
ure 2). Also, cancer-related transcripts were detected
at BH < 0.1 only when using WikiPathways (WikiP)
and transcription factor (TF) enrichment based prior-
itization. The effect of CDP on the Marra data set,
which had a strong differential expression profile with
40% of genes differentially expressed without CDP,
was less obvious (Figure 3). For the Marra data set,
filter-only performed as well as CDP in some cases
with CDP outperforming filter-only when used with
WikiP (Figure 3b and Figure 3e).
In addition to detecting previously reported genes
of interest, successful prioritization should also result
in detecting genes that would otherwise not be de-
tected. The Marra data set has 6,300 differentially
expressed genes (BH < 0.5) and 437 differentially
abundant proteins (BH < 0.5) and provides an in-
teresting example of the effect of CDP on prioritiz-
ing gene detection. Using CDP drastically decreased
the number of gene candidates by prioritizing 6 to
43% of the original 15,807 genes prior to permuta-
tion invariant filtering. Additional filtering targeted
3 to 22% of the original genes (488, 813 and 3,427
using WikiP, KEGG, and TF, respectively). Prioriti-
zation followed by variance filtering detected 6 to 164
genes that would not have been detected with variance
filtering alone, while prioritization followed by mean
abundance filtering detected less than 10 genes that
would not have been detected with mean abundance
filtering alone. Although these changes in detection
may seem minor, they lead to large differences at the
pathway level, which is investigated later in this pa-
per.
3.2 Controlling False Positive Rate
Using filters to improve detection power can lead to a
loss of false positive control depending on the choice
of filter. Permutation-invariant filters, such as vari-
ance and abundance, have been shown to be appro-
priate filters (Bourgon et al., 2010). An example
of a permutation-variant filter is a fold-change fil-
ter, where the fold-change between two classes is de-
pendent on the labels of the samples, and thus, the
ordering of the samples is important in the calcula-
tion. In contrast, a variance filter, abundance filter,
or complementary domain based prioritization is in-
dependent on the ordering of the samples. To evalu-
ate false positive control, the conditional and uncon-
ditional marginal distributions of test statistics after
using permutation-invariant filtering were compared.
It has been shown that the conditional marginal dis-
tributions of test statistics after using permutation-
invariant filtering are the same as the unconditional
distributions before filtering, where the conditional
distributions are the same as the distributions after ap-
plying the filter (Bourgon et al., 2010). This behav-
ior is a necessary criteria for multiple testing adjust-
ments that attempt to control experiment-wide type
I error rate. We show the distribution of t-statistics
for the conditioned and unconditioned TCGA CRCa
data set in order to empirically demonstrate the effect
of these filters (Figure 4). The findings on the Marra
data set were also consistent with these results (data
not shown). We deliberately eschewed fold-change
from other comparisons since this requires incorpo-
rating class labels, and thus, will affect type I error.
A variance based filter is similar in practice to a fold-
change filter, despite being independent of class lev-
els. This is discussed in detail by Bourgon et al., but
briefly, for small sample sizes, the bound is essentially
a constant multiple of the cut-off on the variance.
3.3 Effect on Pathway Analysis
To more clearly define the similarities in the priori-
tization strategies, we compared the overlap of pri-
oritized and differentially expressed genes using dif-
ferent databases for prioritization. Since there are
only 26 differentially abundant proteins in the TCGA
CRCa data set (at BH < 0.2), we did not pursue us-
ing this data set as a proof of principle. Differentially
Complementary Domain Prioritization: A Method to Improve Biologically Relevant Detection in Multi-Omic Data Sets
73
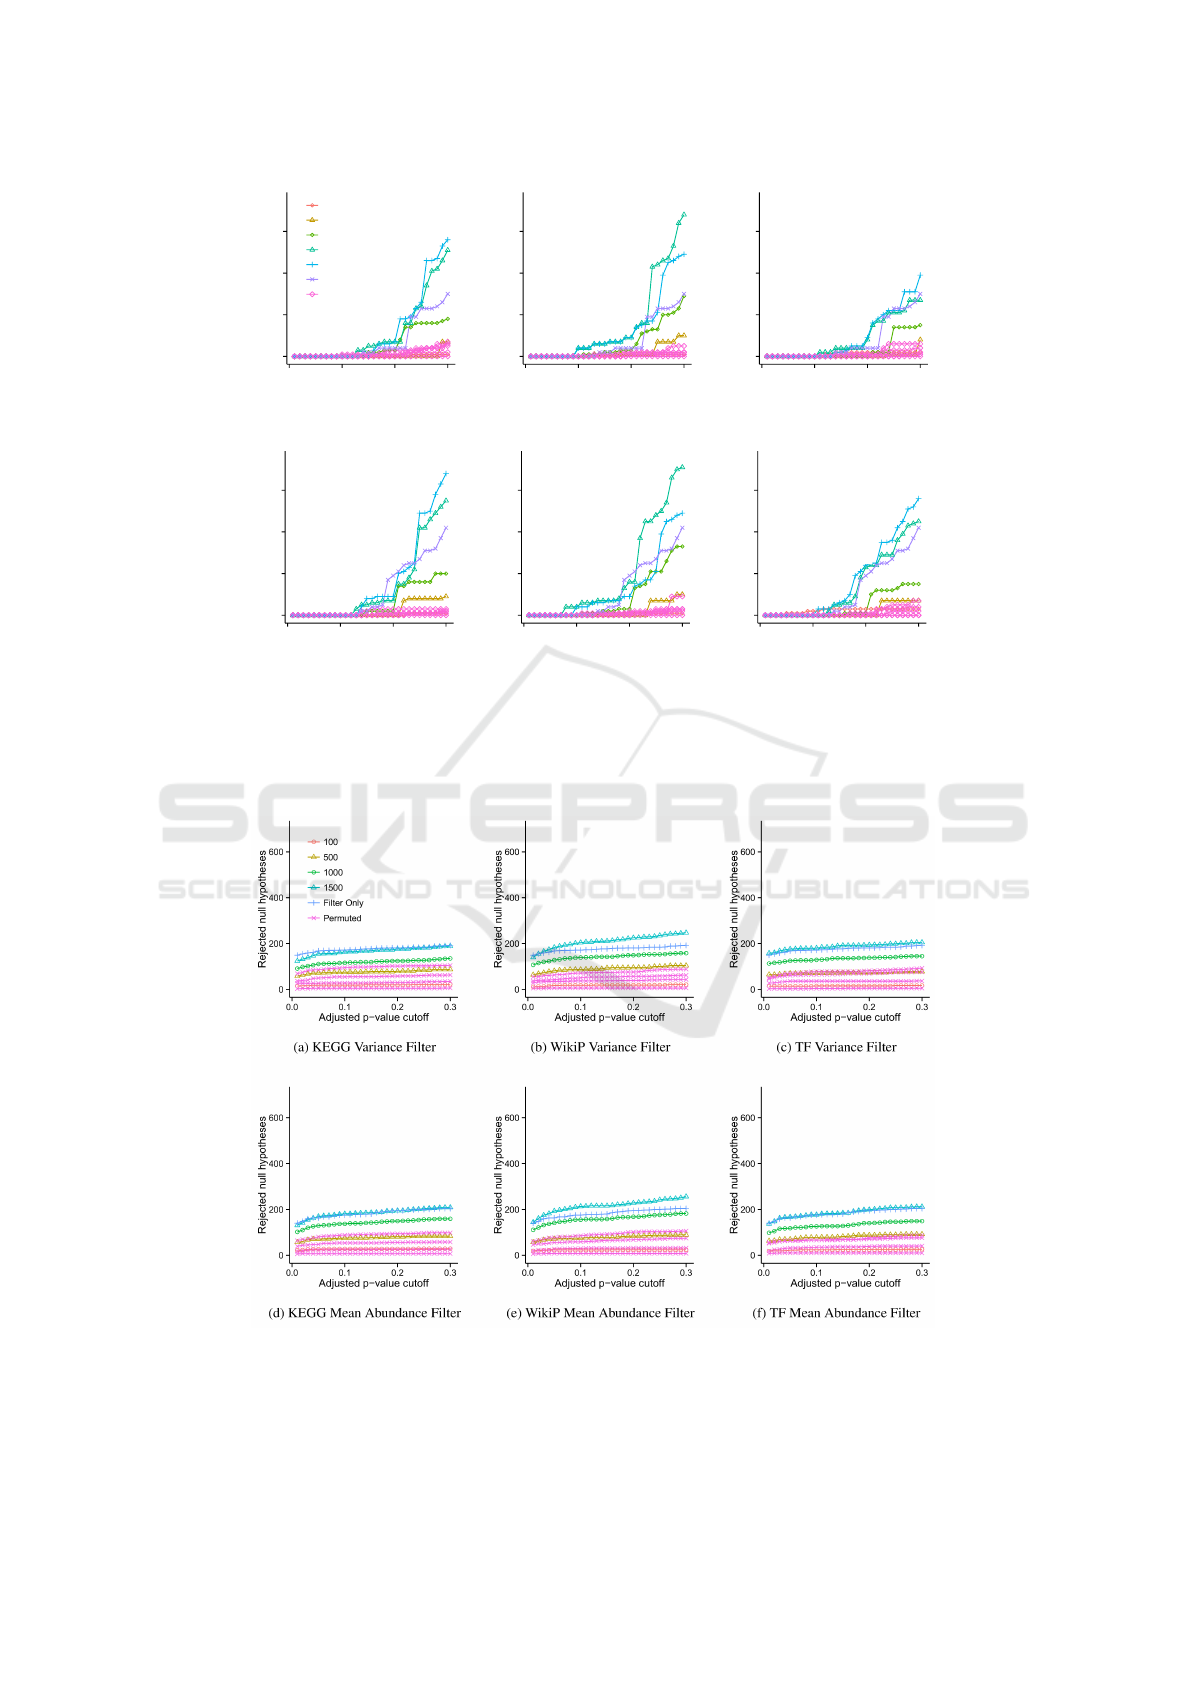
0
20
40
60
0.0 0.1 0.2 0.3
Adjusted p−value cutoff
Rejected null hypotheses
100
500
1000
2000
2500
Filter Only
Permuted
(a) KEGG Variance Filter
0
20
40
60
0.0 0.1 0.2 0.3
Adjusted p−value cutoff
Rejected null hypotheses
(b) WikiP Variance Filter
0
20
40
60
0.0 0.1 0.2 0.3
Adjusted p−value cutoff
Rejected null hypotheses
(c) TF Variance Filter
0
20
40
60
0.0 0.1 0.2 0.3
Adjusted p−value cutoff
Rejected null hypotheses
(d) KEGG Mean Abundance Filter
0
20
40
60
0.0 0.1 0.2 0.3
Adjusted p−value cutoff
Rejected null hypotheses
(e) WikiP Mean Abundance Filter
0
20
40
60
0.0 0.1 0.2 0.3
Adjusted p−value cutoff
Rejected null hypotheses
(f) TF Mean Abundance Filter
Fig. 2: Power analysis and prioritization comparison on the TCGA CRCa data set. Figures a - f show the number of rejected null hypotheses
as a function of the p-value cutoff using three different filters (KEGG, WikiP and TF) and two different permutation invariant prioritization
strategies (variance and mean abundance). All methods were evaluated using thresholds θ=100, 500, 1000, 2000, and 2500. For presentation
clarity, only a single theta is shown for methods without prioritization (overall mean and overall variance). For these methods, the threshold
resulting in the maximum number of significant genes for a FDR of 0.2 was chosen.
3
Figure 2: Power analysis and prioritization comparison on the TCGA CRCa data set. Figures a - f show the number of
rejected null hypotheses as a function of the BH adjusted p-value cutoff using three different prioritization strategies (KEGG,
WikiP and TF) and two different permutation invariant filtering strategies (variance and mean abundance). All methods were
evaluated using thresholds θ=100, 500, 1000, 2000, and 2500, where θ is the desired number of genes. For presentation
clarity, only a single θ is shown for methods using only a permutation invariant strategy (filter only, no prioritization), which
was the threshold resulting in the maximum number of significant genes for a FDR of 0.2, and is labeled as Filter Only.
Figure 3: Power analysis and prioritization comparison on the Marra data set. Figures a - f show the number of rejected
null hypotheses as a function of the BH adjusted p-value cutoff using three different prioritization strategies (KEGG, WikiP
and TF) and two different permutation invariant filtering strategies (variance and mean abundance). All methods were eval-
uated using thresholds θ=100, 500, 1000, 2000, and 2500, where θ is the desired number of genes. For presentation clarity,
only a single θ is shown for methods using only a permutation invariant strategy (filter only, no prioritization), which was the
threshold resulting in the maximum number of significant genes for a FDR of 0.2, and is labeled as Filter Only.
BIOINFORMATICS 2017 - 8th International Conference on Bioinformatics Models, Methods and Algorithms
74
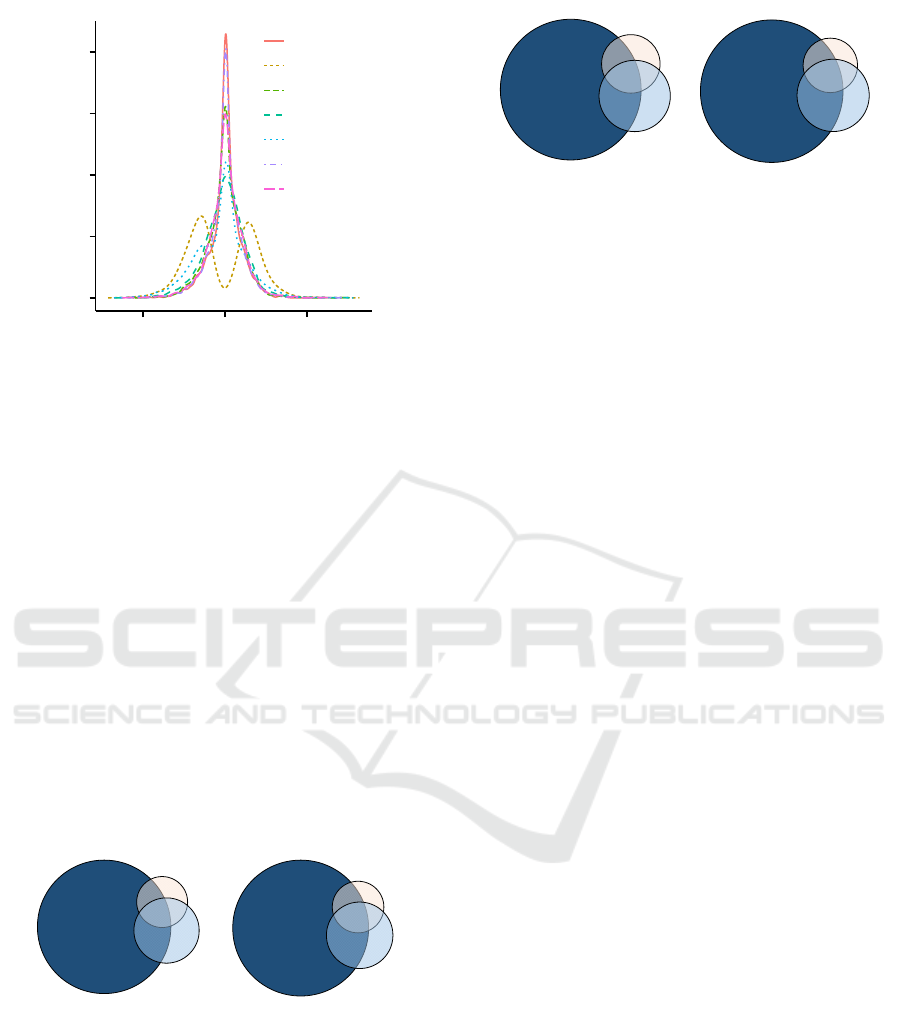
0.00
0.05
0.10
0.15
0.20
−20 0 20
t−statistic
Frequency
All
Fold-change
KEGG
M
ean
Variance
TF
WikiP
Figure 4: Distribution of t-statistic values before and af-
ter conditioning. The proposed prioritization and filtering
approaches are permutation invariant, in contrast to a fold-
change filter that is not permutation invariant.
abundant proteins in the Marra data set (437 proteins
at BH < 0.05) were used to perform pathway en-
richment or gene set analysis against KEGG, WikiP
or TF databases (Figure 5, and Figure 6). Regard-
less of the permutation-invariant filter used following
prioritization, the trends were the same between the
databases: TF based CDP resulted in the highest num-
ber of genes, of which 80% were unique to TF based
prioritization, while KEGG and WikiP prioritized far
fewer genes. Regardless of the prioritization approach
used, approximately half of the resulting genes were
detected as differentially expressed, which was the
same as in the untreated data set. Lastly, the KEGG
and WikiP approaches were more similar than TF,
likely since these are pathway databases as opposed
to gene set databases.
WikiP
(n = 488)
KEGG
(n = 813)
TF
(n = 3427)
108
114
269
297
133
133
2864
WikiP
(n = 260)
KEGG
(n = 420)
TF
(n = 1641)
58
58
125
171
66
78
1326
AB
Figure 5: Comparison of the gene overlap following pri-
oritization treatments after variance filtering. Different
prioritization approaches were used (KEGG, WikiP or TF)
followed by an independent filter (50% variance) for the
Marra data set. (A) Overlap of prioritized genes follow-
ing prioritization with different databases. (B) Overlap of
differentially expressed genes (BH adjusted p < 0.05) fol-
lowing prioritization with different databases.
The candidate discoveries identified in a differen-
tial expression studies are often the starting point for
pathway and gene set enrichment analyses; therefore,
WikiP
(n = 488)
KEGG
(n = 813)
TF
(n = 3427)
82
93
220
332
168
145
2782
WikiP
(n = 274)
KEGG
(n = 482)
TF
(n = 1859)
48
52
134
196
100
74
1489
A B
Figure 6: Comparison of the gene overlap following
prioritization treatments after mean abundance filter-
ing. Different prioritization approaches were used (KEGG,
WikiP or TF) followed by an independent filter (50%
mean abundance) for the Marra data set. (A) Overlap
of prioritized genes following prioritization with different
databases. (B) Overlap of differentially expressed genes
(BH adjusted p < 0.05) following prioritization with dif-
ferent databases.
it is critical to explore how the proposed prioritiza-
tion strategy affects downstream analysis. For this
we compared how filtering alone and prioritization
followed by filtering affected results when analyzing
the Marra data set (Table 1) and report the identified
pathways. We used the differentially expressed genes
(BH < 0.05) from these prioritized and/or filtered data
to perform pathway enrichment analysis against the
KEGG database. The unfiltered data resulted in 206
pathways, variance filtering alone identified 189 path-
ways and prioritizing with KEGG, WikiP and TF fol-
lowed by variance filtering identified 151, 87 and 154
pathways, respectively. Since often the top enriched
pathways are used for followup experimental studies,
the top 10 enriched pathways were compared (Table
1). Each approach yielded slightly different top 10
pathways and different rankings of specific pathways,
with only ’Metabolic pathways’ being shared across
approaches. Interestingly, the ’Complement and co-
agulation cascades’ pathway was ranked highest after
protein prioritization (using WikiP) with 26 genes be-
ing differentially expressed, while it was fourth high-
est using KEGG (albeit with 29 genes being differen-
tially expressed). For comparison, this pathway was
ranked 17th using a variance filter alone (with 28 dif-
ferentially expressed genes). Also, the ’Protein pro-
cessing in ER’ pathway was unique to KEGG based
protein prioritization, with 33 genes in this pathway
being differentially expressed. When using a variance
filter alone, this pathway was the 99th highest ranked
pathway with 30 differentially expressed genes, while
in the unfiltered treatment this pathway was ranked
20th with 72 differentially expressed genes (data not
shown). For comparison, ’Protein processing in the
ER’ was ranked 15th with 13 differentially abundant
proteins following pathway enrichment analysis us-
ing the proteomic data. Overall, Using CDP on the
Marra data set changed the ranking of identified path-
Complementary Domain Prioritization: A Method to Improve Biologically Relevant Detection in Multi-Omic Data Sets
75

ways, possibly indicating pathways that are more bi-
ologically relevant than those identified using just the
transcriptomic results.
4 DISCUSSION
As the speed, quality and complexity of analysis
used to quantify the complex biochemical interactions
within biological systems continues to improve, stud-
ies are often confronted with the issue of over-fitting
high-dimensional data with a relatively small sam-
ple set. These data sets can also span multiple bio-
logical domains (genes, transcripts, proteins, metabo-
lites), presenting the opportunity to utilize the data
across domains in a meaningful way. It was the aim
of this study to develop and evaluate a method that
leveraged proteomic data to prioritize transcriptomic
data while avoiding increased type I error. Similar
to methods that use permutation-invariant filters such
as variance or mean abundance to improve power
(Bourgon et al., 2010), our approach improved the
power to detect cancer-related genes while controlling
type I error in two different experimental data sets.
These results demonstrate that prioritization of tran-
scriptomic data using proteomic data provides similar
power improvements as other permutation-invariant
filters, while utilizing the underpinning biological hi-
erarchy to create an empirical prioritization filter.
One issue when applying filters to data is that us-
ing class level differences to filter or prioritize data
can inflate the number of significant variables. This
problem is mitigated during Complementary Domain
Prioritization because the domains are independent
and class level differences across different biologi-
cal domains are largely non-linearly related. Even
though the majority of transcript and protein levels
are positively correlated, the average correlation from
a subset of published data is 0.26 (Gygi et al., 1999;
Foss et al., 2007; Zhang et al., 2014). It is possi-
ble that genes detected as differentially expressed do
not manifest changes at the protein level due to post-
transcriptional and post-translational regulation. This
has been observed when proteomic analysis has been
used in tandem with transcriptomic studies (Zhang
et al., 2014; Gygi et al., 1999; Foss et al., 2007),
where changes observed at the transcript level were
not propagated to the protein level. Alternatively, sig-
nificant protein changes have been observed in the ab-
sence of transcript changes (Zhang et al., 2014; Gygi
et al., 1999), further emphasizing the dynamic nature
of post-transcriptional regulation, which can attenu-
ate protein abundance, as well as the independence
of the different domains. By utilizing protein levels,
which are arguably more informative of phenotypic
changes while also being non-linearly related to tran-
script changes, to prioritize pathways and gene sets in
the transcript domain, Complementary Domain Prior-
itization does not artificially inflate detection of sig-
nificant changes across domains.
During Complementary Domain Prioritization a
filter is created using enrichment analysis against
pathway and gene set databases, thereby incorpo-
rating secondary experimental data with evidence-
based relationships. In other words, CDP is able
to leverage evidence-based relationships (databases)
with secondary domain data (proteomics) to priori-
tize signal at the transcriptomic level. Since Com-
plementary Domain Prioritization relies heavily on
databases and secondary domain data, both of these
offer room for improvement. Databases are inherently
ambiguous association lists that aren’t exhaustive or
completely accurate. This means that the choice of
database can affect downstream results since they rely
on different assumptions and curation. We show that
different prioritization databases affect detection of
differentially expressed genes, with Complementary
Domain Prioritization targeting 6 to 43% of the genes
detected by filtering alone. Also, prioritization us-
ing pathway based databases (KEGG and WikiPath-
ways) generated results that were more similar than
prioritization based on a gene set database (MSigDB).
Moreover, if a database omits a gene in a given path-
way or gene set, then this gene will not be present
following the prioritization procedure. In both data
sets, the pathway based databases include approxi-
mately 40% of transcripts in the transcriptomic data,
whereas the gene set database includes approximately
75% of both proteomic or transcriptomic data. Also,
though the WikiPathways database consistently in-
cluded more proteins and transcripts from the data
sets than KEGG, fewer WikiPathways pathways were
identified by pathway enrichment analysis. This may
explain why although both KEGG and WikiPathways
prioritization strategies identified the ’Complement
and Coagulation Cascades’ pathway in the Marra data
set, though the number of differential expressed genes
was different between the two prioritization strate-
gies. We have shown performance using KEGG,
WikiPathways, and MSigDB (i.e., TF) databases, but
in the future this could be expanded to include other
databases (e.g., Reactome). As more heterogeneous
domain data sets become available, isolating database
specific effects from data set effects will help estab-
lish best practices for Complementary Domain Prior-
itization. In general, with continued development of
more accurate databases, the prioritization quality of
this approach will improve.
BIOINFORMATICS 2017 - 8th International Conference on Bioinformatics Models, Methods and Algorithms
76

Table 1: Comparison of top 10 enriched pathways. Results for the Marra data set are shown using four different strategies:
permutation invariant filter only (50% variance) and prioritization (KEGG, WikiP or TF) followed by filter (50% variance).
After ranking enriched pathways using the BH adjusted p-value, the top 10 are shown in order. Unique pathways are in bold.
Filter Only KEGG + Filter WikiP + Filter TF + Filter
Metabolic pathways Metabolic pathways
Complement and
coagulation cascades
Metabolic pathways
Cell cycle Purine metabolism Metabolic pathways Cell cycle
Cell adhesion
molecules (CAMs)
RNA transport Ribosome Pathways in cancer
Pathways in cancer
Complement and
coagulation cascades
Parkinson’s disease Purine metabolism
Cytokine-cytokine
receptor interaction
Protein processing in
endoplasmic reticulum
Oxidative
phosphorylation
p53 signaling pathway
Purine metabolism
Pyrimidine metabolism
Alzheimer’s disease DNA replication
Chemokine signaling
pathway
Huntington’s disease Huntington’s disease MAPK signaling pathway
p53 signaling pathway Alzheimer’s disease
Starch and sucrose
metabolism
RNA transport
Rheumatoid arthritis Ribosome
Staphylococcus aureus
infection
Cell adhesion
molecules (CAMs)
Regulation of actin
cytoskeleton
Glycolysis /
Gluconeogenesis
Systemic lupus
erythematosus
Prostate cancer
In addition to reliance on databases, Complemen-
tary Domain Prioritization relies on the data qual-
ity of the secondary domain. Current shotgun pro-
teomics data sets are prone to false negatives by the
very nature of mass spectrometric analysis. As newer
techniques and technologies are developed and per-
fected, such as data independent analysis, false neg-
ative rates should decrease though this still poses a
problem when integrating across domains. For ex-
ample, the type of sample preparation and separa-
tion may not perform well at isolating and identify-
ing membrane-bound proteins, which could handicap
the Complementary Domain Prioritization procedure
away from signaling cascades. Proteomic analysis
also varies greatly in coverage (or sampling depth)
of the proteome based on separation techniques and
speed/resolution of the mass spectrometer. Our re-
sults demonstrate that a set of 800 proteins (Marra
data set) or 7,000 proteins (TCGA CRCa data set)
can successfully be used to prioritize companion tran-
scriptomic data. It is likely that there are more false
negatives in the smaller protein data set and using this
set is likely prioritizing pathways with higher abun-
dance proteins. If the goal is to discover a biomarker
with clinical utility, then this limitation is actually
an advantage at prioritizing transcript changes that
are related to measurable protein changes. Regard-
less, as both proteomic analysis and database quality
improves, Complementary Domain Prioritization will
also improve.
It was not the goal of this study to compare re-
sults to the original transcriptomic analysis. Regard-
less, using Complementary Domain Prioritization fol-
lowed by unsupervised filtering performed better at
detecting known cancer-related genes in both data sets
relative to filtering alone or using no filter at all. In the
first data set, the TCGA authors investigated gene ex-
pression related to tumor aggressiveness, though tu-
mor aggressiveness was not evaluated in the follow-
up proteomic analysis by Zhang et al. Using lym-
phatic invasion as a proxy of tumor aggressiveness,
our method identified more of the 40 genes related
to tumor aggressiveness than filtering alone (six ver-
sus four). If the pathways and gene sets prioritized
by the protein data did not include these 40 genes,
then they were omitted from further analysis. On av-
erage only 10 of these genes were selected follow-
ing filtering alone or prioritization followed by filter-
ing. This finding demonstrates how Complementary
Domain Prioritization can be used to improve previ-
ous results based on a single domain. In the second
data set evaluated, Cattaneo et al. evaluated polyploid
pre-cancerous colorectal lesions whereas the follow-
up proteomics analysis by Uzozie et al., and therefore
the prioritization analysis described herein, focused
on normal versus pre-cancerous lesions. The pub-
lished proteomic analysis identified alterations in sor-
bitol dehydrogenase (SORD) levels in pre-cancerous
lesions, specifically in the sorbitol-aldose reductase
pathway. Though this pathway was only ranked 163
Complementary Domain Prioritization: A Method to Improve Biologically Relevant Detection in Multi-Omic Data Sets
77

in the unfiltered transcriptomic data, following Com-
plementary Domain Prioritization (KEGG-based with
a variance filter of 50%), the rank improved to 29.
This clearly demonstrates that proteomics data can
prioritize transcriptomic data in a meaningful way
similar to published results.
In addition to having similar findings as the orig-
inal studies, Complementary Domain Prioritization
was able to highlight pathways that might have been
otherwise overlooked. Using Complementary Do-
main Prioritization and filtering of the Marra data set
identified ’Protein Processing in the ER’ as being dif-
ferent in pre-cancerous colorectal lesions. Although
only 13 differentially abundant proteins were identi-
fied in this pathway, the transcriptomic data was pri-
oritized such that this pathway was ranked 5th (versus
20th in the unfiltered data). Protein folding is known
to be crucial in many oncogenic processes, especially
ER chaperones (Luo and Lee, 2012), and may be an
area of research to pursue further. These targets could
be confirmed at the protein level by immunoblot anal-
ysis similar to the SORD confirmation in the original
study. Lastly, by using both the KEGG and WikiP pri-
oritization approaches we identified similar pathways
emphasizing the importance of the complement cas-
cade in pre-cancerous lesions. By applying Comple-
mentary Domain Prioritization to the Marra data set,
we have shown how complementary proteomic data
can drive new hypotheses, though only future exper-
iments will demonstrate the relevance of these find-
ings.
5 CONCLUSIONS
Utilizing data across biological domains is inherently
difficult because it is not fundamentally understood
how multiple changes at each domain result in phe-
notypic changes. Significant changes at the tran-
script level are not always present at the protein level
(Zhang et al., 2014; Gygi et al., 1999; Foss et al.,
2007), while studies of the low-abundance transcrip-
tome of some cancer have confirmed that changes in
low-abundance genes are responsible for deleterious
biological changes (Bizama et al., 2014). This may
be extrapolated to other domain relationships mean-
ing that moving from gene to transcript to protein
to metabolite, changes at each step are not depen-
dent on single changes at previous steps. Likewise,
this means that signal from each domain is represen-
tative of signal from a larger number of features in
the previous domain. For this reason, we did not
focus on directly combining data between domains
but instead present an approach that utilizes results
from one domain to prioritize data from the underly-
ing domain. Our results demonstrate that proteomic
data can be used to prioritize transcriptomic data,
though this approach is not limited to these comple-
mentary domains. Lipidomic data could be used to
prioritize genomic/transcriptomic/proteomic data via
LIPID MAPS pathway database, and metabolomics
data could be likewise used to prioritize data follow-
ing analysis with XCMS Online. Stepping further
away from genes in this hierarchy of biological do-
mains creates smaller and smaller prioritization lists,
but ones that are more biologically relevant to phe-
notypic changes. Utilizing data from complementary
domains as a prioritization tool can be a powerful ap-
proach to integrating complex high-dimensional bio-
logical data sets.
ACKNOWLEDGEMENTS
The authors wish to thank Benilton Carvalho for his
help utilizing the oligo R package as well as Gian-
carlo Marra and Anuli Uzozie for invaluable assis-
tance in harmonizing published data sets. This re-
search was supported in part by the National Institute
of General Medical Sciences of the National Institutes
of Health under Award Number P20GM103542, the
South Carolina SmartState Center of Economic Ex-
cellence in Proteomics, and the Medical University of
South Carolina Proteomics Center. Identification of
certain commercial equipment, instruments, software
or materials does not imply recommendation or en-
dorsement by the National Institute of Standards and
Technology, nor does it imply that the products identi-
fied are necessarily the best available for the purpose.
REFERENCES
Alves, G. and Yu, Y. K. (2014). Accuracy evaluation of the
unified P-value from combining correlated P-values.
PLoS ONE, 9(3).
Bizama, C., Benavente, F., Salvatierra, E., Guti
´
errez-
Moraga, A., Espinoza, J. a., Fern
´
andez, E. a., Roa, I.,
Mazzolini, G., Sagredo, E. a., Gidekel, M., and Pod-
hajcer, O. L. (2014). The low-abundance transcrip-
tome reveals novel biomarkers, specific intracellular
pathways and targetable genes associated with ad-
vanced gastric cancer. International Journal of Can-
cer, 134:755–764.
Boja, E. S., Kinsinger, C. R., Rodriguez, H., and Srinivas,
P. (2014). Integration of omics sciences to advance
biology and medicine. 11(1):1–12.
B
¨
ornigen, D., Tranchevent, L. C., Bonachela-Capdevila, F.,
Devriendt, K., De Moor, B., De Causmaecker, P., and
BIOINFORMATICS 2017 - 8th International Conference on Bioinformatics Models, Methods and Algorithms
78

Moreau, Y. (2012). An unbiased evaluation of gene
prioritization tools. Bioinformatics, 28(23):3081–
3088.
Bourgon, R., Gentleman, R., and Huber, W. (2010). Inde-
pendent filtering increases detection power for high-
throughput experiments. Proceedings of the National
Academy of Sciences of the United States of America,
107:9546–9551.
Cancer, T. and Atlas, G. (2012). Comprehensive molecu-
lar characterization of human colon and rectal cancer.
Nature, 487(7407):330–7.
Carvalho, B. S. and Irizarry, R. a. (2010). A framework for
oligonucleotide microarray preprocessing. Bioinfor-
matics, 26(19):2363–2367.
Cattaneo, E., Laczko, E., Buffoli, F., Zorzi, F., Bianco,
M. A., Menigatti, M., Bartosova, Z., Haider, R.,
Helmchen, B., Sabates-Bellver, J., Tiwari, A., Jiricny,
J., and Marra, G. (2011). Preinvasive colorectal le-
sion transcriptomes correlate with endoscopic mor-
phology (polypoid vs. nonpolypoid). EMBO molec-
ular medicine, 3(6):334–47.
de Klerk, E. and a.C. t Hoen, P. (2015). Alternative
mRNA transcription, processing, and translation: in-
sights from RNA sequencing. Trends in Genetics,
31(3):128–139.
Dudoit, S., Dudoit, S., Shaffer, J. P., Shaffer, J. P., Boldrick,
J. C., and Boldrick, J. C. (2003). Multiple hypothesis
testing in microarray experiments. Statistical Science,
18(1):71–103.
Foss, E. J., Radulovic, D., Shaffer, S. a., Ruderfer, D. M.,
Bedalov, A., Goodlett, D. R., and Kruglyak, L. (2007).
Genetic basis of proteome variation in yeast. Nature
genetics, 39(11):1369–1375.
Geiger, T., Wehner, a., Schaab, C., Cox, J., and Mann, M.
(2012). Comparative Proteomic Analysis of Eleven
Common Cell Lines Reveals Ubiquitous but Varying
Expression of Most Proteins. Molecular & Cellular
Proteomics, 11:M111.014050–M111.014050.
Gygi, S. P., Rochon, Y., Franza, B. R., and Aebersold,
R. (1999). Correlation between protein and mRNA
abundance in yeast. Molecular and cellular biology,
19(3):1720–1730.
Haider, S. and Pal, R. (2013). Integrated analysis of tran-
scriptomic and proteomic data. Current genomics,
14(2):91–110.
Kanehisa, M., Goto, S., Sato, Y., Kawashima, M., Furu-
michi, M., and Tanabe, M. (2014). Data, informa-
tion, knowledge and principle: Back to metabolism in
KEGG. Nucleic Acids Research, 42(D1):199–205.
Kelder, T., Pico, A. R., Hanspers, K., Van Iersel, M. P.,
Evelo, C., and Conklin, B. R. (2009). Mining biologi-
cal pathways using WikiPathways web services. PLoS
ONE, 4(7):2–5.
Kumar, D., Bansal, G., Narang, A., Basak, T., Abbas, T.,
and Dash, D. (2016). Integrating transcriptome and
proteome profiling: Strategies and applications. Pro-
teomics, pages 1–12.
Kuo, T.-C., Tian, T.-F., and Tseng, Y. J. (2013). 3Omics: a
web-based systems biology tool for analysis, integra-
tion and visualization of human transcriptomic, pro-
teomic and metabolomic data. BMC systems biology,
7(1):64–78.
Larance, M. and Lamond, A. I. (2015). Multidimensional
proteomics for cell biology. Nature Reviews Molecu-
lar Cell Biology, 16(5):268–80.
Luo, B. and Lee, a. S. (2012). The critical roles of en-
doplasmic reticulum chaperones and unfolded protein
response in tumorigenesis and anticancer therapies.
Oncogene, 32(7):805–818.
Matys, V., Kel-Margoulis, O. V., Fricke, E., Liebich, I.,
Land, S., Barre-Dirrie, A., Reuter, I., Chekmenev,
D., Krull, M., Hornischer, K., Voss, N., Stegmaier,
P., Lewicki-Potapov, B., Saxel, H., Kel, a. E., and
Wingender, E. (2006). TRANSFAC and its mod-
ule TRANSCompel: transcriptional gene regulation
in eukaryotes. Nucleic acids research, 34(Database
issue):D108–D110.
Neely, B. A., Wilkins, C. E., Marlow, L. A., Malyarenko,
D., Kim, Y., Ignatchenko, A., Sasinowska, H., Sasi-
nowski, M., Nyalwidhe, J. O., Kislinger, T., Cop-
land, J. A., and Drake, R. R. (2016). Proteotranscrip-
tomic Analysis Reveals Stage Specific Changes in the
Molecular Landscape of Clear-Cell Renal Cell Carci-
noma. PloS one, 11(4):e0154074.
Pirhaji, L., Milani, P., Leidl, M., Curran, T., Avila-
Pacheco, J., Clish, C. B., White, F. M., Saghatelian,
A., and Fraenkel, E. (2016). Revealing disease-
associated pathways by network integration of untar-
geted metabolomics. Nature methods, 13(9):770–776.
Piruzian, E., Bruskin, S., Ishkin, A., Abdeev, R.,
Moshkovskii, S., Melnik, S., Nikolsky, Y., and Nikol-
skaya, T. (2010). Integrated network analysis of tran-
scriptomic and proteomic data in psoriasis. BMC sys-
tems biology, 4(41).
Polpitiya, A. D., Qian, W. J., Jaitly, N., Petyuk, V. a.,
Adkins, J. N., Camp, D. G., Anderson, G. a., and
Smith, R. D. (2008). DAnTE: A statistical tool for
quantitative analysis of -omics data. Bioinformatics,
24(13):1556–1558.
Robinson, M. D. and Smyth, G. K. (2007). Mod-
erated statistical tests for assessing differences in
tag abundance. Bioinformatics (Oxford, England),
23(21):2881–7.
Shimwell, N. J., Bryan, R. T., Wei, W., James, N. D.,
Cheng, K. K., Zeegers, M. P., Johnson, P. J., Martin,
a., and Ward, D. G. (2013). Combined proteome and
transcriptome analyses for the discovery of urinary
biomarkers for urothelial carcinoma. British journal
of cancer, 108(9):1854–61.
Smyth, G. K. (2004). Linear Models and Empirical Bayes
Methods for Assessing Differential Expression in Mi-
croarray Experiments Linear Models and Empirical
Bayes Methods for Assessing Differential Expression
in Microarray Experiments. Statistical applications in
genetics and molecular biology, 3(1):1–26.
Talloen, W., Clevert, D.-A., Hochreiter, S., Amaratunga, D.,
Bijnens, L., Kass, S., and G
¨
ohlmann, H. W. H. (2007).
I/NI-calls for the exclusion of non-informative genes:
a highly effective filtering tool for microarray data.
Bioinformatics (Oxford, England), 23(21):2897–902.
Complementary Domain Prioritization: A Method to Improve Biologically Relevant Detection in Multi-Omic Data Sets
79

Uhl
´
en, M., Fagerberg, L., Hallstr
¨
om, B. M., Lindskog, C.,
Oksvold, P., Mardinoglu, A., Sivertsson,
˚
A., Kampf,
C., Sj
¨
ostedt, E., Asplund, A., Olsson, I., Edlund, K.,
Lundberg, E., Navani, S., Szigyarto, C. A.-k., Ode-
berg, J., Djureinovic, D., Takanen, J. O., Hober, S.,
Alm, T., Edqvist, P.-h., Berling, H., Tegel, H., Mulder,
J., Rockberg, J., Nilsson, P., Schwenk, J. M., Ham-
sten, M., Feilitzen, K. V., Forsberg, M., Persson, L.,
Johansson, F., Zwahlen, M., Heijne, G. V., Nielsen, J.,
and Pont
´
en, F. (2015). Tissue-based map of the human
proteome. Science, 347(6220):1260419.
Uzozie, A., Nanni, P., Staiano, T., Grossmann, J., Barkow-
Oesterreicher, S., Shay, J. W., Tiwari, A., Buffoli, F.,
Laczko, E., and Marra, G. (2014). Sorbitol dehydro-
genase overexpression and other aspects of dysregu-
lated protein expression in human precancerous col-
orectal neoplasms: a quantitative proteomics study.
Molecular & Cellular Proteomics, 13(5):1198–1218.
Wang, J., Duncan, D., Shi, Z., and Zhang, B. (2013). WEB-
based GEne SeT AnaLysis Toolkit (WebGestalt): up-
date 2013. Nucleic acids research, 41(Web Server
issue):77–83.
Zhang, B., Wang, J., Wang, X., Zhu, J., Liu, Q., Shi, Z.,
Chambers, M. C., Zimmerman, L. J., Shaddox, K. F.,
Kim, S., Davies, S. R., Wang, S., Wang, P., Kinsinger,
C. R., Rivers, R. C., Rodriguez, H., Townsend, R. R.,
Ellis, M. J. C., Carr, S. a., Tabb, D. L., Coffey, R. J.,
Slebos, R. J. C., and Liebler, D. C. (2014). Proteoge-
nomic characterization of human colon and rectal can-
cer. Nature, 513(7518):382–387.
BIOINFORMATICS 2017 - 8th International Conference on Bioinformatics Models, Methods and Algorithms
80
