
Acousto-optic Spectrum Analyzer
The New Type of Optoelectronic Device
Sergey Mantsevich
1
, Vladimir Balakshy
1
and Yury Kuznetsov
1
Physics, M. V. Lomonosov Moscow State University, Leninskye Gory 1, 119991, Moscow, Russian Federation
Keywords: Acousto-optic Interaction, Feedback, Optical Radiation Spectrum, Collinear Diffraction, Acousto-optic
Filter.
Abstract: The new optoelectronic system combining calcium molybdate collinear acousto-optic cell and positive
electronic feedback is proposed and examined both experimentally and theoretically. The feedback signal is
formed at the cell output due to the optical heterodyning effect with the use of an unconventional regime of
collinear cell operation. It is shown that the feedback circuit parameters enable controlling spectral
characteristics of the acousto-optic cell, resulting in enhancing the maximal spectral resolution and the
accuracy of optical wavelength determination. This system may be treated as the optical radiation spectrum
analyzer, as the spectrum of electric signal in the feedback circuit is related with the light spectrum on the
system input.
1 INTRODUCTION
Acousto-optic (AO) interaction is one of the main
effects used for optical radiation parameters control
and examination. The phase diffraction grating
induced inside the AO cell by acoustic waves allows
controlling the propagation direction, amplitude,
frequency and polarization of an optical wave
(Goutzoulis, Pape 1994).
AO systems with feedback is the class of
optoelectronic instruments that expand the scope of
optical information processing problems that can be
solved by AO methods. This type of AO systems is
comparatively new and poorly studied. It is known
that the introduction of feedback allows to improve
characteristics of conventional devices and to create
absolutely new devices of laser physics and optical
information processing (J. Chrostowski, 1982; Poon,
1989, Balakshy, 1996).
The feedback in these systems is hybrid: an
optical signal in one of the diffraction maxima at the
AO cell output is transformed by a photodetector
into an electrical signal that controls magnitude
(Balakshy, 2014) or frequency (Balakshy 1995,
Balakshy, 1999) of an acoustic wave excited in the
cell. The behaviour of the feedback AO systems is
extremely complicated. Diverse oscillations
(including harmonic, self-modulation and chaotic
ones) can be excited (Balakshy, 2014).
The AO feedback systems have two important
features. First, such systems are basically distributed
because the time of acoustic wave propagation in the
cell is compared with the period of oscillations.
Second, these systems are principally nonlinear and
the character of nonlinearities affects the system
behaviour. The nonlinearities, concerned in the first
place with the AO cell, give rise to diversity of
regimes, but, at the same time, they complicate the
analysis of the systems.
In this paper, an electronic feedback is added to
the collinear AO cell fabricated of calcium
molybdate crystal (CaMoO
4
) (Harris et.al., 1970;
Balakshy, 2009).
The resulting system is unique and has no
analogues among the known AO devices
The theoretical and experimental analysis is
carried for this optoelectronic system. It is shown
that the positive feedback makes it possible to
control the shape of the filter transmission function
and to suppers the function side lobes resulting in
significant enhancement of the spectral resolution
and the accuracy of optical wavelength
determination. The examined system may be treated
as optical spectrum analyzer.
Mantsevich S., Balakshy V. and Kuznetsov Y.
Acousto-optic Spectrum Analyzer - The New Type of Optoelectronic Device.
DOI: 10.5220/0006151402370244
In Proceedings of the 5th International Conference on Photonics, Optics and Laser Technology (PHOTOPTICS 2017), pages 237-244
ISBN: 978-989-758-223-3
Copyright
c
2017 by SCITEPRESS – Science and Technology Publications, Lda. All rights reserved
237
2 LIGHT INTENSITY
MODULATION
The system operation is based on the effect of light
intensity modulation effect, predicted and observed
experimentally in (Balakshy, 2009; Balakshy 2012).
It was reported there that the special case of
collinear AO interaction exists that can provide
intensity modulation of the output optical radiation
at the frequency of the traveling acoustic wave. This
peculiarity gives the possibility to introduce the
feedback circuit to feed the AO cell transducer by
the modulated signal from photodetector.
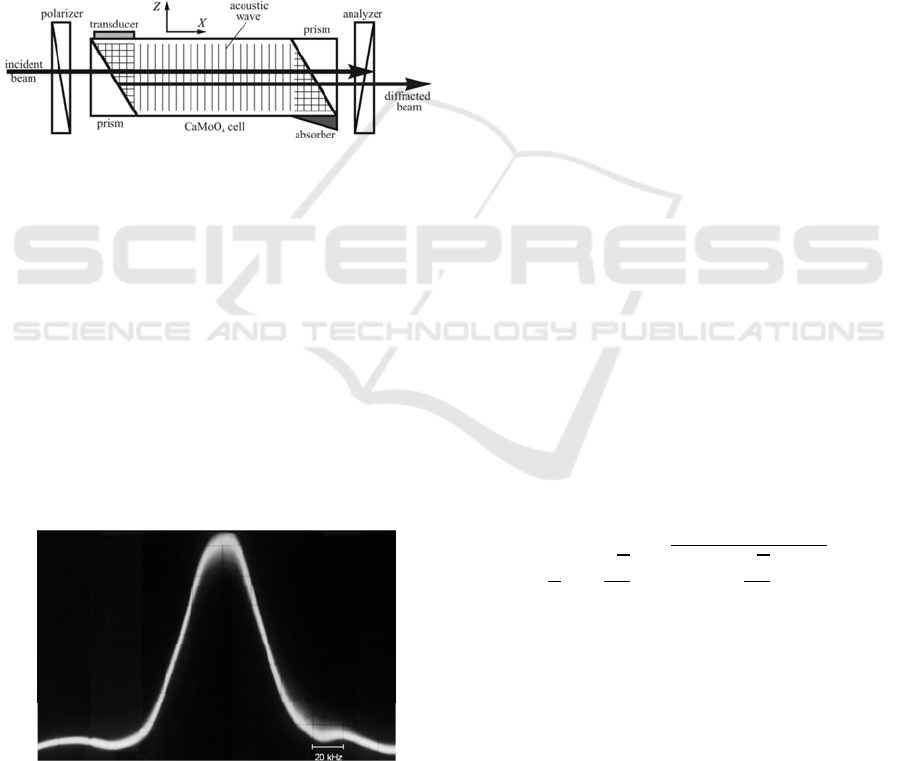
The scheme of conventional collinear AO filter
is presented at figure 1.
Figure 1: Collinear AO filter scheme.
In the conventional variant of AO collinear filter
(Harris et.al., 1970; Balakshy, 2009), polarization of
the incident light is set in accordance with the crystal
eigenmode polarizations (polarization angle α is
equal to 90° or 0° with regard to the Y axis). In the
process of AO interaction, the light polarization
changes to the orthogonal one (anisotropic
diffraction). Therefore, crossed analyzer
(polarization angle α is equal to 90° or 0°,
respectively) let pass only the diffracted optical
radiation.
The transmission function of the filter used in the
experimental setup is presented at figure 2, the filter
passband equals 0.9nm in this case.
Figure 2: Transmission function of conventional collinear
AO filter.
Quite another situation appears in the special
case, when the incident optical wave has
polarization which differs from the eigenmode
polarizations. In this case, the wave, entering the AO
cell, is split into two waves with amplitudes
(ordinary mode) and
(extraordinary mode)
which are polarized along the Y and Z
crystallographic axes. These waves diffract in the
acoustic field independently and with equal
efficiency. The ordinary wave
is scattered into
the +1
st
diffraction order, forming the waves
(the
zeroth order with ordinary polarization) and
(the +1
st
order with extraordinary polarization). The
extraordinary optical wave
diffracts in a similar
manner into –1
st
order, forming the waves
and
. The optical waves of the zeroth order
and
have the frequency ω equal to the frequency of
the incident light, whereas the waves
and
have frequencies ω+ and ω- , respectively.
The analyzer oriented at the angle let pass
through only a part of the light components. The
beatings of the components with frequency shift and
unshifted components result in the modulation of
output light intensity with ultrasound frequency. The
light intensity on the system output may be written
as the sum of three components:
=
|
cos
sin
|
(1)
=
cos
Ω
Φ
cos
2Ω
2Φ
(2)
Amplitudes of I
1
and I
2
components depend on
the polarizer and analyzer orientations. The I
1
component has intensity modulation with ultrasound
frequency aroused in the AO cell. That is why it may
be used to feed the AO cell transducer with feedback
circuit. The magnitude of this component is
described by equation:
=
Γ
sin
√
2
∙
Γ
cos
√
2
(3)
where =Γ
, Γ is the Raman-Nath parameter
(AO coupling coefficient) which is proportional to
the acoustic wave amplitude and =
2
⁄
is the dimensionless phase mismatch [1]. In the
last equation l is the AO interaction length, f –
ultrasound frequency, f
c
is the phase matching
frequency for the given optical wavelength, V is the
acoustic wave velocity along X crystallographic
axis. The AO filter transmission function for I
1
component is presented at figure 3.
PHOTOPTICS 2017 - 5th International Conference on Photonics, Optics and Laser Technology
238
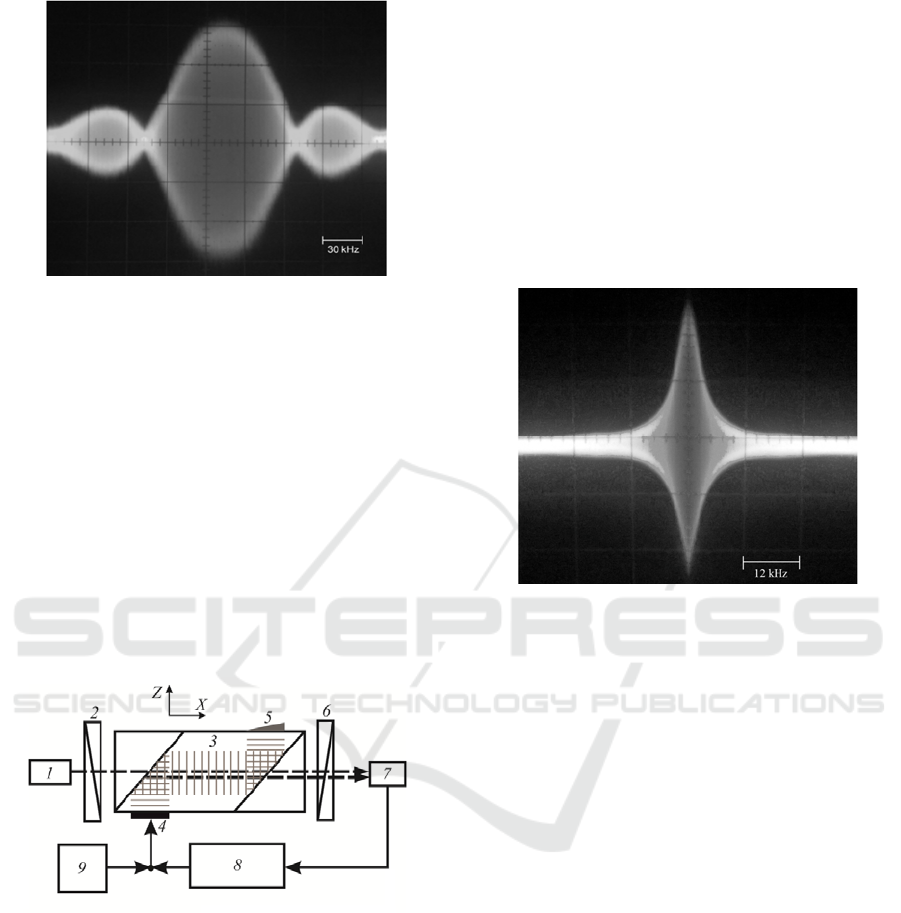
Figure 3: AO collinear filter transmission function for
I
1
component.
It is possible to see the intensity modulation with
frequency. Also the shape of transmission
function differs from the conventional one. It has flat
top, higher side lobes and wider passband (1.5nm at
3dB level).
3 FEEDBACK INFLUENCE
The existence of I
1
component modulated with
ultrasound frequency makes it possible to introduce
feedback circuit (figure 4) (Balakshy et.al., 2016,
Mantsevich et.al. 2016).
Figure 4: AO spectrum analyzer scheme.
An optical beam from laser 1 passes through
polarizer 2 and enters collinear AO cell 3. A
longitudinal acoustic wave is excited in the cell by
piezoelectric transducer 4 and after the reflection
propagates along X axis. The light beam passes
through the cell along the X axis as well. The regime
of travelling acoustic waves is ensured by acoustic
absorber 5. The diffracted radiation was registered
by photodetector 7 and its output signal at the
frequency f was sent through feedback 8 to the
transducer together with the signal of HF generator
9. The feedback circuit had tuneable gain factor to
30dB and phase shifter which provided phase tuning
to an optimal meaning. The spectrum of electric
signal in the feedback circuit is defined by the
optical spectrum on the AO cell input and may be
registered by the RF spectrum analyzer.
The feedback appearance changes dramatically
the shape of transmission function presented at
figure 2. Also tuning the circuit gain factor it is
possible to control the shape and passband of the
system transmission function. One of the
transmission functions obtained in the experiment is
presented at figure 5.
Figure 5: AO filter transmission function with feedback.
The transmission function side lobes disappeared
and the transmission band δf noticeably narrowed.
The sharpening of the spectral characteristic occurs
because the feedback coefficient is proportional to
the photodetector signal amplitude. For the
oscillogram presented in figure 5, =4.8 kHz,
=0.075 nm and contrast =60 ( is a ratio of
the transmission coefficient at the characteristic
maximum to the transmission in the first side
lobe). Thus, the narrowing of the AO filtration band
is as great as 20 times, that corresponds to the same
increasing the accuracy of the optical wavelength
measurement. In our experiments, the maximal
narrowing δf ranged up to approximately 40 times.
4 THEORETICAL MODEL
Considering the second section of the paper and fig.
4 it is possible to write the following equation
describing the photodetector 7 output signal at Ω
frequency (Balakshy et.al., 2016, Mantsevich et.al.
2016).
Ω
=
1
=
1
cos
Ω
1
,
(4)
Acousto-optic Spectrum Analyzer - The New Type of Optoelectronic Device
239
where σ is the detector sensitivity. The voltage at the
AO cell transducer may be written in the form
U
t
=U
sinΩtσ
μ
I
cos
Ωtφ
χ
=Γ
Γ
γ
,
⁄
(5)
if the feedback circuit has the amplification
coefficient μ. In equation (5) U
is the HF generator
signal magnitude, χ is the phase shift in the phase
shifter and γ is the transducer conversion factor.
The conditions of phase equation (6) and
magnitude balance equation (7) for the examined
system are the following:
Ω
√
√
2
=2
(6)
4
√
2
∙
∙
4cos
√
2
√
2
=1
(7)
where =Γ
is like in the equation (3).
Equations (6) and (7) form the nonlinear system
relatively to the variables Γ (normalized magnitude
of ultrasound signal) and R (normalized ultrasound
frequency). The solution of this system of equations
permits to analyze the behavior and characteristics
of the examined optoelectronic system.
4.1 Transmission functions simulation
We will examine the influence of feedback circuit
on the collinear AO filter spectral characteristics in
this part of the paper. The transmission functions are
calculated by substitution into equation (3) the
values of Γ and R parameters obtained from
numerical solution of equations (6) and (7) system.
The equation (5) gives the transmission function
shape, defining the AO diffraction efficiency,
spectral passband and contrast.
We assume that the optical wavelength of
incident radiation is 655nm, the AO interaction
length in the cell is 4 cm, the detector sensitivity is
σ=0.7, the transducer conversion factor γ=0.9
(such parameters meet the characteristics of the
experimental set up).
The transmission functions I
R
simulations for
various values of feedback circuit gain μ and
generator signal magnitude defined by Raman-Nath
parameter Γ
were carried at first. The results of
computations are presented at figure 6a,b.
(a)
(b)
Figure 6: AO collinear cell with feedback circuit
transmission functions. a – Raman-Nath parameter Γ
=
π10
⁄
. b - Γ
=π 400
⁄
.
Figure 6 represents transmission functions of
collinear AO cell simulated for various feedback
gain μ (it should be noted that the value of gain
coefficient μ is normalized and didn’t match with
experimental one) for two Ramam-Nath parameters
Γ
=π 10
⁄
(figure 6a) and Γ
=π 400
⁄
(figure 6b).
Such magnitudes of Γ
g
indicate that the acoustic
power from generator is lower in 100 and 16·10
4
times correspondingly than needed to obtain
maximal diffraction efficiency at the traditional case
of collinear AO cell running without feedback.
The following conclusions can be drawn after
examining the dependences at figure 6. Firstly,
increasing the feedback gain it is possible to achieve
maximal diffraction efficiency for arbitrary value of
Γ
g
parameter. Secondly, the magnitude of system
with feedback transmission function side lobes is
determined by the magnitude of AO collinear cell
transmission function without feedback obtained for
the same Γ
g
parameter (curve 2 at figure 6a and
PHOTOPTICS 2017 - 5th International Conference on Photonics, Optics and Laser Technology
240
curve 1 at figure 6b). Thus, reducing Γ
g
and
simultaneously increasing μ the spectral contrast κ
can be improved. For example, κ=14.5 for curve 5
at figure 6a, this vale significantly exceeds spectral
contrast of conventional collinear filter. Spectral
contrast equals 145 for the curve 5 at figure 6b and
this value is higher than values ever mentioned in
literature (Mazur et.al., 1996). Thirdly, comparing
various curves at figure 6 we may conclude that for
every Γ
g
value exists optimal gain value that
provides minimal passband of the system.
Maximal AO diffraction efficiency ζ=I
I
⁄
reduce with the decrease of system passband. The
passband of transmission function 3 at figure 6a is in
1.3 times less than for the conventional collinear AO
filter with the same interaction length but with
diffraction efficiency near 56%. For the curve 2 at
figure 6b passband is in 3.5 times narrower than for
the collinear AO filter without feedback but the
diffraction efficiency will be about 46%.
Our simulations have shown that 0.05nm
passband may be achieved, but the diffraction
efficiency in this case reduces to 6%. The passband
of the curve 5 at figure 6b is 20% narrower than for
the traditional collinear AO filter with the same AO
interaction length but the diffraction efficiency is
still maximal and spectral contrast =145. These
parameters indicate that system with feedback has
great advantages for spectroscopic applications.
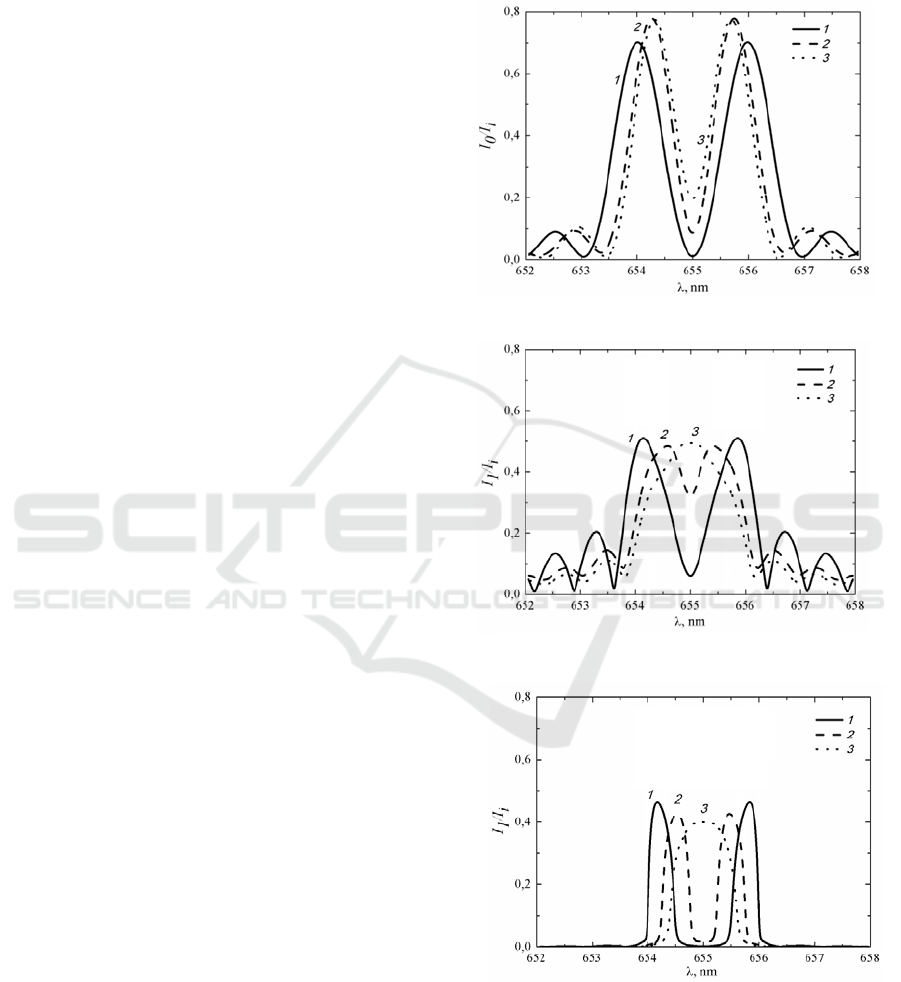
4.2 Spectral resolution determination
Let’s pretend that the optical radiation containing
two optical wavelengths λ
1
and λ
2
passes through the
examined system. We will simulate the spectral
dependences of optical signal on the output of AO
cell for such incident radiation for the following
cases: collinear AO filter in traditional geometry
(figure 7a) (Harris et.al.,1970), collinear AO filter
with special orientation of polarizer and analyzer
(figure 7b) without feedback (Balakshy,Mantsevich,
2009) and our system containing collinear AO cell
and feedback (figure 7c). Three curves were
calculated for each case for three pairs of optical
wavelengths: curve 1 - λ
1
=654 nm, λ
2
=656 nm, Δλ=
2 nm; curve 2 - λ
1
=654.25 nm, , λ
2
=655.75 nm,
Δλ=1.5 nm; curve 3 - λ
1
=654.335 nm, λ
2
=655.665
nm, Δλ=1.33 nm.
Figure 7a represents the dependence of diffracted
light intensity on optical wavelength for the
conventional collinear AO filter. These curves have
two main maxima that correspond to the incident
optical radiation wavelengths. The examined
collinear AO filter with 4cm AO interaction length
resolve light spectrum components well for all three
cases but it doesn’t provide high spectral contrast.
The transmission functions intersect at levels 1.5%,
11,1% and 25.5% from maximal value for curves
(a)
(b)
(c)
Figure 7: AO collinear cell spectral response on incident
light with two spectral components. a – conventional AO
cell; b - AO cell with specific polarizer orientation; c –
AO cell with feedback, Γ
g
= π/200, μ=4. curve 1 - Δλ=2
nm; curve 2 - Δλ=1.5 nm; curve 3 - Δλ=1.33 nm.
Acousto-optic Spectrum Analyzer - The New Type of Optoelectronic Device
241
1-3 correspondingly (central minimum of the
dependences). If we simulate the same dependences
for the same AO cell but with special polarizer and
analyzer orientation the significant differences could
be observed. Firstly, the spectral contrast is worse
than for conventional collinear AO filter. Secondly,
the deterioration of spectral resolution occurs, the
value Δ=1.33 (curve 3 at figure 7b) is marginal
for this case.
The situation changes significantly if we
introduce the feedback circuit. The results of
calculations for the collinear AO cell with feedback
(Γ
g
= π/200 , =4) are presented at figure 7c. The
side lobes of transmission function are suppressed
hence the spectral contrast increases in comparison
with the traditional geometry. Transmission
functions overlap at the level 0.4% and 4% from
maximal for curves 1 and 2 correspondingly. It is
possible to enhance the spectral contrast by reducing
Γ
g
and increasing values. Nevertheless the spectral
resolution of the system decreases, it will be set by
the dependences at figure 7b as exactly these curves
are transformed under the action of the feedback.
That is why the system is not able to select two
spectral lines separated by spectral interval Δ=
1.33 nm (curve 3). But the spectral lines displaced at
wider intervals Δ will be selected well without
overlapping.
The theoretical simulations presented at figure 7
were verified in experiment. The results of the
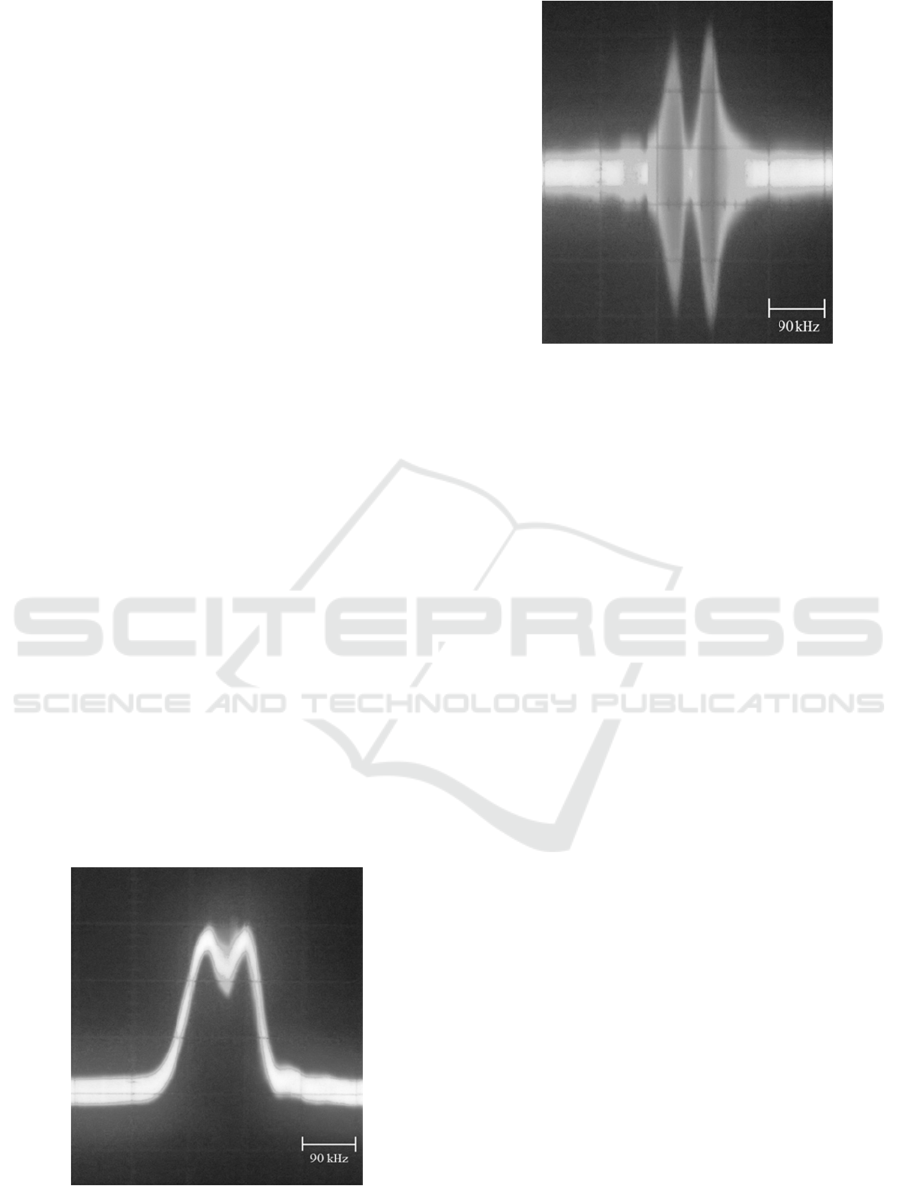
experimental investigation are presented at figure 8.
Here the spectral response of the conventional
collinear AO filter (figure 8a) and AO system with
feedback (figure 8b) for the optical radiation (near
655nm) containing two components with spectral
interval Δ=1.4 nm are presented. Both figures
have the same scale.
(a)
(b)
Figure 8: AO collinear cell spectral response for incident
optical radiation with two spectral components.
a – conventional AO cell; b – AO cell with feedback,
Δλ=1.4 nm.
The deviation of diffracted light intensity in the
centre of the conventional collinear AO filter
spectral response curve is approximately 15%. The
feedback appearance strongly sharpens the spectral
response of the system and the spectral components
became clearly distinguishable.
4.3 Nonlinear effects in the system
The examined optoelectronic system, as the most
part of the electronic systems with feedback, is
nonlinear. The nonlinearity is one of the main
constraints and appears as the diffraction efficiency
dependence on the incident optical radiation
intensity
in this case.
The nonlinearity causes the distortion of system
spectral response, when optical spectral components
pass through the system with varied amplification.
Let’s define the coefficient of diffraction efficiency
amplification ψ as the ratio of diffraction efficiency
for the system with feedback to the diffraction
efficiency I
I
⁄
without feedback. The results of
ψ
I
evaluations for the HF generator acoustic
power Γ
g
= π/100 and various feedback circuit
amplification values are presented at figure 9. These
dependences have evidently nonlinear shape. The
growth of feedback circuit amplification μ causes
the shift of ψ
I
dependences to the left and
nonlinearity may appear for lower values of incident
light intensity. The magnitude of diffraction
efficiency amplification is in the range between 1
and 25 for Γ
g
= π/100 , this mean that some spectral
components of light will pass through the system
PHOTOPTICS 2017 - 5th International Conference on Photonics, Optics and Laser Technology
242
(a)
(b)
(c)
Figure 9: AO collinear cell with feedback nonlinearity.
a - diffraction efficiency amplification ψ
I
evaluations,
Γ
g
= π/100 , λ=655 nm; curve 1 - μ=4.5, curve 2 - μ=
5.5, curve 3 - μ=6.5; b - experimentally measured
conventional collinear AO filter spectral response; c –
experimentally measured collinear AO filter with feedback
spectral response
without any amplification and some other will be
amplified in 25 times.
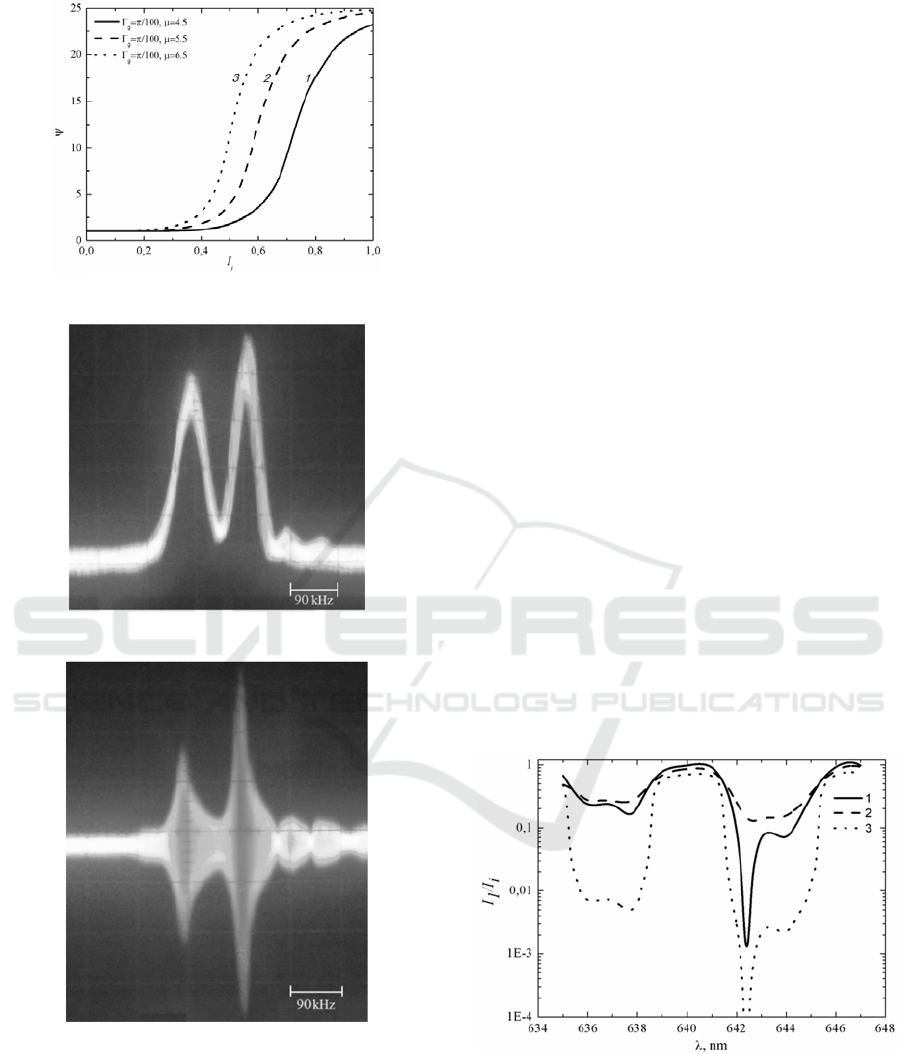
The experimental verification of nonlinearity
existence was carried in the following way. Optical
radiation containing two spectral components with
diverse intensity (20% difference) is applied to the
system optical input. The spectral response on such
signal was registered by conventional AO filter
(figure 9b, AO filter is the linear system by light)
and by the system with feedback (figure 9c).
Comparing the oscillograms figures 9b and 9c it can
be seen that the difference between diffracted
radiation intensities is much lower for the
conventional AO filter (20% difference) than for the
AO system with feedback (46% difference).
4.4 The continuous input optical
spectrum case
The examined AO system nonlinearity has both
positive and negative influence. On one hand the
nonlinearity disturbs the spectral response of the
system, and on the other hand it enhances the light
spectrum contrast.
AO tunable filters are widely used for spectral
analysis to date (Mazur et.al, 1996; Mantsevich
et.al., 2015). In this application the incident light has
continuous spectrum with some peculiarities, for
example, absorption bands of gases.
Let’s treat the case when incident optical
radiation has continuous spectrum
shown by
curve 1 at figure 10.
Figure 10: AO optical spectrum analyzer operation. Curve
1 – spectrum on the input I
λ
, curve 2 – light spectrum
on the output of conventional collinear AO filter Γ=π,
curve 3 – light spectrum on the output of AO system with
feedback
Γ
g
= π/100
, μ=5.5.
It is possible to simulate the spectrum of optical
radiation on the output of conventional collinear AO
Acousto-optic Spectrum Analyzer - The New Type of Optoelectronic Device
243

filter (curve 2 figure 10) and on the output of
collinear AO cell with feedback (curve 3 figure 10),
for the curve 3 the parameters AO interaction
parameters were: Γ
g
= π/100, =5.5.
Curve 2 differs much from the curve 1. The
reason of this difference is that the conventional
collinear AO filter transmission function has side
lobes that let pass the undesirable spectral
components and cause the smoothing of diffracted
light spectrum peculiarities and significantly distort
its shape.
Thereby the real spectral resolution of the AO
filter is much lower than the filter transmission
function passband (approximately in 10 times).
If we use the AO system with feedback the high
spectral contrast gives the possibility to dispose the
side lobes and to let pass only the spectral
components that fit the passband. Consequently the
shape of curve 3 at figure 10 is much closer to the
shape of curve 1, except the spectrum contrast. The
growth of light spectrum contrast is caused by the
AO system nonlinearity, but this distortion could be
corrected using the dependences presented at figure
9 and calibrations.
5 CONCLUSIONS
In this paper, we have analyzed the functioning of
the optoelectronic system containing the collinear
AO filter and electronic feedback. This feedback is
implemented due to a special geometry of AO
interaction in the collinear cell, when light
diffraction by a traveling acoustic wave is
accompanied by light intensity modulation at the
acoustic frequency f. Due to this peculiarity, the
output signal of the photodetector contains the
component that could feed the cell transducer
together with the RF generator. The feedback action
results in narrowing the system spectral passband
and, consequently, increasing the accuracy of optical
wavelength measurement. The main advantage of
the examined system is that the shape of the filter
transmission function can be controlled through the
gain factor of the feedback amplifier. It can be used
for conversion of the optical spectrum into the
electrical one.
The system spectral resolution is limited by the
AO collinear filter passband without feedback.
The examined system may be considered as a
new type of spectrum analyzer but with taking into
consideration the feedback nonlinearity. This
nonlinearity can be taken into account at computer
processing of the output signal and calibrations.
ACKNOWLEDGEMENTS
The work has been supported by the Russian
Science Foundation (RSF), project 14-22-00042.
REFERENCES
A.P. Goutzoulis and D.R. Pape, 1994, Design and
Fabrication of Acousto-Optic Devices. M. Dekker,
Inc., N.Y.,
J. Chrostowski, C. Delisle, 1982, Bistable optical
switching based on Bragg diffraction, Opt. Commun.
41(2), 71-74.
T.-C. Poon, S.K. Cheung, 1989, Performance of a hybrid
bistable device using an acoustooptic modulator, Appl.
Opt. 28(22), 4787-91.
V.I. Balakshii, A.V. Kazar'yan, A.A. Lee, 1995,
Multistability in an acousto-optical system with a
frequency feedback, Quant. Electron. 25(10), 940-
945.
V.I. Balakshy, A.V. Kazaryan, 1999, Laser beam direction
stabilization by means of Bragg diffraction, Opt. Eng.
38(7), 1154-1159.
V.I. Balakshy, I.A. Nagaeva, 1996, Optoelectronic
generator based on the acousto-optical interaction,
Quant. Electron. 26(3), 254-258.
V.I. Balakshy, Yu.I. Kuznetsov, S.N. Mantsevich, N.V.
Polikarpova, 2014, Dynamic processes in an acousto-
optic laser beam intensity stabilization system, Optics
& Laser Techn. 62, 89-94
S.E. Harris, S.T.K. Nieh, R.S. Feigelson, 1970, CaMoO
4
electronically tunable optical filter, Appl. Phys. Lett.
17(5), 223-225.
V.I. Balakshy, S.N. Mantsevich, 2009, Influence of light
polarization on characteristics of a collinear
acoustooptic diffraction, Opt. & Spectr. 106(3), 441-
445.
V.I. Balakshy, S.N. Mantsevich, 2012, Polarization effects
at collinear acousto-optic interaction, Opt. & Laser
Techn. 44(4), 893-898.
Balakshy V.I., Kuznetsov Yu I., Mantsevich S.N., 2016,
Effect of optoelectronic feedback on the characteristics
of acousto-optical collinear filtering, Quant. Electron.,
46( 2), 181-184.
Mantsevich S.N., Balakshy V.I., Kuznetsov Yu I., 2016,
Effect of feedback loop on the resolution of acousto-
optic spectrometer, Phys. of Wave Phen. 24(2), 135-
141.
M.M. Mazur, V.N. Shorin, A.Yu. Abramov, Z.A.
Magometov, and L.I. Mazur, 1996, Spectrometer with
double acousto-optical monochromator, Opt. &
Spectr. 81, 475-477.
S.N. Mantsevich, V.I. Balakshy, Molchanov V.Ya.,
Yushkov K.B., 2015, Influence of acoustic anisotropy
in paratellurite on quasicollinear acousto-optic
interaction, Ultrason., 63, 39-46.
PHOTOPTICS 2017 - 5th International Conference on Photonics, Optics and Laser Technology
244
